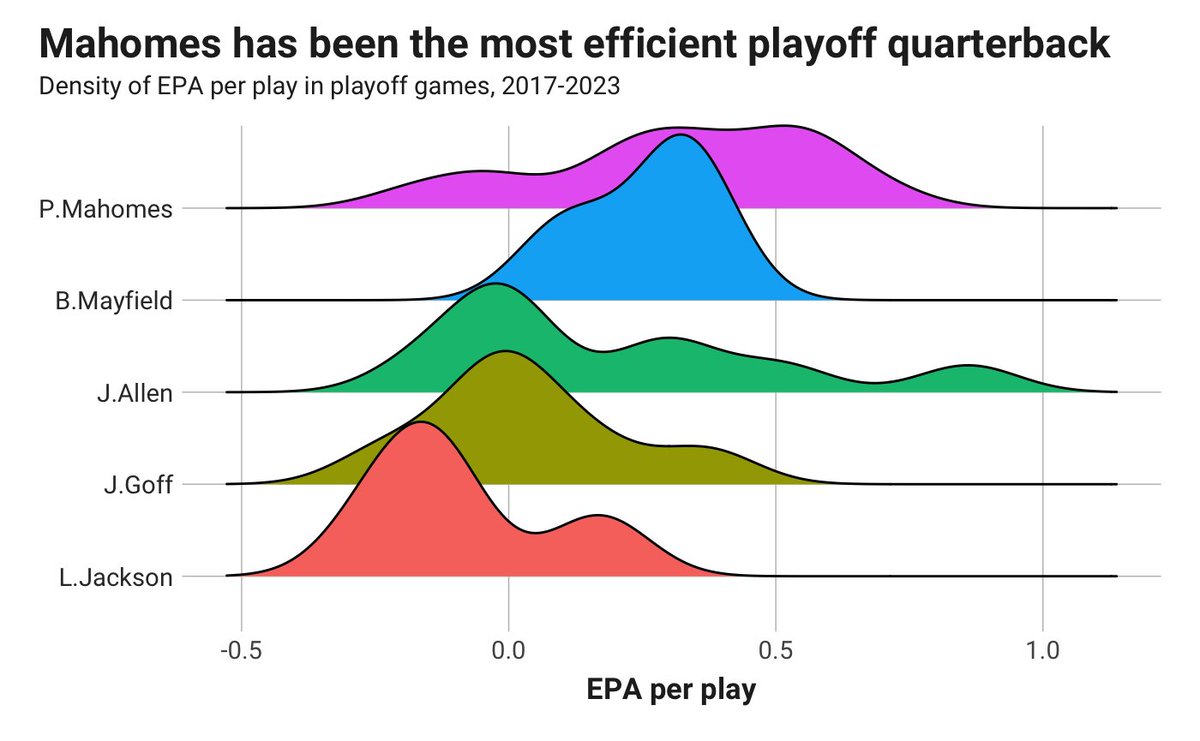
In a year with a lot of inexperienced quarterbacks, there is no playoff distribution of efficiencies for single-game starters (Stroud, Love, Purdy). Here are the rest.
Number of games in the samples
Mahomes: 15
Mayfield: 3
Allen: 9
Goff: 7
Jackson: 4
@bburkeESPN when utilizing win probability models to determine 4th down decisions, should we be using prediction intervals also? If a prediction interval crosses zero then we would call it a toss up? I see people saying +1% and they should go for it
@tangotiger So I think I understand. Throwing a ball on a 0-0 count adds 0.04 runs. Are you saying my model should be closer to 0.04 on average when a ball is thrown on a 0-0 count?
@tangotiger Does this model not account for the count? Most of the highest xp_wOBAs are bad pitcher counts like 3-1 and 3-0 and the lowest are good pitcher counts like 0-2 and 1-2. The model basically replicates that first chart but then adds in extra features.
@tangotiger Thanks! I only modeled with event data. So if a batter takes a first pitch then the expected value is in terms of if the PA were to end on that pitch. Basically, were the batter to put it in play, what is the expected value.
⚾ Can we measure the quality of a pitch in the MLB? ⚾
I developed an xgBoost model that attempts to do that.
#RStats#DataScience
https://t.co/Za0fWVv3gl
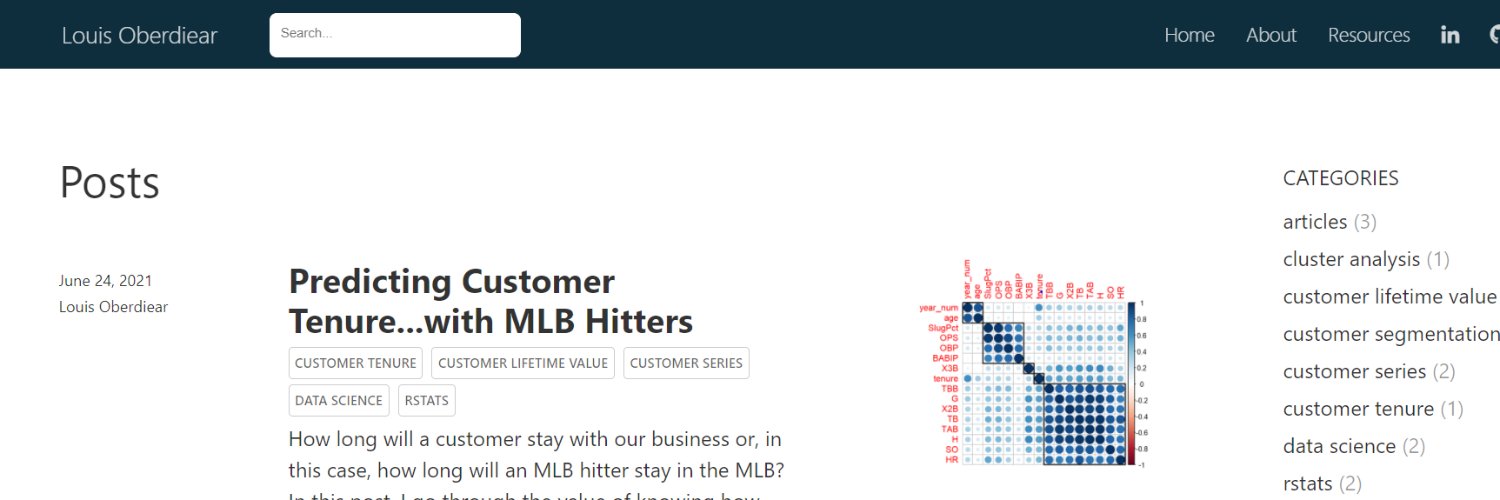
Predicting Customer Tenure...with MLB Hitters.
How accurately can we predict how long a MLB hitter will stay in the league? Who are the top young players we expect to be in the league the longest?
#datascience#rstats#mlb
https://t.co/6HRFVNpVjv
⚾️ Customer Segmentation...with MLB Players Pt. 1
What are the different types of hitters in the MLB? I tried to find out here.
https://t.co/y8bvEXLmFb
#datascience#rstats