Last week, I had the opportunity to attend Ocean Sciences Meeting 2026 in Glasgow, Scotland, joining more than 6,000 researchers dedicated to advancing ocean science.
@OSM2026 @OceanSciences @Paleoceanography @ClimateScience @Research
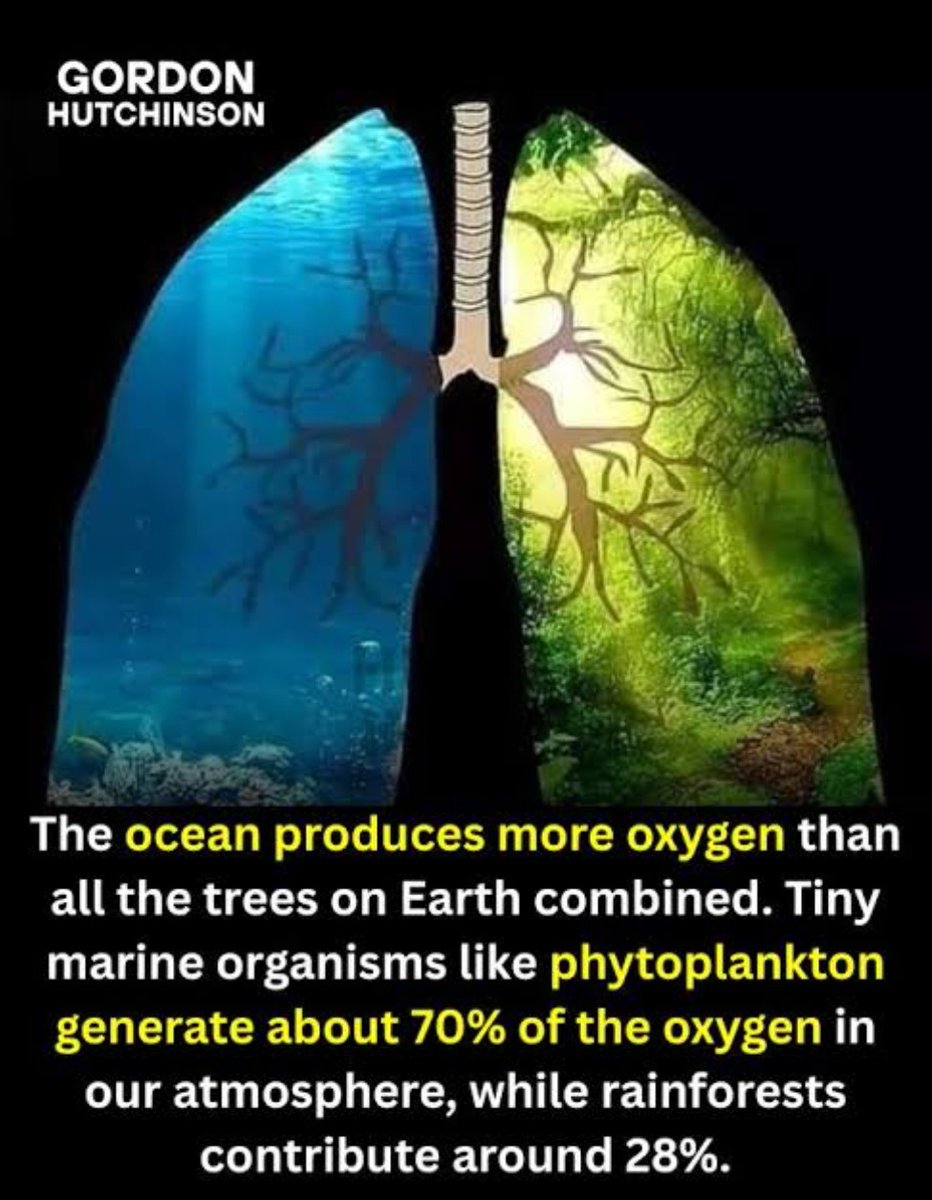
Up to 93% of the world's CO₂ is stored in the oceans & trillions of microscopic phytoplankton generate 70% of the world's entire supply of oxygen. Oceans are the control mechanism for CO₂ levels in the atmosphere & releases higher volumes in warmer periods - not human activity.
Choosing between R and Python for statistical analysis involves understanding their specific strengths and popularity in different contexts. Python is a versatile programming language, widely favored for its general-purpose capabilities and extensive use in data science and software development. In contrast, R has a strong foothold in the field of statistics, providing specialized tools and packages designed for statistical computing and graphics.
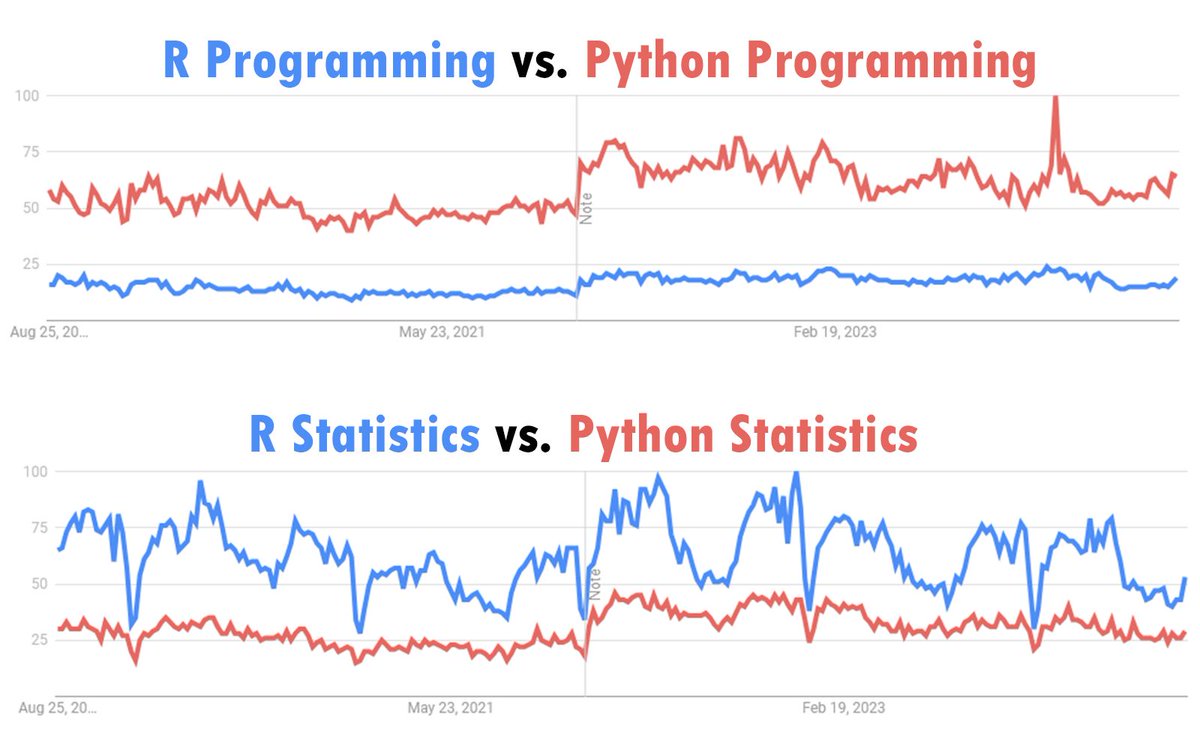
The visualization of this post illustrates Google search trends over the last five years, comparing interest in R and Python for programming and statistics. It shows that while Python generally maintains higher search interest overall, R leads when focusing on statistical topics.
Here’s a comparison of both languages for statistical tasks:
R:
🔹 Highly specialized in statistical analysis and data visualization.
🔹 Offers a wide range of packages specifically for statistical tests, modeling, and graphics (e.g., dplyr, ggplot2, stats).
🔹 Preferred for academic and research-focused projects in statistics.
Python:
🔹 Known for its versatility in data science and general-purpose programming.
🔹 Integrates well with other technologies and supports a broader range of applications, from machine learning to web development.
🔹 Utilizes powerful libraries for data manipulation and visualization (e.g., pandas, matplotlib, seaborn, scipy, statsmodels).
Generally speaking, the choice between R and Python often comes down to personal preference. Both languages have their unique strengths and can be effective for statistical tasks. However, it's also important to consider the ability to communicate and collaborate with peers. In the field of statistics, R is widely used and recognized, making it a valuable tool for ensuring clear communication and understanding within teams. For this reason, I would always choose R for statistical tasks.
If you want to dive deeper into statistical methods in R, check out my online course. More info: https://t.co/7YQCRDKSPO
#DataAnalytics #RStats #datasciencetraining #datascienceenthusiast #Rpackage
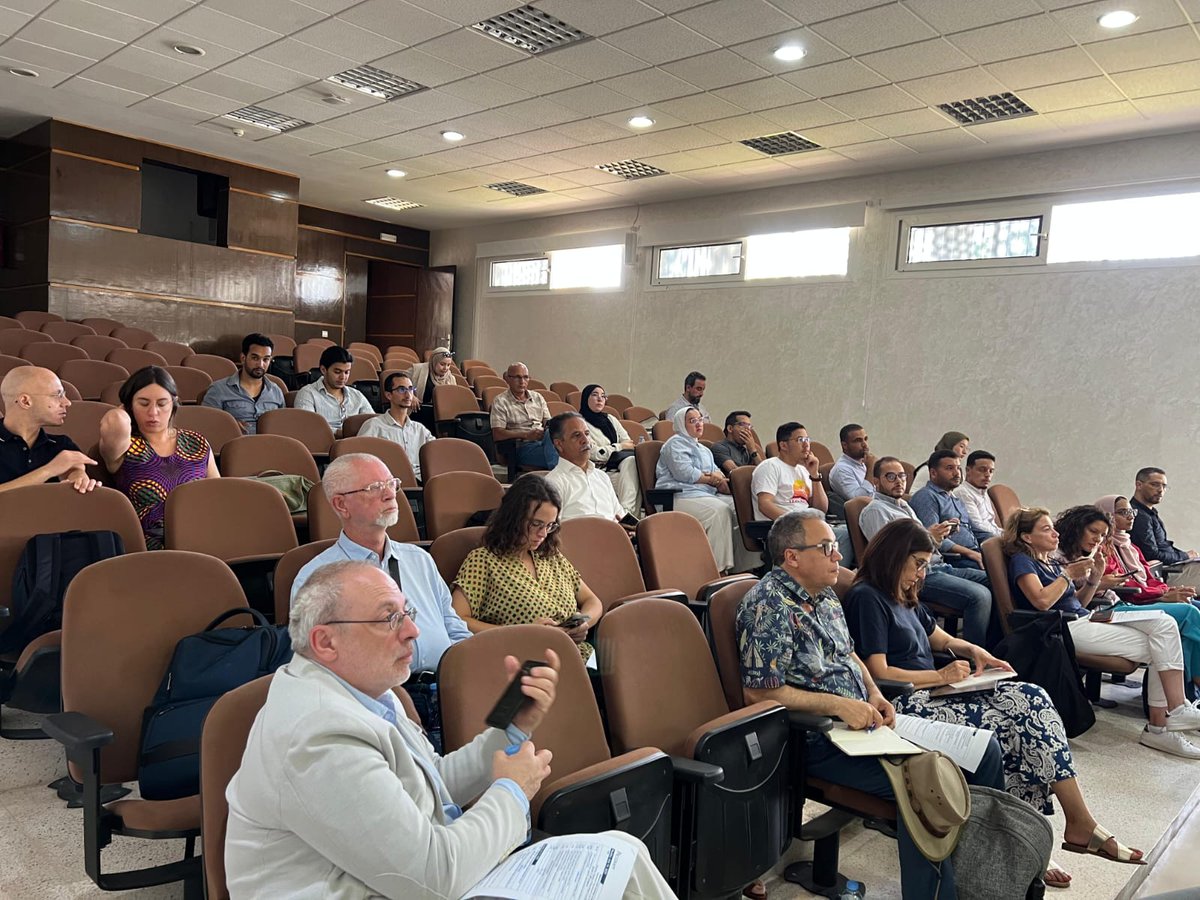
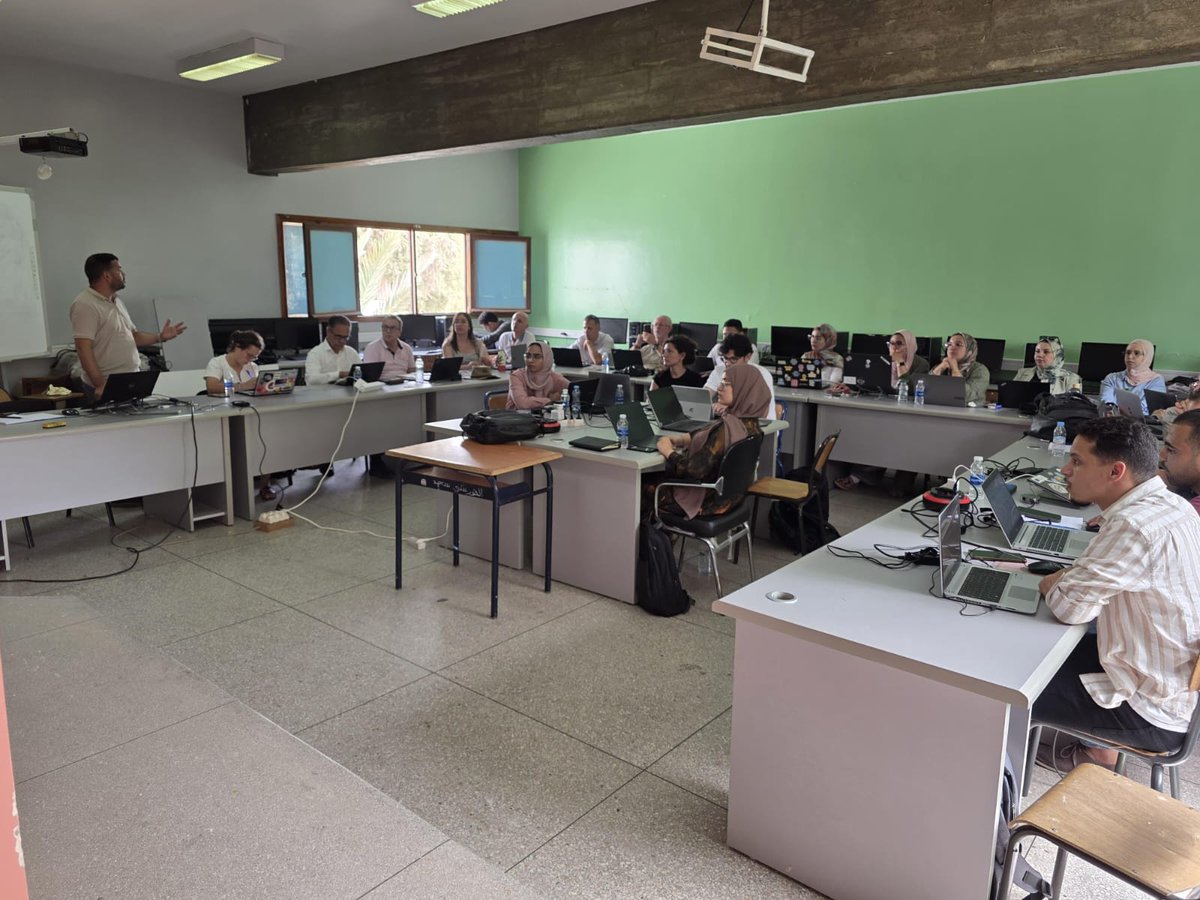
🌍 Participated in the Water4Med Annual Meeting & Remote Sensing Summer School (July 14–18, 2025) at the Faculty of Sciences, Agadir 🇲🇦.
A week of knowledge exchange on climate-driven water scarcity & hydrological extremes across the Mediterranean! 🌊💧
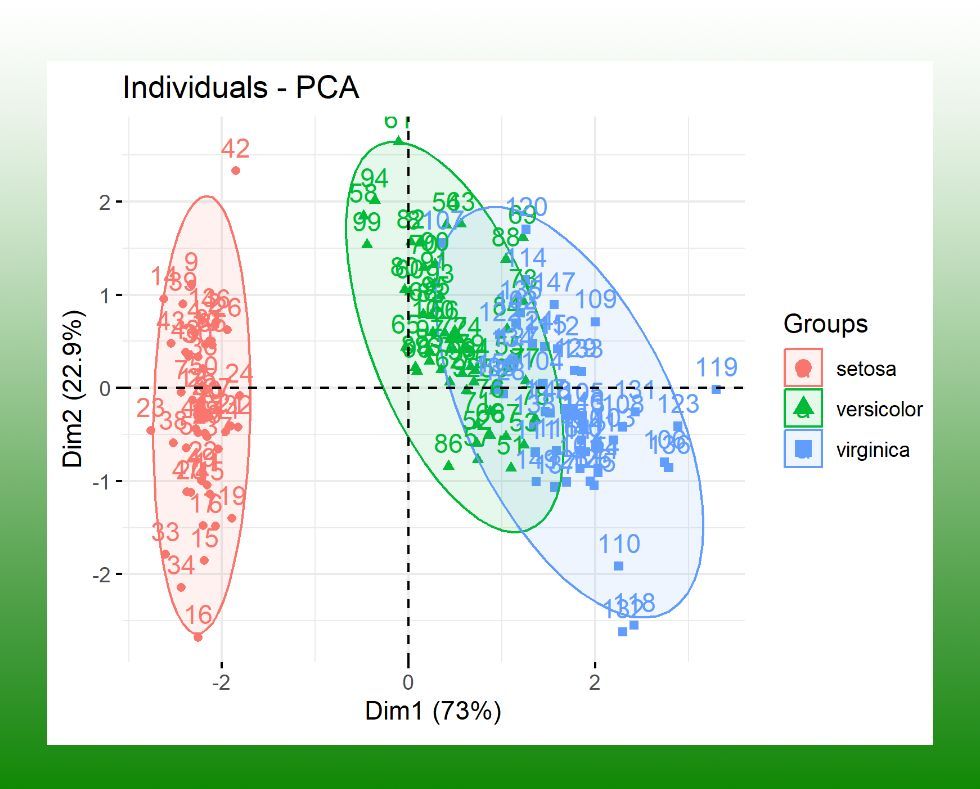
Learn how to use Principal Component Analysis (PCA) in R to simplify large data sets while retaining crucial information. PCA is a commonly used tool in statistics for making complex data more manageable. Here are some essential points to get started with PCA in R:
🔹 What is PCA? PCA transforms a large set of variables into a smaller one that still contains most of the information in the original set. This process is crucial for analyzing data more efficiently.
🔸 Why R? R is a statistical powerhouse, favored for its versatility in data analysis and visualization capabilities. Its comprehensive packages and functions make PCA straightforward and effective.
🔹 Getting Started: Utilize R's prcomp() function to perform PCA. This function is robust, offering a standardized method to carry out PCA with ease, providing you with principal components, variance captured, and more.
🔸 Visualizing PCA Results: With R, you can leverage powerful visualization libraries like ggplot2 and factoextra. Visualize your PCA results through scree plots to decide how many principal components to retain, or use biplots to understand the relationship between variables and components.
🔹 Interpreting Results: The output of PCA in R includes the variance explained by each principal component, helping you understand the significance of each component in your analysis. This is crucial for making informed decisions based on your data.
🔸 Applications: Whether it's in market research, genomics, or any field dealing with large data sets, PCA in R can help you identify patterns, reduce noise, and focus on the variables that truly matter.
🔹 Key Packages: Beyond base R, packages like factoextra offer additional functions for enhanced PCA analysis and visualization, making your data analysis journey smoother and more insightful.
Embark on your PCA journey in R and transform vast, complicated data sets into simplified, insightful information. Ready to go from data to insights? Our comprehensive course on PCA in R programming covers everything from the basics to advanced applications.
More info: https://t.co/DUfoAHuxxD
####################
Special Promotion - Get 33% Off All My Courses Through July 23: https://t.co/nfnsYuxayc
####################
#Python #DataViz #datavis #statisticians #datascienceeducation #RStats #ggplot2 #rstudioglobal
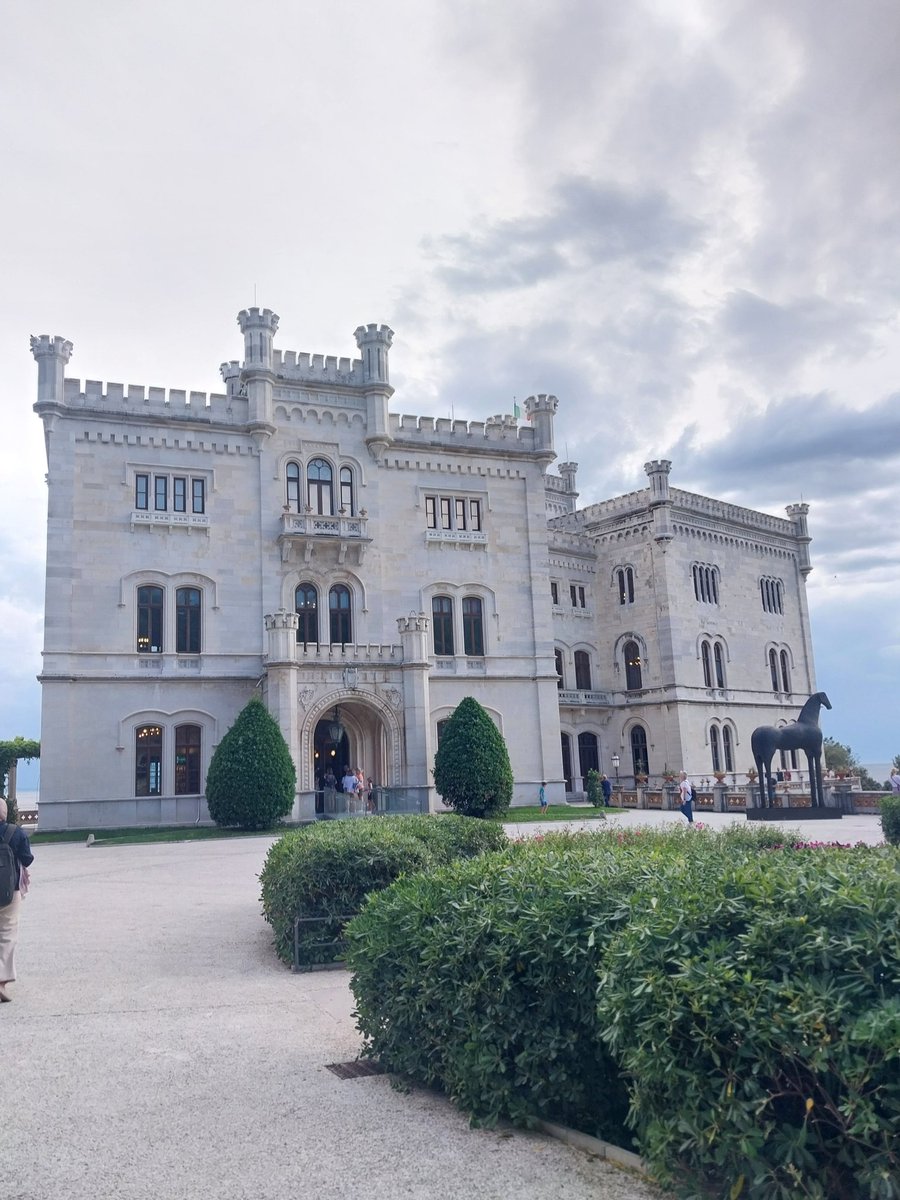
Just came back from the OGS Summer School 2025.
Held across Trieste, Italy and Piran, Slovenia, the summer school brought together early-career professionals from across the Mediterranean to explore ocean–climate systems, blue economy transitions, and the science-policy interface
New in The Innovation Geoscience! Global lake carbon burial from endorheic zones since the Last Glacial Maximum and the future projection.
In this study, Li et al. integrate lake sedimentary records, hydroclimatic models, and modern observational data to analyze changes in lake carbon burial and their driving mechanisms in global closed basins since the Last Glacial Maximum. Read more @Innov_Geosci
https://t.co/8rZ5MCxUvq
#geoscience #carbon #research
I am excited to participate in the 57th Annual Meeting of AASP–The Palynological Society, in Rabat, Morocco. It was an incredible opportunity to connect with so many Palynologists from across the world and make new connections.
It was also great to receive the award for my poster
A fantastic end to sessions yesterday which ended with a talk on next year’s annual meeting location, Trelew, Argentina by @PaulaNarvaez78 of @ianigla . The student talk and poster awards were also given out to deserving participants with some very strong competition #AASPTPS