#AirAsia#AirAsiaIndia#DGCA@AirAsiaIndia@DGCAIndia
4 yr old assigned default web check-in 5 rows away frm 4 adult seats, all booked together on single ticket. To web check-in we r forced to pay 300 to let my 4 yr son sit adjacent to us. Heights of abusing seat payment system!
JOIN OUR MENTORING EVENING: Tuesday 21 at The Clyde. https://t.co/134WT0bPak
MEET OUR MENTORS: @robjhyndman is Professor of Statistics at Monash. He's best known for his work in time series forecasting, for which he won the Moran Medal from Aust Academy of Sciences in 2007.
Making choropleth maps in R can be slow. Read @huizezhangsh's learning on the time to compute and recommendations for speeding up the computation at https://t.co/F4f4QdxZlD
I'm teaching my last Intro ML class today. There were some highs b/c the students were great, and lows because lows happen.
Highs were also due to four resources that were indispensable for me. Noted them elsewhere, but just want to share again in one spot for future me:
🎉 Congratulations 🥂 to @econopatric, winner of the inaugural Di Cook Award for open source statistical software, for his R package {spotoroo}.
Congratulations also to honourable mentions @SayaniGupta07 for the R package {gravitas} and @jeffreypullin for the R package {rater}.
Do you have a data analysis task and want some help with it? We have a lot of Masters students who might be able assist!
👩💻👨💻👨🏿💻👩🏿💻👨🏻💻👩🏻💻👩🏾💻👨🏾💻
https://t.co/qZgUtd4ogA
Our gghdr package for plotting highest density regions in ggplot2 is now on CRAN. https://t.co/rErTBJexSH. Find out more about the package at https://t.co/oyL9Gg0rdR. Thanks to @steffilazerte and @nj_tierney for helping me embark on my blogging journey👇
#rstats#gghdr#rOpenSci
[blog] A Journey to gghdr
@SayaniGupta07 shares a journey through the land of OzUnconf 2019 which ultimately led to gghdr, a package for highest density region plots in ggplot2!
Explore the journey and learn about HDR plots on the way!
https://t.co/rR3gOxyE7t
#RStats#gghdr
I'm very excited that we now have an **open-source statistical software award**, named after from the very progressive Prof Di Cook (@visnut), open for students (or recent graduates) of Victoria and Tasmanian institutes 🏅🎉
Submission closes 26th Nov, team application accepted!
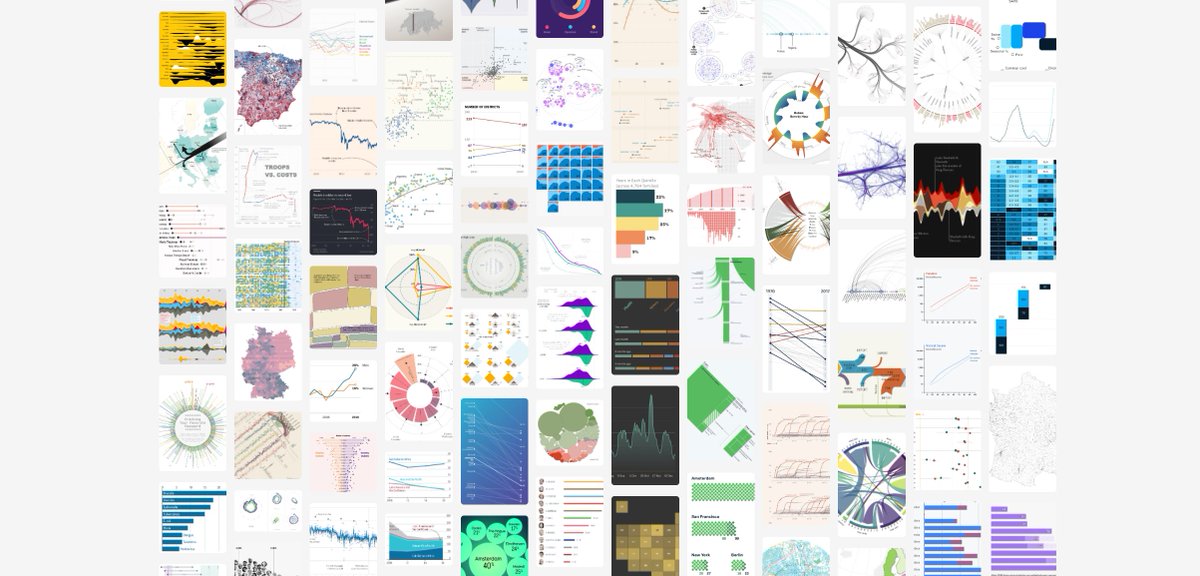
We love beautiful charts, don’t we?
Calling all those who need data visualisation for a better communication📈! We are hosting a one-day workshop on Data Visualisation with R with @visnut and @statsgen.
📆 Monday 6 Dec 2021
🔗https://t.co/UstqguO05k
Our next🆓virtual public lecture is tomorrow (Tuesday)! Catch @MonashEBS Prof @robjhyndman with his talk: "Uncertain futures: what can we forecast📈& when should we give up?"
📆Tues 24 August
🕛12pm AEST
https://t.co/riHQmIoSkv
@MonashBusiness@IIForecasters@Science_Academy
Our paper (with Mahsa Ashouri and @robjhyndman) "Fast Forecast Reconciliation Using Linear Models" is now published in JCGS. The paper highlights the power of ordinary regression models!
Sharing a link for 50 free online copies (first come first served): https://t.co/kvzxCzrq2Z
Harriet's back! Read about bad restaurants and Linear Discriminant Analysis, complete with animated gifs and colourful sketches at https://t.co/nmP59DSS9v @marriethason
Congratulations to two of our Masters of Business Analytics students (@dilinieeee and @uv_varsha) for winning this award! And to @Paula_Moraga_ for excellent mentoring.
What a great feat for the R Journal! A HTML publication that can include interactive graphics and animations! 🥳
Congratulations to Di and the editorial team for getting this done! And also congratulations to @earowang and @visnut for their publication! https://t.co/LMDIKjKX0h