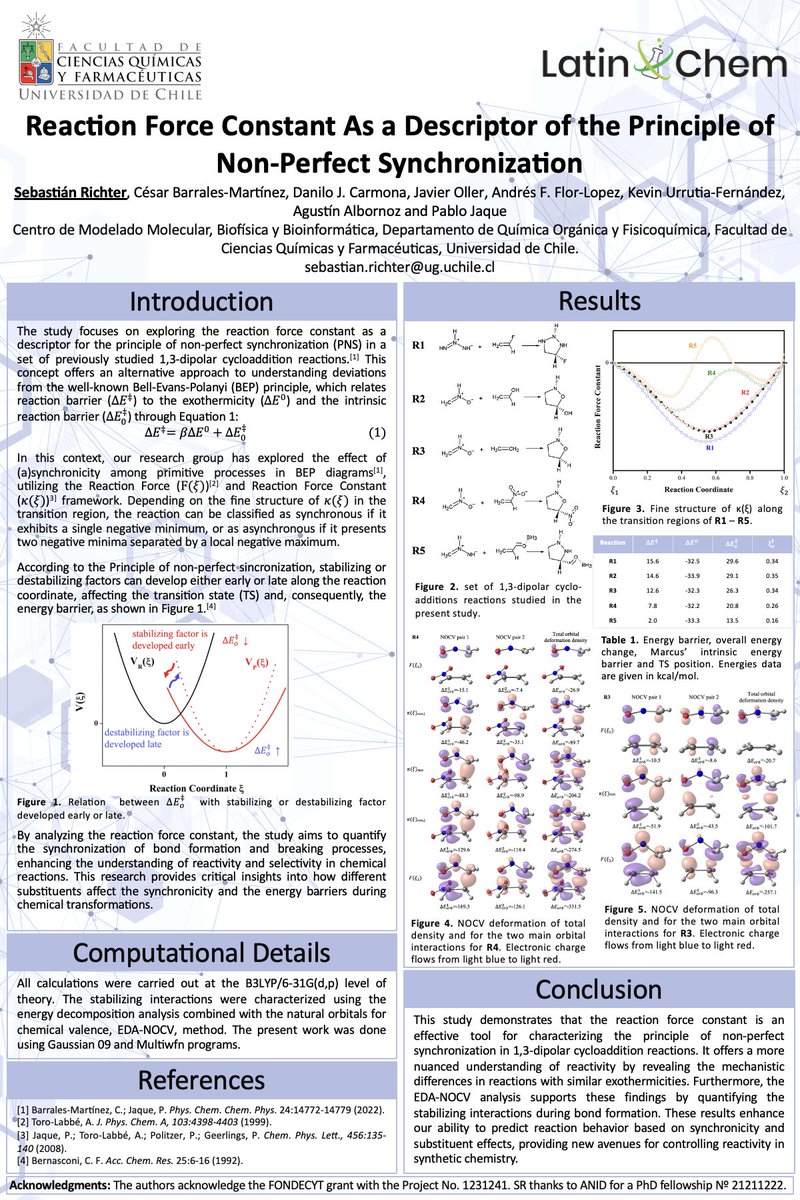
@icorraluam@LatinXChem (3) The use of κ(ξ) as a descriptor of asynchronicity is transferable to any reaction with a multibond transition state, regardless of whether the number of bonds is conserved.
Thank you!
Hi @LatinXChem, presenting my work "Reaction Force Constant As a Descriptor of the Principle of Non-Perfect Synchronization" at #LatinXChem24#LatinXChemComp#Comp183. Excited to discuss how this concept enhances our understanding of chemical reactivity! #DFT#Chemistry
@icorraluam@LatinXChem (2) In this context, for a set of reactions that proceed under the same thermodynamic driving force, the changes in energy barriers deviate from the expected BEP behavior, and these deviations arise from differences in the intrinsic reaction energy.
@icorraluam@LatinXChem (1) Hi Ines! Yes, there is a trend: more synchronous reactions tend to have higher energy barriers, while more asynchronous reactions show lower barriers. In fact, we demonstrated that the BEP relationships hold for sets of reactions with the same degree of (a)synchronicity.
@casaltmrn@LatinXChem (4) The sequential formation of new bonds reflects the decoupled nature of the bond-forming processes. Comparing the NOCV for R1/R2/R3 would likely show similar smooth electron density flows as seen in R3, given the synchronous nature of their reactions.
@casaltmrn@LatinXChem (3) In contrast, for R4 (Figure 4), the NOCV analysis shows a more complex picture, with more significant electron reorganization along the transition region. This is consistent with the asynchronous behavior seen in the κ(ξ) curves.
@casaltmrn@LatinXChem (2) The electron density flows in unison from light blue to light red, indicating that bond formation occurs smoothly throughout the transition.
@casaltmrn@LatinXChem (1) Actually, the NOCV pairs shown in my analysis are for R3 and R4. For R3, the NOCV analysis (Figure 5) shows that the orbital interactions increase along the transition region in a more synchronized way, consistent with the synchronous behavior observed in the κ(ξ) curves.
@casaltmrn@LatinXChem (4) As the reactions move from electron-donating to electron-withdrawing groups, they become more asynchronous due to electronic effects.
@casaltmrn@LatinXChem (3) R1, R2, and R3 exhibit a synchronous, one-step mechanism with a single minimum in κ(ξ). R4 displays an asynchronous, one-step mechanism with two minima and a negative maximum. R5 shows a transition between one-step and multistep mechanisms.
@casaltmrn@LatinXChem (2) Figure 3 reflects how synchronous or asynchronous the bond-forming processes are during the reaction. A single negative minimum indicates synchronicity, while two negative minima separated by a local maximum show a more decoupled, asynchronous process.
@casaltmrn@LatinXChem (1) Hi Mariana, The Reaction Force (F(ξ)) and Reaction Force Constant (κ(ξ)) models help divide the potential energy profile into three regions based on critical points. The κ(ξ) model describes the degree of synchronicity in multibond transition states.