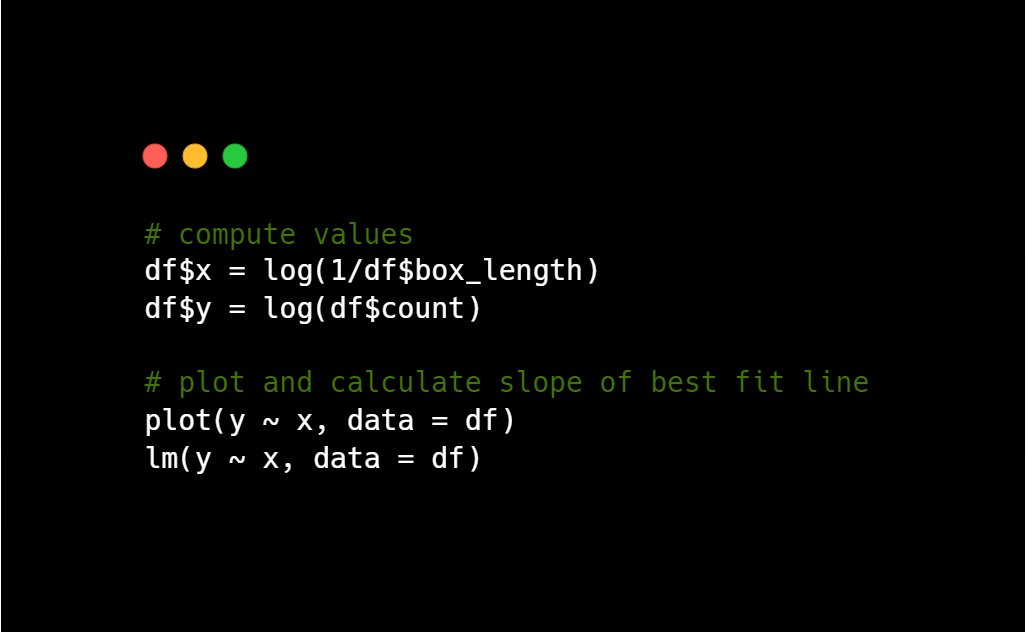
Final steps are to compute the values:
- log(count)
- log(1/box length)
Then we can plot these values and find the best fit line with a linear regression.
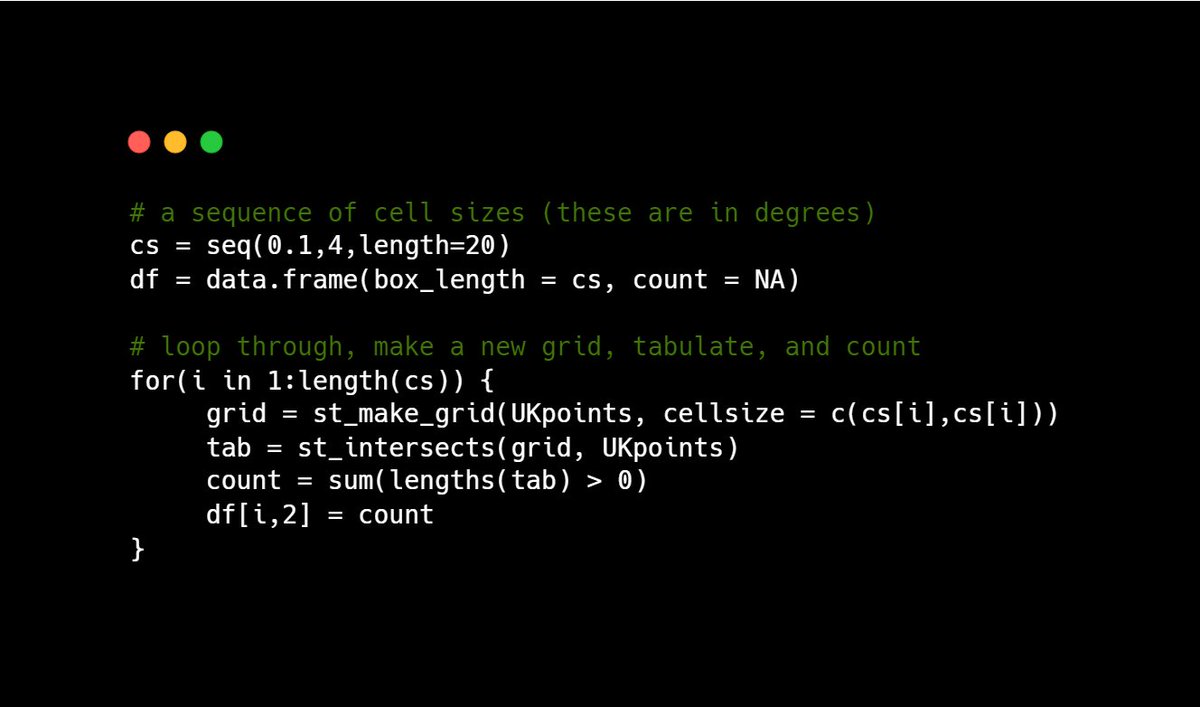
Next, define a vector of cell sizes and the loop through each of them, create a grid, and tabulate the results. I store all of these in a data frame.
This vector sweeps from 0.1 degrees to 4 degrees.
🌷New preprint🌷
Using gps and food returns data from 359 foraging trips of 23 BaYaka mothers, we examined how infant presence during foraging trips affects the mothers’ mobility and work, and how group foraging helps mothers.
https://t.co/Cyx40UZsMI
@dr_OmerHan@TrevorABranch Love illustrator and had a collaborator who liked to use it to customize plots. But when that collaborator quit and we had to revise his figures for a publication, it was a nightmare since none of it was reproducible.
The slash-and-burn agriculture practiced by many Indigenous societies across the world can actually have a positive impact on forests, according to a new @OhioState study done in Belize. @OSUanthro https://t.co/jyzZoCdp1Z
Congratulations to Shane Scaggs, who has received the Presidential Fellowship, the most prestigious award given by the OSU Graduate School to recognize the outstanding scholarly accomplishments and potential of graduate students entering the final phase of their dissertation work