🚨 MUST WATCH 🚨
CNBC's Rick Santelli GOES OFF on ABC's debate moderators over their failure to press Kamala on any of her economic "promises" — or how her policies drove prices sky-high in the first place.
"The ABC people were like a turkey shoot!"
"They were highly motivated. They played like it. And I'm here to say that I'm excited for it." Is Nebraska back?!
@joelklatt talks about @HuskerFootball's win over Colorado and Dylan Raiola's performance 🙌
Americans Should Be Furious After Hearing This
Senator Marco Rubio says Americans “They've worked here their entire lives. They retire. They get $800, $900, a $1,000 a month from Social Security. — Somebody who just got here from Cuba 3 months ago — is given $1,500 a month”
“So imagine if you've been working here for 40 years and your Social Security check is smaller than the benefits going to a 28 year old, Able body person who just got here.
That's real. That happens. That's happening every day. That makes no sense.”
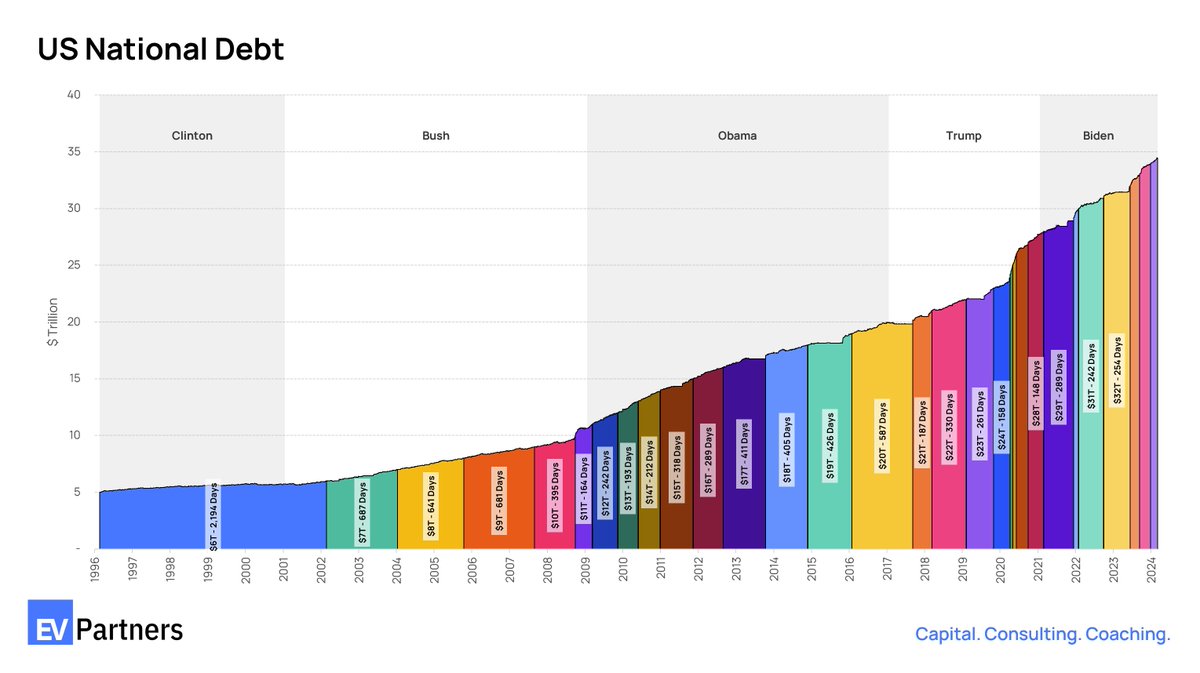
This is the scariest chart I’ve ever made. This is what it looks like when a country is heading toward a financial precipice.
Each color shows $1T getting added to the national debt.
Not that long ago, it took six years to add a bar.
We’re now adding one every 90-120 days.
The explosion of debt has been the only bipartisan phenomenon of my lifetime. For us conservatives, we can’t blame it on just Biden and Obama. For you Democrats, you can’t put this on just Trump. It’s both parties, all presidents, and every Congress.
The acceleration started under George W. Bush. Bush went into 2002 with less than $6T of debt. Thanks to GWOT military spending and tax cuts we probably couldn’t afford, $6T grew to $7T in 23 months, $8T in another 21 months, and $9T in 23 months.
Then the Great Recession hit. We added the next trillion in 13 months, crossing $10T for the first time in American history. And we haven’t looked back since.
During the second Obama term, with spending reined in by the Tea Party movement, annual deficits reduced to less than $1T, and growth in the debt slowed down. At the end of Obama’s tenure, it took nearly 20 months to go from $19T to $20T.
That would be the last time it took a full year to add a trillion dollars to the debt.
In 2017, a real-estate developer got inaugurated as president. And, if there’s one thing we all know—and love!—about real-estate investors, it’s that they understand the value of leverage.
Under Trump, even as the economy surged, deficits grew, and national debt once again spiraled. We ended 2019 with a little over $24T in debt.
Then Covid hit, along with consumer stimulus, PPP loans, massive government spending, and reduced tax receipts. Over just two months in 2020—April and May—we added $2T to the national debt. Ever since, we’ve been adding $1T every 160 or so days.
With Biden in the White House and a narrowly divided Congress, we’re now adding $1T to the debt every three to four months. It took just 91 days to go from $32T to $33T. 104 days to get to $34T.
And it’s not slowing down. Biden has another 300+ days in office this term. When he or Trump enters their second respective term in office in 2025, the debt will likely be above $37T.
Where does it end? As deficits continue to pile up and borrowing costs remain relatively high compared to where they were over the previous 20 years, how is any of this sustainable?
@michaelsantoli Read it this morning. So well done!!
I really appreciate your perspective not only in this article, but always! @cnbc is lucky to have you on the team.
The crowd goes from “fight and deny” to “embrace and chase.” Stellar tape action, a no-quit expansion, innovation infatuation. Strategists upping targets, blessing high P/Es, gamy spec stuff flying. An overshoot? Just the usual bull?
New @CNBCPro column.
https://t.co/XPLEseWAz1
Thrilled to be featured in Omaha's B2B Magazine! 🎉 Check out the latest issue to see how our company is making waves in the business community: https://t.co/sNPjs22cLb #OmahaB2B
Clear, nonpartisan long term data from @StatistaCharts on the magnitude of the #bordercrisis last few years.
This shows only ~2.2 million at end FY2022.
With over 300,000 encounters last month we are on pace for over 3 million this fiscal year (which is how @CBP defines it).
650% increase from low during Obama presidency.
Real risk of NYC, Chicago, et al financial & budget crisis on horizon.