I always loved this chart from @NDR_Research, which shows that owning the largest stock in the S&P 500 has historically been a terrible strategy, relative to just owning the index.
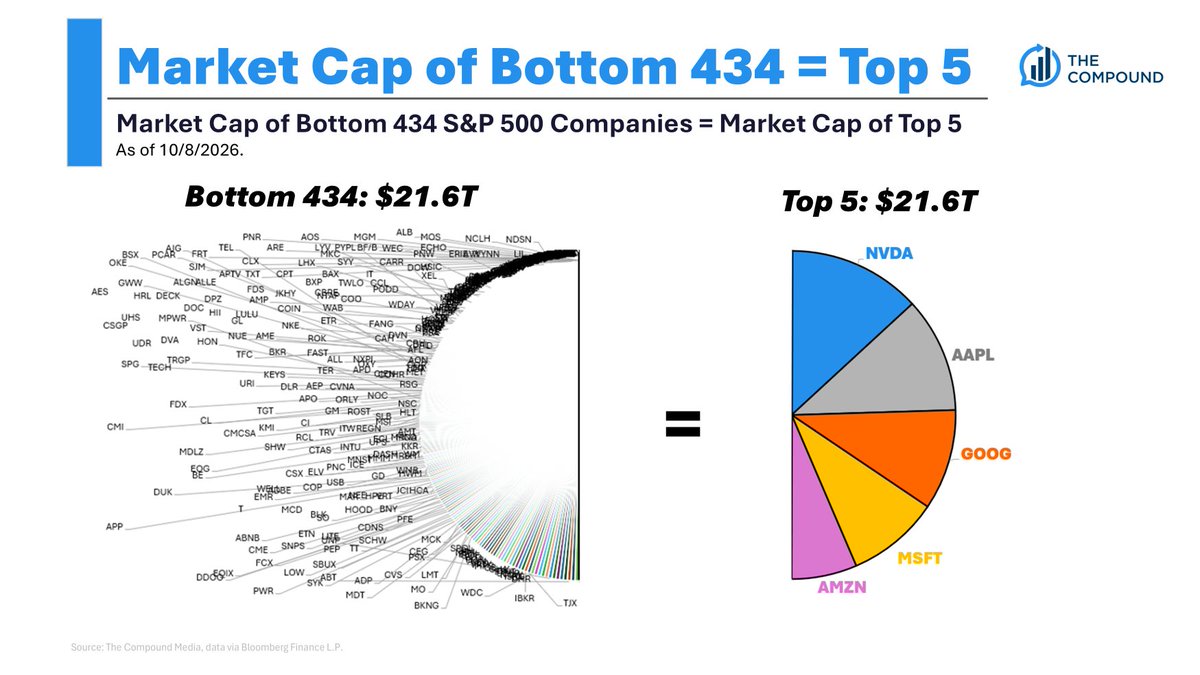
In July 2018 when I first shared this, the top 5 stocks were equal to the bottom 282.
Interestingly, the TTM net income of the top 5 stocks is also equal to the bottom 436 companies. So based on that metric, it's a little less insane. Maybe.
One of the main reasons so many breadth indicators are off the charts is because the concentration in the index is like nothing we've ever experienced.
The top 5 stocks in the S&P 500 are equal to the bottom 434. (67-500)
We spoke about Buffett's epic run as he steps down from his chairman role, and much more, and tonight's What Are Your Thoughts?
https://t.co/SdJ2X5hEa3