Just a heads up the US stock exchange is closed for the night and opens back up at at 4 am EST that is why there are not transaction go through on live stream.
Someone made suggestion to post on WSB to try and get some momentum there as well so I'm going to work on getting an account to post on the forum.
SHORT SQUEEZE CAPITAL RESEARCH: FGI Industries ($FGI)
Full quantitative report on the #1 ranked micro-float on Nasdaq.
• 71% short interest (377,797 sh / 534,387 float)
• 15.2 days to cover at current volume
• 0.85x book value, +$1.8M FCF
• +0.4% shares y/y: no dilution valve
All 4 pages attached. $SQUEEZE. Not financial advice.
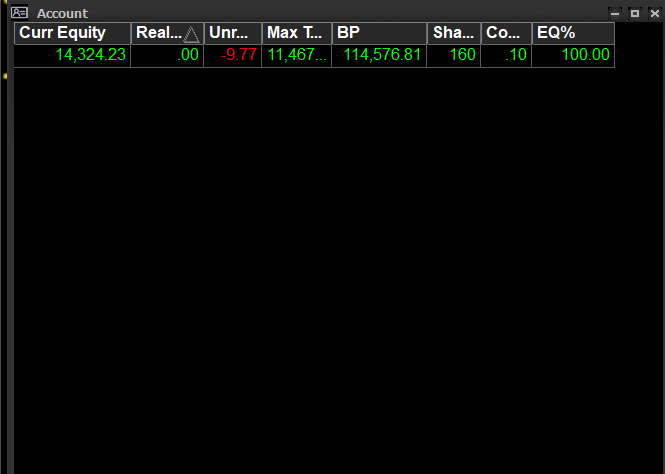
We will start a small position in $FGI 500 shares at an average price of $7.35 to start out the model that was created gave this the highest rating for a squeeze.
$GIPR test position is currently up.
Report is still scheduled for today.
Think of this as an on-chain hedge fund.
A lot of the squeeze play in crypto right now is aiming at 100 million dollar companies or multibillion dollar companies. A token with a few million in fees is not going to make a meaningful impacy. You're not moving GameStop or something like LLY.
So I wanted to do something different so I came up wiht this idea. These nasdaq companies you can buy most of the float wiht a few hundred K up to a few mil.
That's is the missing opportunity. we are not trying to squeese established companies we are trying to buy entire companies, or finding the ones where the share structure and the short sellers' position tell you something the price doesn't yet. You have to think of it like How many shares actually exist. Who holds them. Who's short and how many days of volume they'd need to get out. Whether the biggest holder is even allowed to sell yet. It's all in the filings and that is where we get the edge.
Roaring Kitty showed showed us how to do this. Read the filings when nobody else will then put your own money in. Show the account every week, up or down, and never tell anyone what to do. When they hauled him in front of Congress, he said "I like the stock" and walked out, because showing your work isn't an issue the is reason to the madness. He proved one person with conviction and a webcam could make Wall Street answer questions.
We're trying to become the Roaring Kitty of crypto, and every holder is part of it. $SQUEEZE earns fees, the fees buy stock, I show the buy live. Fills, slippage, halts, all of it on screen. When positions return money, it flows back to the holders who funded it.
In simple terms: We're going ot be become the WallStreetBets for crypto, except the account is real, and everybody owns a piece of it.
I won't tell you what a stock will do. I'll tell you what the company is, what the shares look like, and what the shorts have to do to get out. Then I'll show you what I did with that.
In short, Roaring Kitty showed the playbook. We're building the vehicle to exicute that vision again.
$SQUEEZE. Not financial advice. Do your own research.
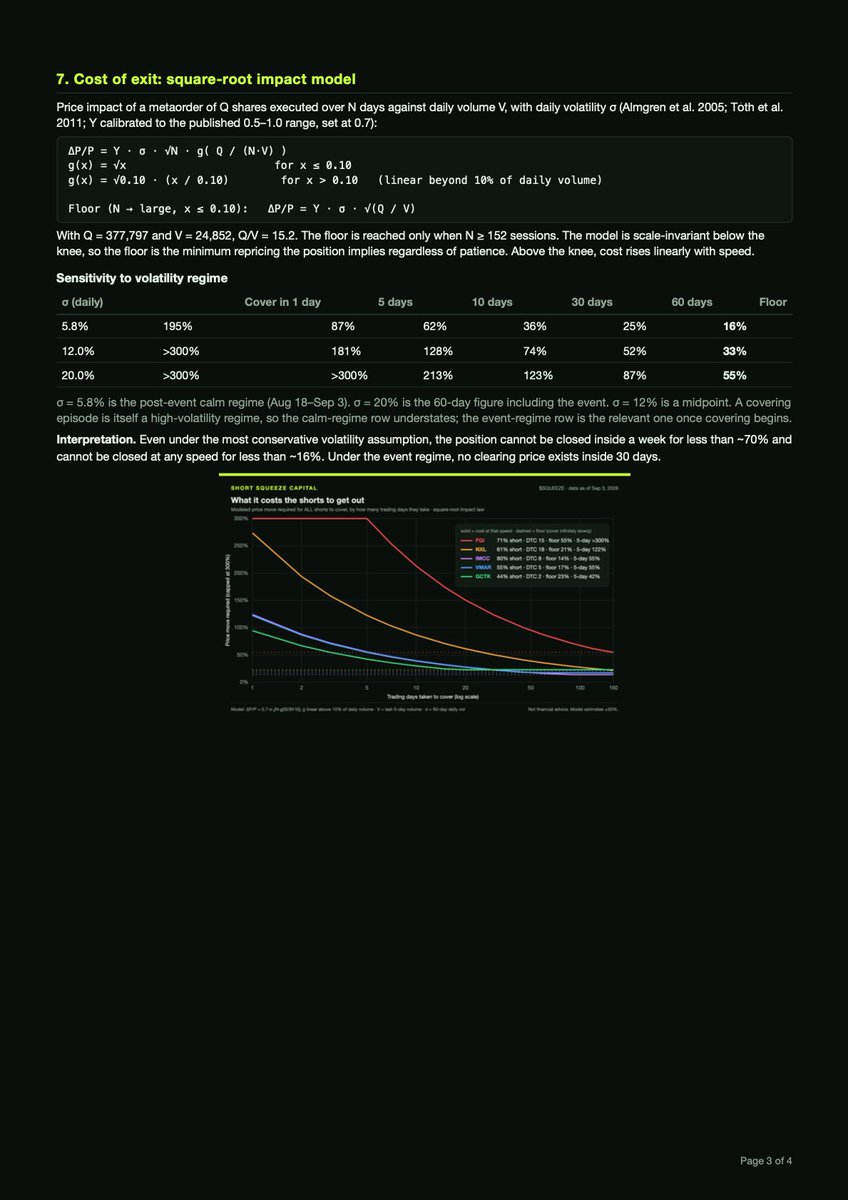
Next I want to go over the the math behind the cost it takes shorts to get out of the stock - this important because we can use their buying back the stock (covering their short position)to help move the stock in higher thus creating a of flywheel of buying.
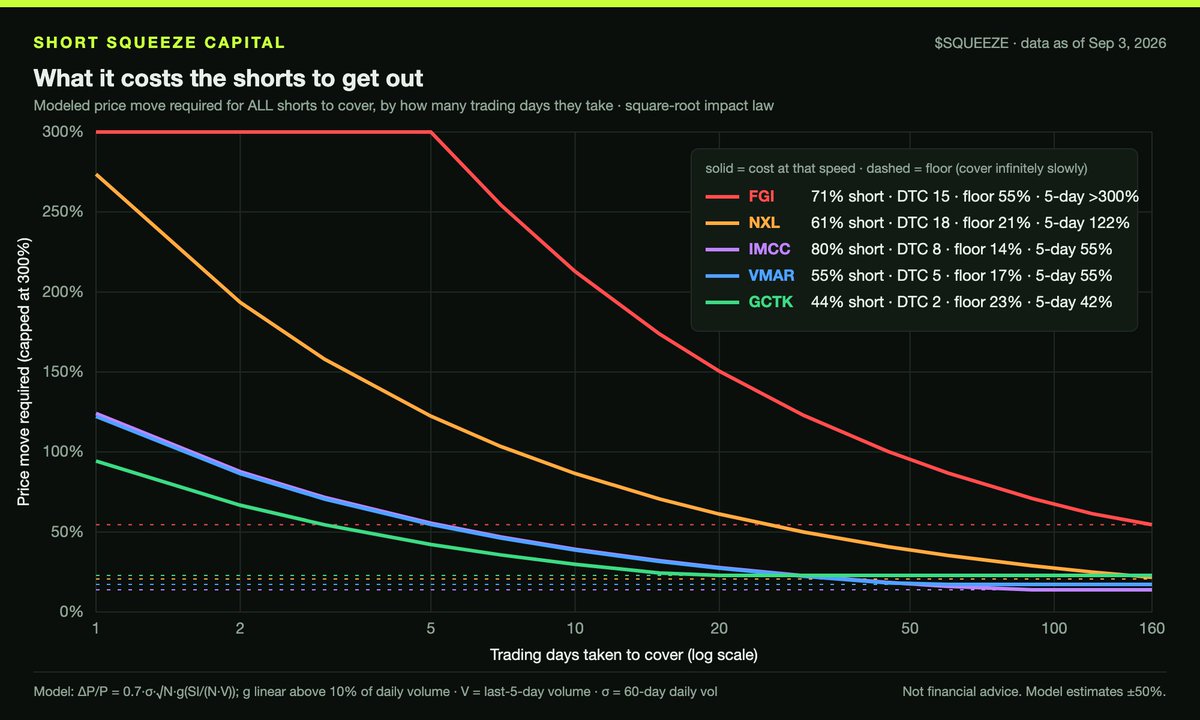
What's plotted: for each of the five most-trapped Nasdaq micro-floats, the price move required for ALL short sellers to buy back their shares, depending on how many trading days they spread the buying over. X axis = days taken to cover (log scale). Y axis = required price move, capped at 300%. Solid line = cost at that speed. Dashed line = the floor, the cost even if they cover infinitely slowly.
The model is the square-root impact law, the standard result from market-microstructure research on how large orders move prices: price impact ≈ Y × σ × √(order size ÷ volume). Y is the impact coefficient (0.7, from the published range of 0.5 to 1.0). σ is the stock's daily volatility over the last 60 sessions. Volume is the last 5 sessions' average.
Applied to covering: if shorts buy back SI shares over N days, each day they buy SI ÷ N shares against volume V. Total impact = 0.7 × σ × √N × g(SI ÷ (N × V)), where g is the square-root function up to 10% of daily volume and linear above it. Past 10%, the order is no longer absorbed by normal flow and impact stops flattening.
Two things fall out. First, a floor: when spread out far enough that each day's buying is under 10% of volume, the cost stops falling and settles at 0.7 × σ × √(SI ÷ V). That's the dashed line, the price move that has to happen regardless of patience. Second, a speed penalty: cover faster than that and the daily buying overwhelms the book, so cost rises steeply.
The five lines:
FGI: 71% short, 15 days to cover, σ 20%. Floor 55%. Covering in 5 days: model saturates above 300%, meaning no clearing price. Even spread over 30 days: 123%. Reaching the floor takes 152 trading days.
NXL: 61% short, 18 days to cover, σ 7%. Floor 21%. 5 days: 122%. 30 days: 50%. Floor reached after 177 days.
IMCC: 80% short, 8 days to cover, σ 7%. Floor 14%. 5 days: 55%. 30 days: 23%. Floor after 80 days.
VMAR: 55% short, 5 days to cover, σ 11%. Floor 17%. 5 days: 55%. 30 days: 22%. Floor after 50 days.
GCTK: 44% short, 2 days to cover, σ 25%. Floor 23%. 5 days: 42%. 30 days: 23%. Floor after 17 days.
Why FGI's line is so much higher: it combines the biggest position relative to volume (15 days) with the highest volatility (20% a day). Both terms in the formula are large, and they multiply. NXL has more days to cover but a third of the volatility, so its curve sits lower. GCTK has the highest volatility but the smallest position relative to volume, so it's the flattest.
Why the curves fall as you move right: slower covering means each day's buying is a smaller share of volume, so less price impact per day. The trade-off for the short is time. 152 sessions for FGI is seven months of carrying the position and paying borrow fees while any buyer who arrives first pushes the price up.
What this does not say: that any of these will happen. Shorts don't have to cover; companies can issue new shares and hand them a cheap exit. FGI is the only one of the five whose share count was flat over the last year. The model is calibrated to published research, not fitted to these stocks, so treat levels as ±50%. The ranking is robust; the exact percentages are not.
Sources: FINRA short interest (mid-Aug), SEC 10-Q/20-F share counts, https://t.co/3yFRxtUSj4 volume and prices. Not financial advice.
TLDR: Every short seller eventually has to buy their shares back, and buying pushes the price up. This chart shows how much the price would have to move for all of them to get out, depending on how fast they try. Rush it and the cost explodes; go slow and there's still a floor you can't get under. FGI's floor is 55% and it would take seven months of patient buying just to get down to that. The other four can exit for 14 to 23% if they take their time. Faster exits are cheaper for shorts only when the stock trades a lot, and FGI doesn't.
@Tony0123779009 We can't do any buying over the weekends but we can still use that time to research different companies and continue to refine the models for finding the stocks gather more fees from trading and keep growing the equity. The more money that we have, the the more we're able to do.
Here is the first model visual that I want to share. It's important to understand the different moving pieces of a stock. Also, it is not as simple as just buying and the number goes up there needs to be a deep dive into how stocks move and how the different rules we can use to our advantage thus create the edge that we need.
Skip to the very end for TLDR lol
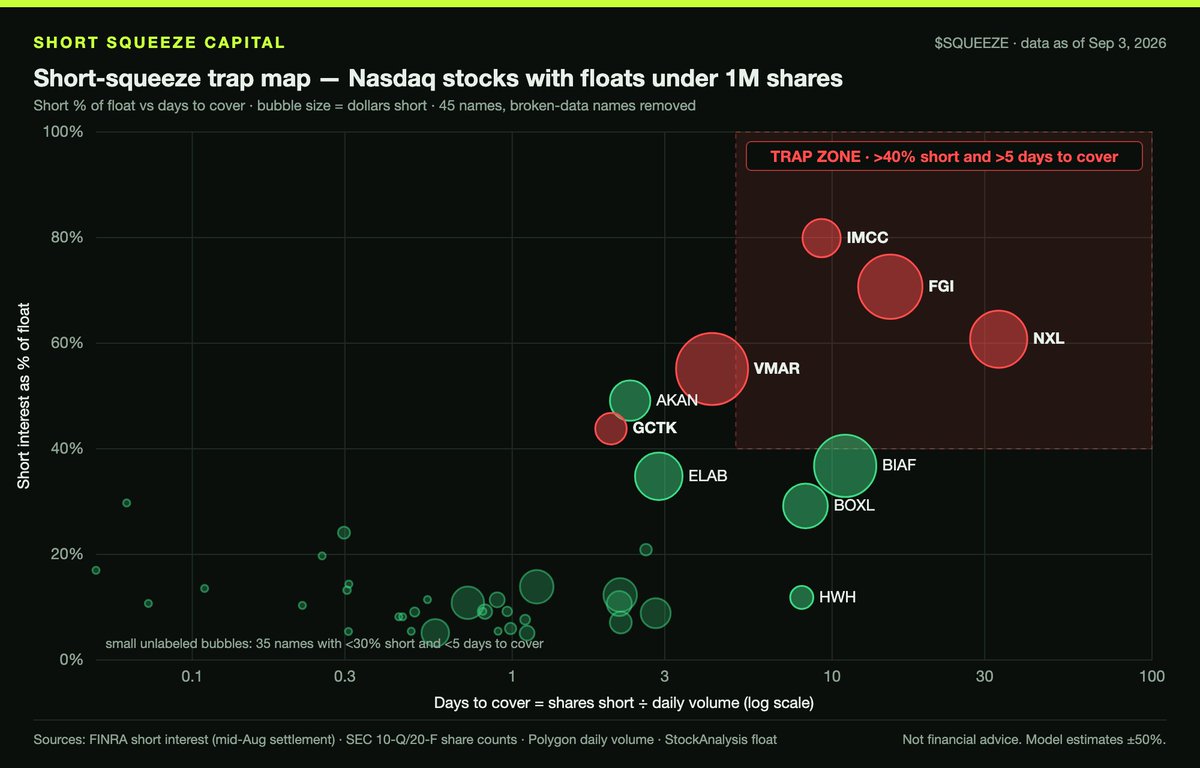
Short-squeeze trap map — Nasdaq stocks with floats under 1M shares. Here's the math behind the chart.
What's plotted: 45 Nasdaq stocks with a float under 1M shares and at least 5% of it sold short. X axis = days to cover (shares short ÷ daily volume, log scale). Y axis = short % of float. Bubble size =
dollars short. Shaded box = trap zone: more than 40% short AND more than 5 days to cover.
Data: short interest from FINRA's mid-August report (next release ~Sep 10). Share counts from SEC 10-Q/20-F cover pages, adjusted for reverse splits filed since. Float = shares minus insider and affiliate
holdings. Volume from https://t.co/3yFRxtUSj4, last 5 sessions. Prices are Sep 3 close.
Three formulas. Short % of float = shares short ÷ float (how much of the tradeable supply must be re-bought). Days to cover = shares short ÷ daily volume (how many full sessions shorts need if they're the
only buyers). Trap score = short% × ln(1 + days to cover), which combines the two.
The five red bubbles:
FGI — 377,797 short ÷ 534,387 float = 71%. ÷ 24,852 shares/day = 15.2 days to cover. Trap score 1.97. $2.5M short.
NXL — 342,000 ÷ 563,000 = 61%. ÷ 19,362/day = 17.7 days. Trap 1.78. $2.0M short.
IMCC — 377,000 ÷ 471,000 = 80%. ÷ 47,083/day = 8.0 days. Trap 1.76. $0.9M short.
VMAR — 360,000 ÷ 653,000 = 55%. ÷ 71,689/day = 5.0 days. Trap 0.99. $3.2M short.
GCTK — 166,000 ÷ 379,000 = 44%. ÷ 97,330/day = 1.7 days. Trap 0.44. $0.6M short.
Why the box sits at 40% and 5 days: under 5 days to cover, shorts can exit within a week without being most of the volume; over it, their covering is the market. Under 40% of float, other holders can
supply the shares; over it, most of the float has to change hands. Both at once means no clean exit. Four names qualify: FGI, NXL, IMCC, VMAR.
VMAR is the biggest bubble ($3.2M at risk) but the least trapped of the four — 72K shares a day gives shorts a 5-day exit. FGI trades 25K a day, so 15 days. Most money at risk is not the same as most trapped. GCTK is red because 44% short is high, but 97K shares/day covers the whole position in under two sessions, so it sits outside the box.
TLDR: A short seller has to buy back every share they borrowed. This chart shows, for each stock, how many of those borrowed shares exist compared to the shares available to trade, and how many days it would take to buy them all back at today's volume. The further up and to the right a bubble sits, the harder it is for shorts to get out. FGI, NXL and IMCC are the hardest exits on Nasdaq right now. Bubble size is how much money is on the line, not how stuck it is which is why VMAR is big but sits near the edge.
I'll be posting some visuals of models that I created using data that will help us figure out which stocks to buy and the math behind it.
We need to be very calculated here. There is chance to create roaring kitty type of movement here and we need to be smart about the moves we make.
@xelasfi@ha_li60704@mrdefilarian Okay went to grab a quick bit to eat I'll post the ticker and start buying with the current funds in the account and then when backend is fixed I keep moving funds to brokerage.
@mrdefilarian I bought stock to test and show you guys it works. I haven't released the official stock yet I need to send creator rewards to brokerage when pons fix the backend.