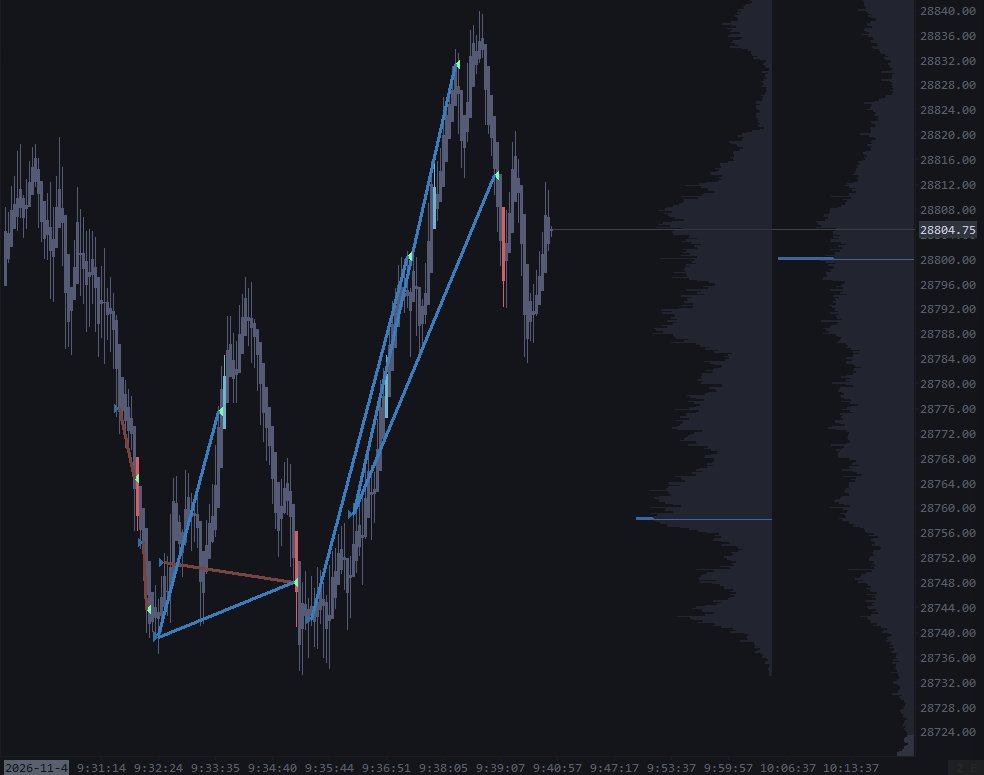
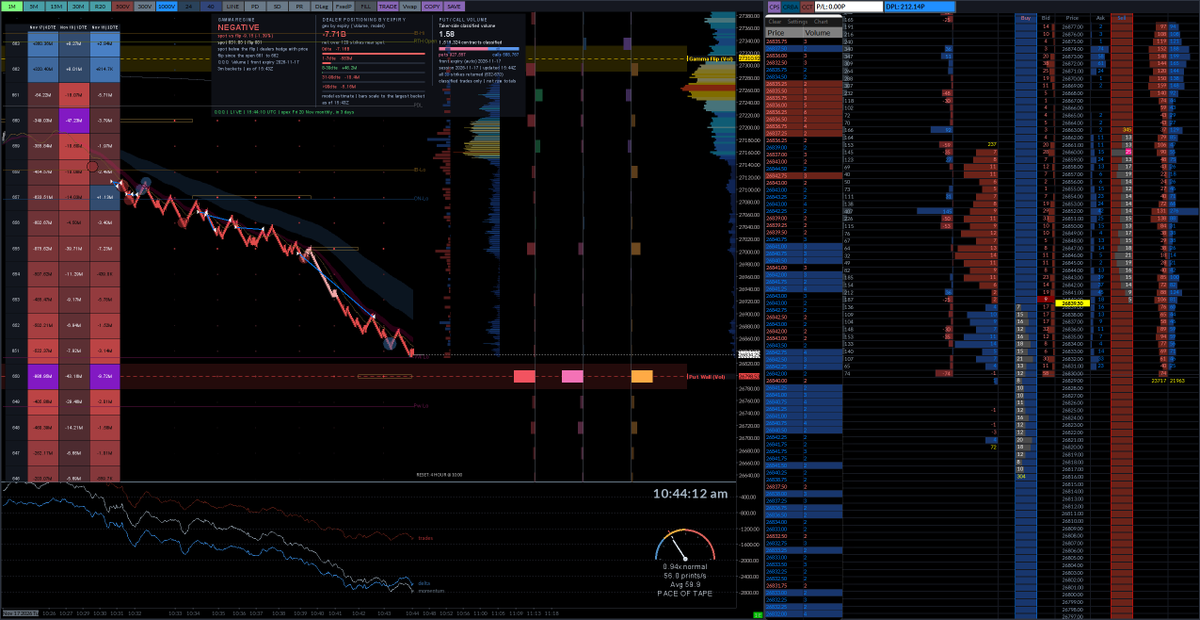
Made a simple background color changer live. Hate the way you have to select color > ok > apply > reopen the color dialog repeat.. Wanted something quick to see the changes live.
Link Below:
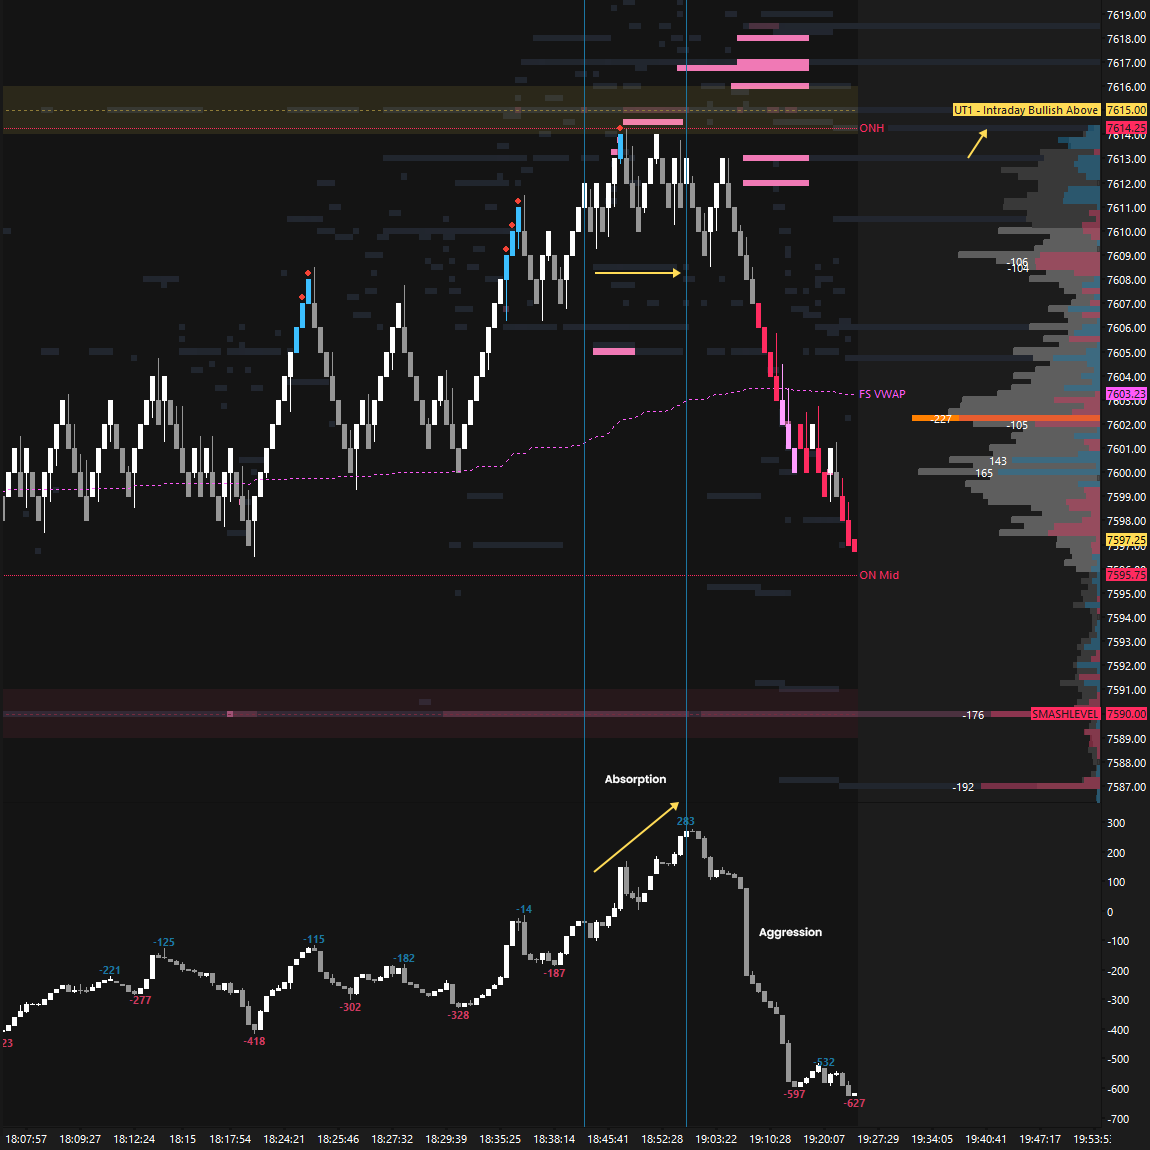
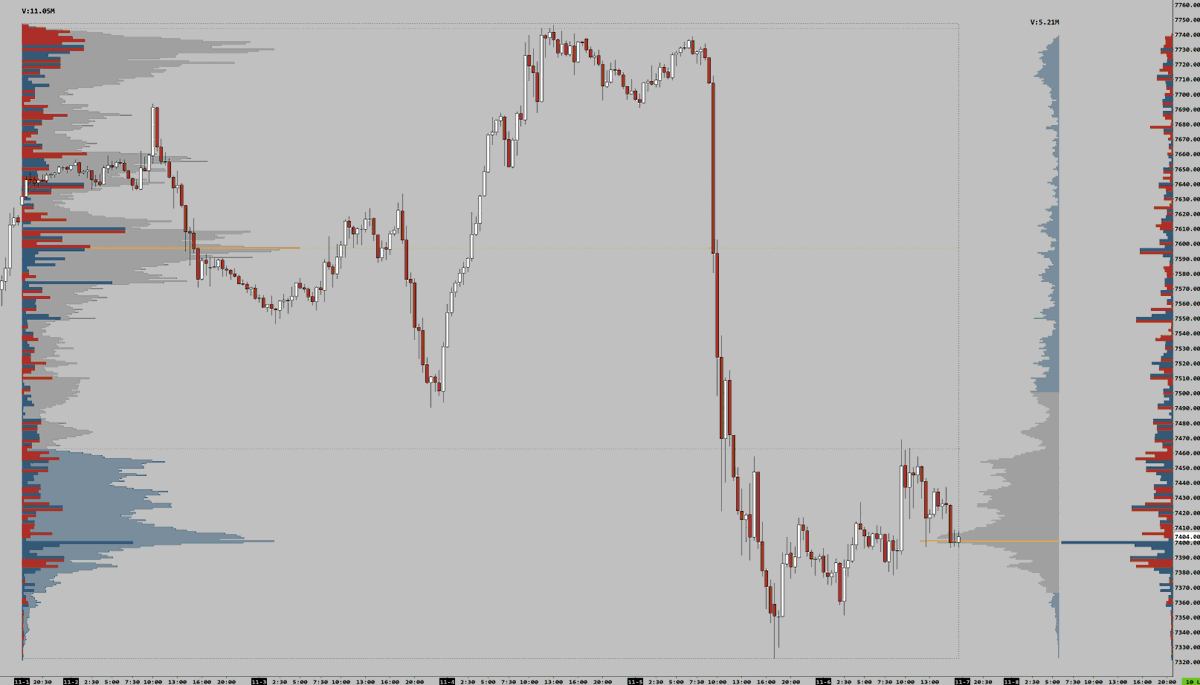
#ES_F@TradingSynHQ No joy in Mudville for the longs. Inventory is 100% short yet we are struggling to find the bid. Gap fill at 7566. Everyone who is long from 7600-7616 is not a happy camper right now. They will puke it out let the price stabilize then make a smart decision.
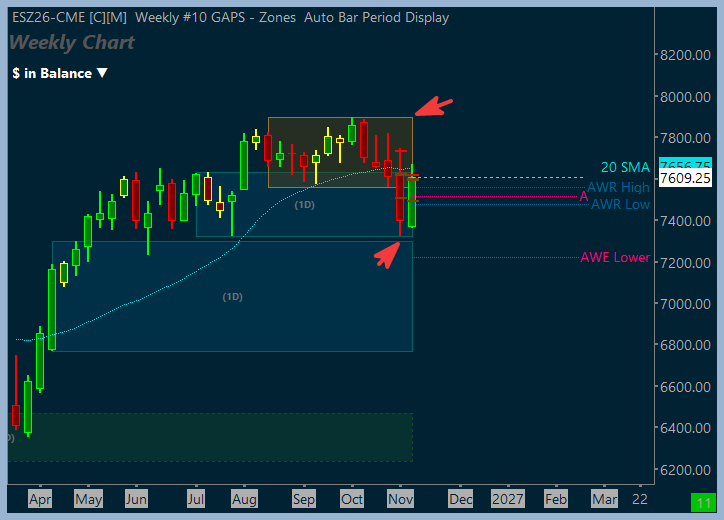
@PirateTraders@cutlassedgeapp The weekly has been in balance since mid-August, ~ 13 weeks. Last week’s liquidation was an excursion below that balance. This week is so far a look below and fail: - It’s only Wednesday 😉, weekly close is the vote
What Does Volume Tell Us?
To get straight to the point, in one word: participation. That's it. Nothing more, nothing less.
Heavy volume does not "confirm" anything, neither does low volume indicate "weakness." Trying to characterize it generally, without context, is a dangerous path.
A transaction is the meeting of a passive participant on one side of the spread with an active participant who pays a premium to cross the spread to do business with that passive participant. Volume bought equals volume sold, always. Said another way, there are just as many shares/contracts bought as there are sold (obviously).
I don't have it in me right now to go in depth with scenarios and examples. All I can say is, context matters. Look at today, for example. Why was volume (participation) so low?
(1) It's Easter Monday. Many European markets were closed (you didn't forget that did you?).
(2) Tomorrow is Trump's 8pm EDT Iran deadline, supposedly the be all, end all, not-to-be-moved, final, deadline. After a 4-5% rally off lows and 4th consecutive green close, it makes perfect sense to basically do nothing the day before such an important deadline.
So, with that backdrop, does it make sense to characterize today's historically low volume as "bearish" despite trading in the upper quintile of Thursday's range, and only briefly ticking red a couple of times?
Framing it that way, I'm not seeing it as inherently bearish, at all. Remember, volume is one thing: participation. So, very few humans/machines participated. Does that imply anything about where we go over the next day or two, given a looming catalyst? I don't think so.
As I said below earlier today, the market has a hopeful bid. It wants to go higher. It is optimistically staying afloat in hopes that the Iran situation is resolved. Since March 19 we've traded down and right back up to where we were. That alone speaks volumes (no pun intended).
Sometimes markets bottom or top on capitulation from one side, on very heavy volume. Other times they top or bottom with a fizzle, on low volume. Don't make the mistake of assigning intent to a metric which does not always clearly convey intent.
$SPY $QQQ #ES_F #NQ_F
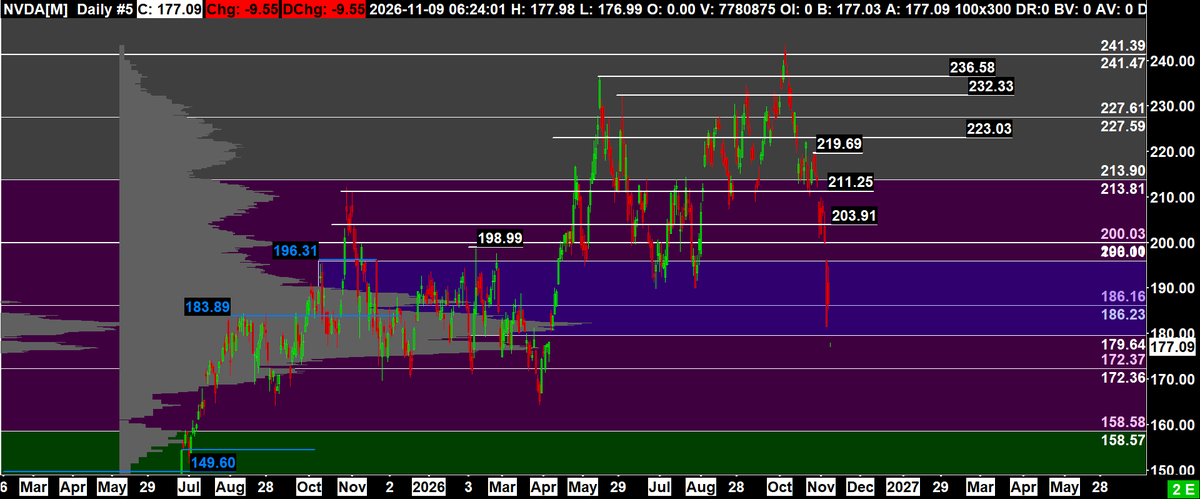
$NVDA @TradingSynHQ Under $179 look for bids at $172. Stock is right back into cost basis before the move up. IF it fails to hold these levels look for bids at $158.58
@dmartin_trading not a myth imo, just blunt. what i ended up doing intraday: measure how far price pushes off the open each hour, up and down separately, last 20 hours, take the 70th pct as a normal push. flags at about half and 3/4 of it. turned it into a free sierra study, chart is today
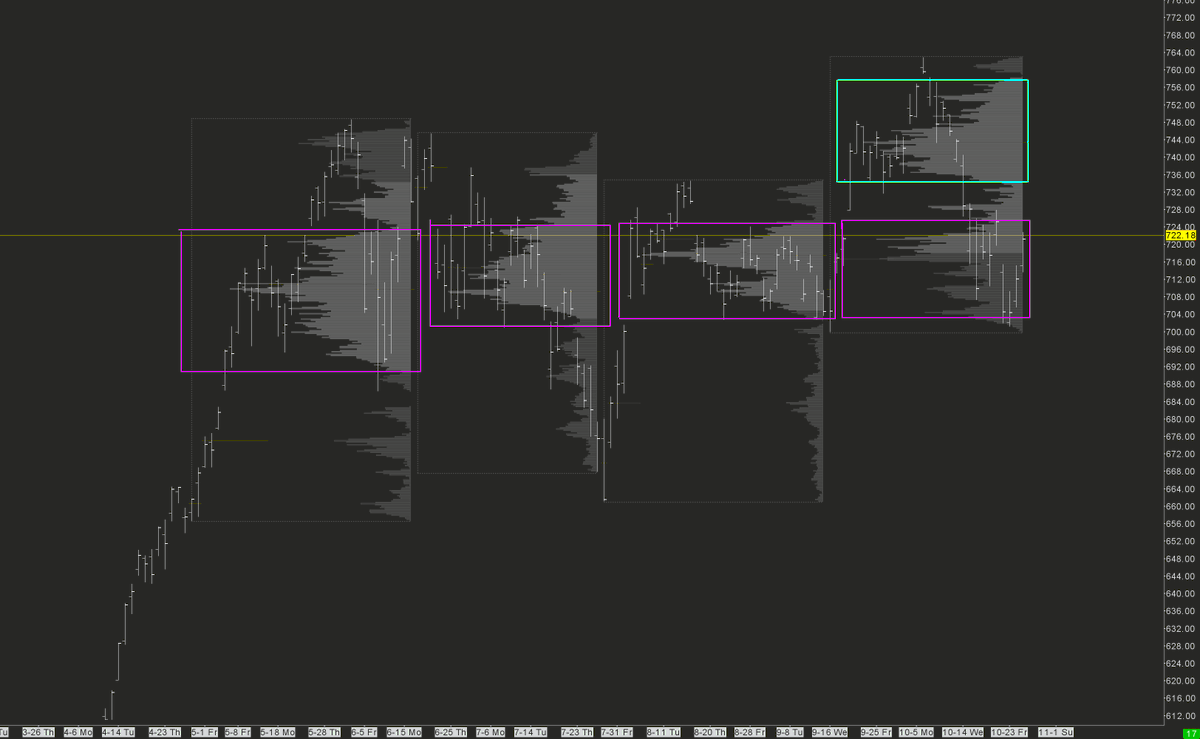
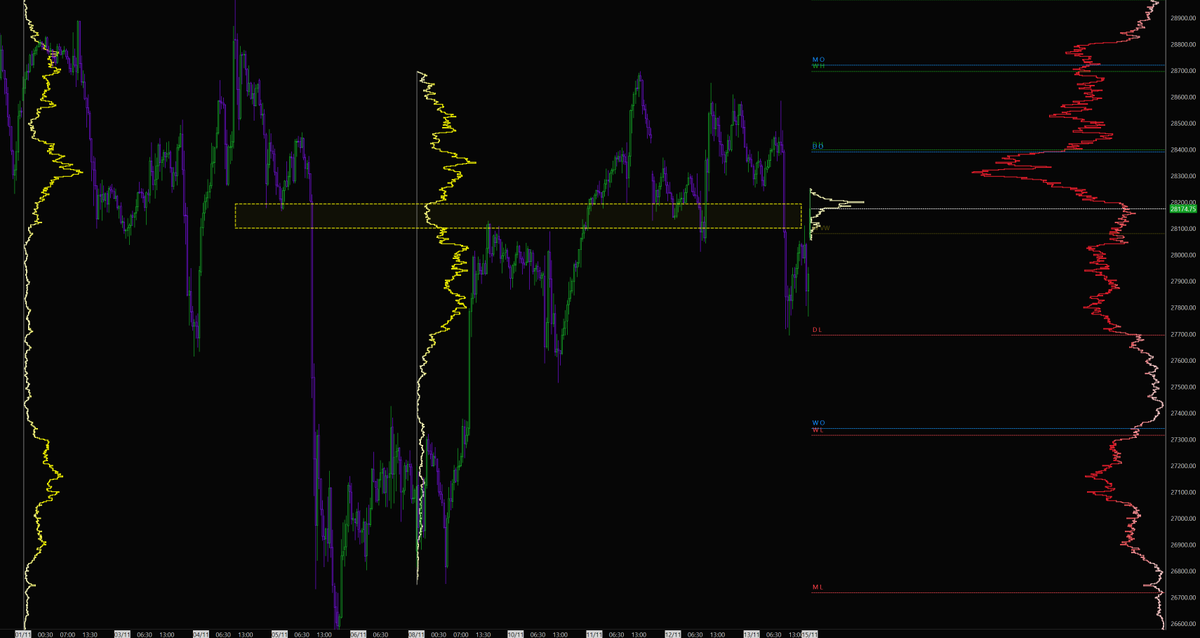
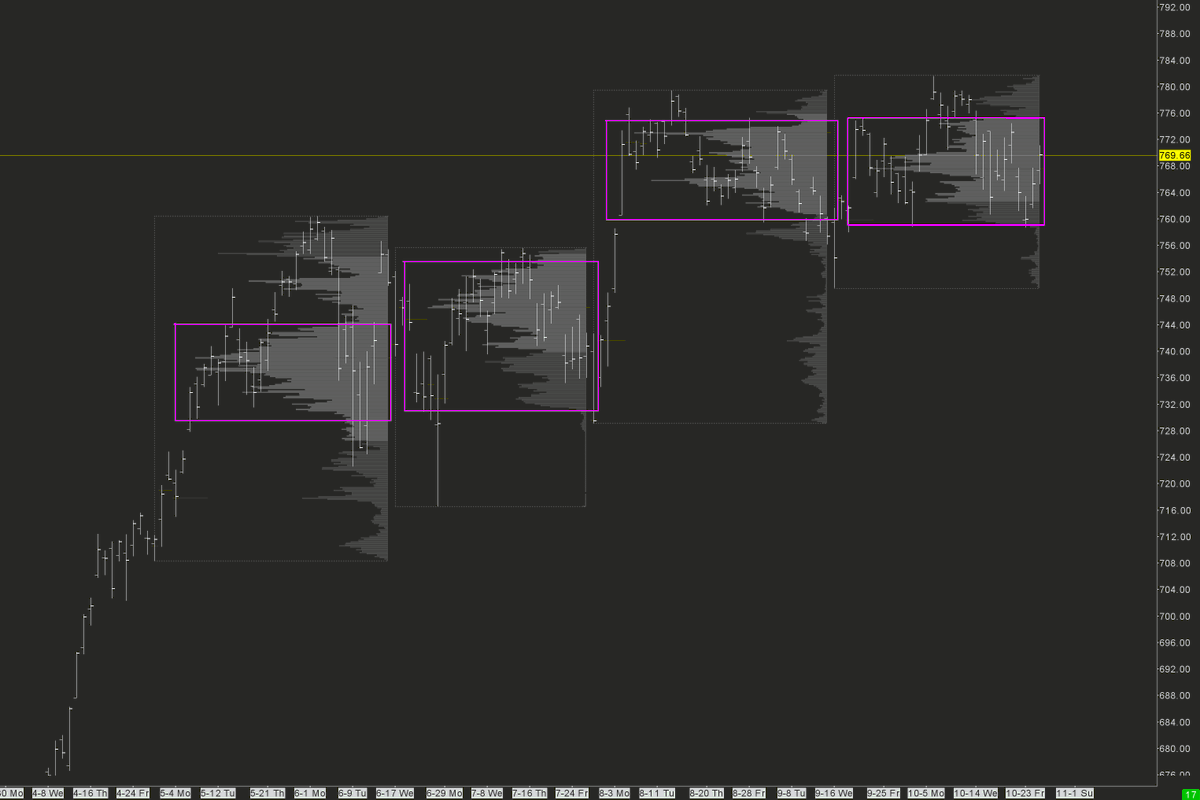
Nasdaq (first) and S&P (second) profiles for the last 4 FOMC periods.
Nasdaq value has remained remarkably consistent for the last 6 months. The anomaly is the distribution in the cyan box which we've just come down from.
You see the edges, you see the distributions.
#ES_F #NQ_F $SPY $QQQ