Agent Sigma is online!
Merging the power of AI with our expansive datasets and tools, this new functionality will supercharge your workflow!
Agent Sigma can do everything you can do in the app:
Set up a Stock Screener or Market Study ☑️
Launch a Backtest ☑️
Create a Ranking Model ☑️
Add Tickers to a Watchlist and configure it ☑️
Group Assets in a Portfolio ☑️
...or really just about anything you can think of!
The use cases are so broad that we really need your help to improve here -- just give us a thumbs up or thumbs down after an answer and let us know if the Agent is doing a good job for you! Enjoy!
Will the effort to reduce market complexity into a clean long-short playbook ever end?
No. As long as regimes shift and dealer positioning changes, univariate models keep getting recycled.
The nextSignals Lane.
The nextSignals framework, chronicled on social media dating back to 2014:
Anchor index option hedging flows and APMEM volatility forecasting within the structural mechanics of Auction Market Value Theory (AMVT).
More recently, add AI-assisted decision support.
And subroutine an explicit warning overlay* ... one that is not automatable ... but is essential to an AI-Human Hybrid model.
_____________________
* derived from Signal-Sigma options data
Sat Nov 14 | 7AM
nextSignals Brief: Buying on Weakness | Top Pick
(EOD 11.13.26)
Construction: Thinkscript EOD Scan > Signal Sigma Screen for bullish Dark Pools / Options sentiment > https://t.co/u0Q10JR8eP Report Assembly
Full Report (Netlify link): https://t.co/BbTVcsy9UY
* Be sure to click the navigation tabs: Desk Brief | Top Pick
A rare sentiment divergence signal has just triggered.
More than 51% of AAII survey respondents hold bearish views as of yesterday. By itself, this reading is unusually high, but doesn't work as a contrarian signal all the time. Such readings preceded legitimate bear market periods in the past.
However, extreme bearish sentiment may sometimes be unwarranted.
That's what our signal is designed to flag. In the upper panel, we compute our own internal sentiment reading, which is a derivative of market breadth and individual price strength.
When our metric is at least neutral (> 55) and the AAII survey is majority bearish (>51% bears), the signals get triggered.
They happen to coincide with periods when the market was coming out of deeper correction / bear territory.
Study link here: https://t.co/FlUeCoXNxY
So a +3.5% 4-day rebound following a -4% daily drop is good news, right? ... Right?
I ran the numbers on $SPY for this particular sequence and results skew negative at the 1-Week and 1-Month marks.
The dates associated with these signals all happened in years known for their volatility and bearish price action.
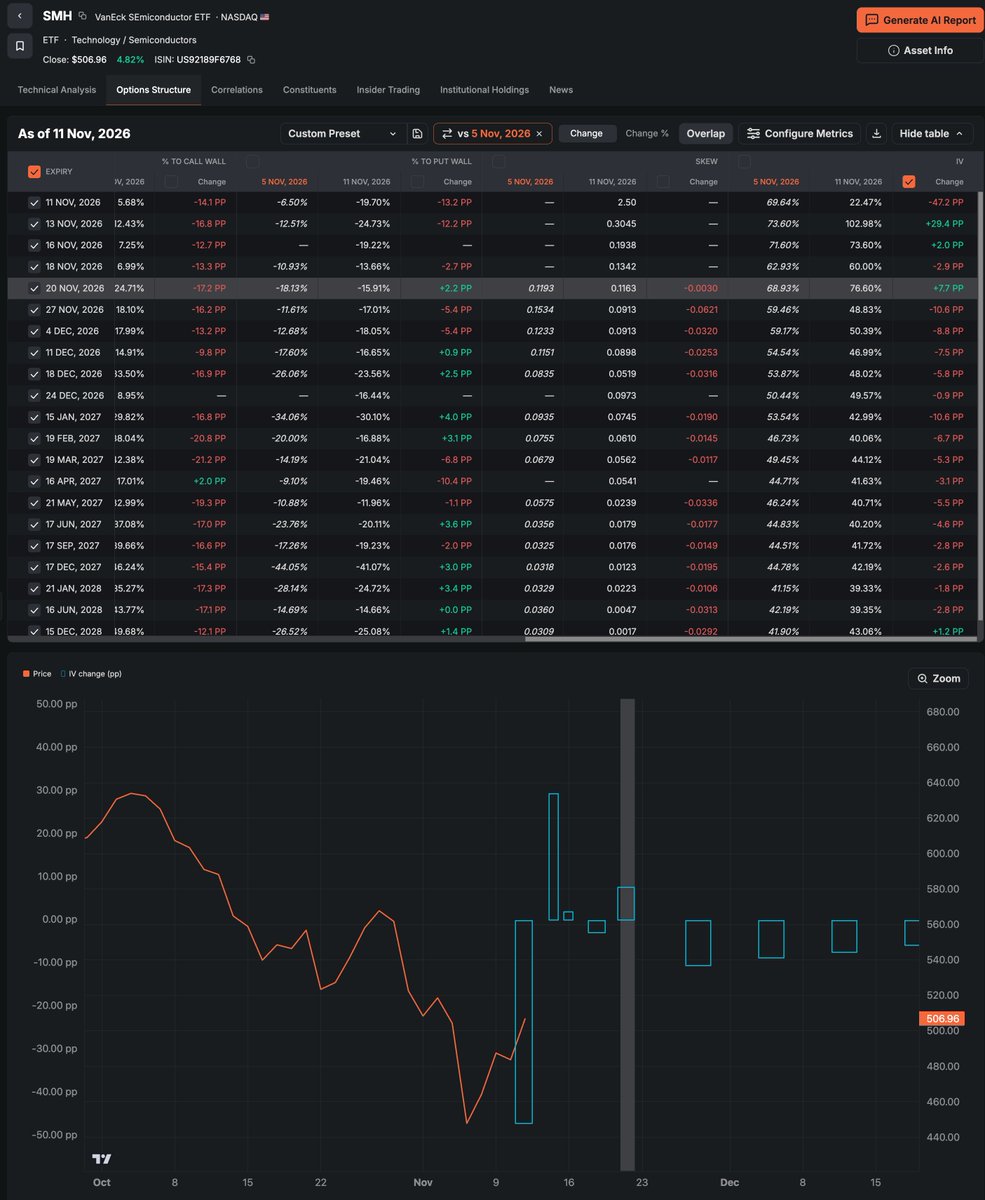
For semiconductors ($SMH) implied volatility for November 20 actually expanded to 76.6% from 68.9% as it was priced on Nov 5'th.
An IV expansion during an aggressive underlying rally indicates institutional desks treat this rebound with deep skepticism and are heavily hedged against near-term downside.
Further out, December 18 saw the put/call ratio collapsing to 0.61 as traders scrambled for upside.
This feature harks back to the early days (when Signal Sigma was but a blog), and I used to actually write these on-demand reports myself.
As the platform got larger, I had to exclude this feature, since it was no longer feasible to offer it.
But now we can do it at scale! I've tested it myself and can confirm the reports are not "slop". Rather they offer a balanced and reasonable analysis.
At the very worst, it can act as a second opinion to your analysis, or reveal nuances that you may have overlooked. Worth a try!
Make sense of our vast datasets by creating on-demand AI reports on various topics.
I'm an especially big fan of the Unusual Options Activity report that scans changes in various contracts between settlement dates:
"The rapid normalization of SPY’s options structure following November 9’s spike in defensive hedging signals underlying strength rather than mounting vulnerability.
Despite spot slipping to $750.02, implied volatility completely collapsed across near-term tenors rather than catching a downside bid.
The halving of November 20 IV from 44.93% to 22.22%, paired with put/call volume deflating from a panic-level 5.56 to 1.01 and a net contraction in put open interest, confirms that early-week hedging was transient and swiftly monetized or abandoned."
You could generate your report entirely from the latest earnings call transcript and fundamentals if you're so inclined (LLMs excel at summarizing transcripts).
Or go all out and analyze the technicals and dark pools flows.
All of these various angles get neatly stored, so that you can reference these reports in the future and see how they played out.
Make sense of our vast datasets by creating on-demand AI reports on various topics.
I'm an especially big fan of the Unusual Options Activity report that scans changes in various contracts between settlement dates:
"The rapid normalization of SPY’s options structure following November 9’s spike in defensive hedging signals underlying strength rather than mounting vulnerability.
Despite spot slipping to $750.02, implied volatility completely collapsed across near-term tenors rather than catching a downside bid.
The halving of November 20 IV from 44.93% to 22.22%, paired with put/call volume deflating from a panic-level 5.56 to 1.01 and a net contraction in put open interest, confirms that early-week hedging was transient and swiftly monetized or abandoned."
Make sense of our vast datasets by creating on-demand AI reports on various topics.
I'm an especially big fan of the Unusual Options Activity report that scans changes in various contracts between settlement dates:
"The rapid normalization of SPY’s options structure following November 9’s spike in defensive hedging signals underlying strength rather than mounting vulnerability.
Despite spot slipping to $750.02, implied volatility completely collapsed across near-term tenors rather than catching a downside bid.
The halving of November 20 IV from 44.93% to 22.22%, paired with put/call volume deflating from a panic-level 5.56 to 1.01 and a net contraction in put open interest, confirms that early-week hedging was transient and swiftly monetized or abandoned."
Mon Nov 9
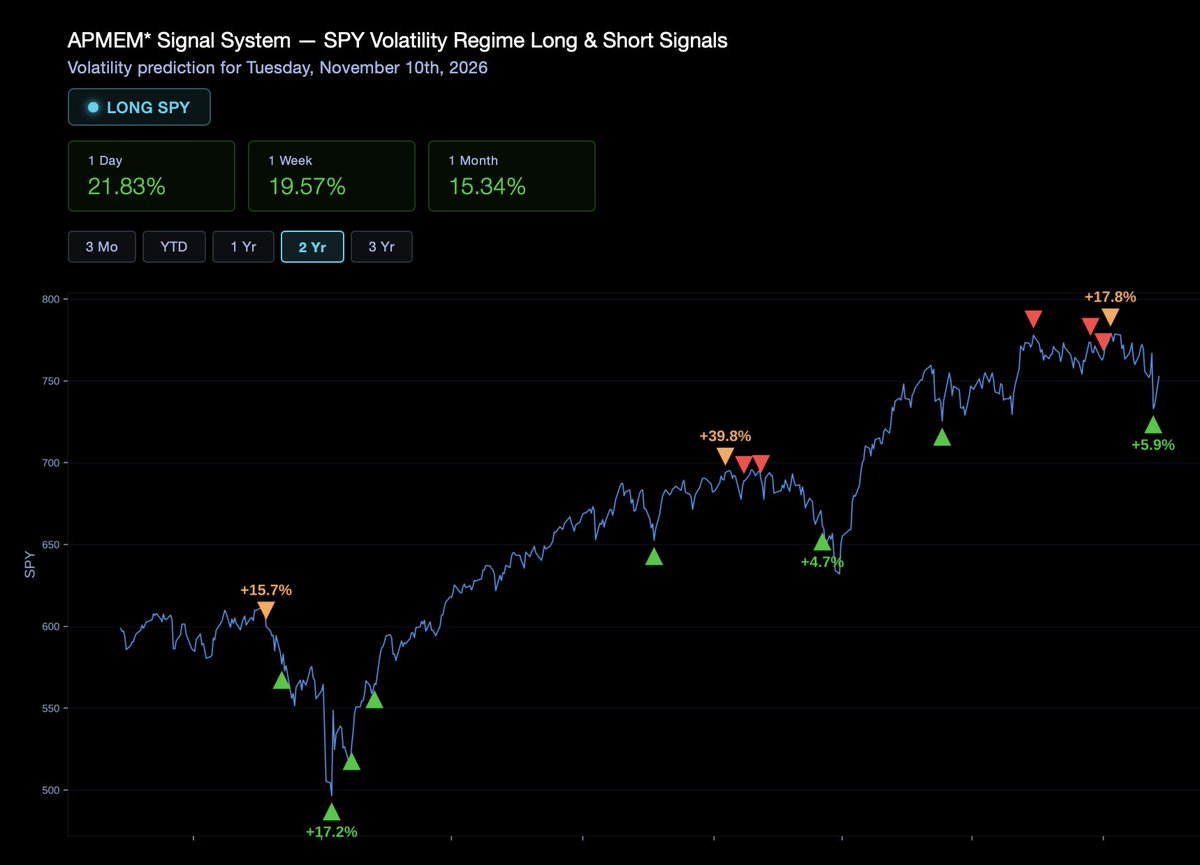
SPY Long-Short Signals Hybrid:
APMEM Volatility Forecast - SPY Options Inflections
The APMEM volatility forecast is straight out of the NYU Lab handbook (viz-a-viz their research formula).
The bottom watch and top watch signals are the hybrid ... that is, coincident signaling by APMEM Vol Forecast and Signal Sigma's bullish/bearish options conditions respectively.
Whether its SPX ... or QQQ ... or SPY ... these volatility forecasts have shown high performance in OOS testing and personal use for the past 3 years.
Netlify interactive link: https://t.co/swP7yZuFu4
Source Data: @Signal_Sigma
__________
Note: Details on this strategy have been posted repeatedly in the past.
While the drawdown “feels bad”, especially for tech and high beta holders, this is not what a real “capitulation event” looks like.
Not from a breadth perspective at least.
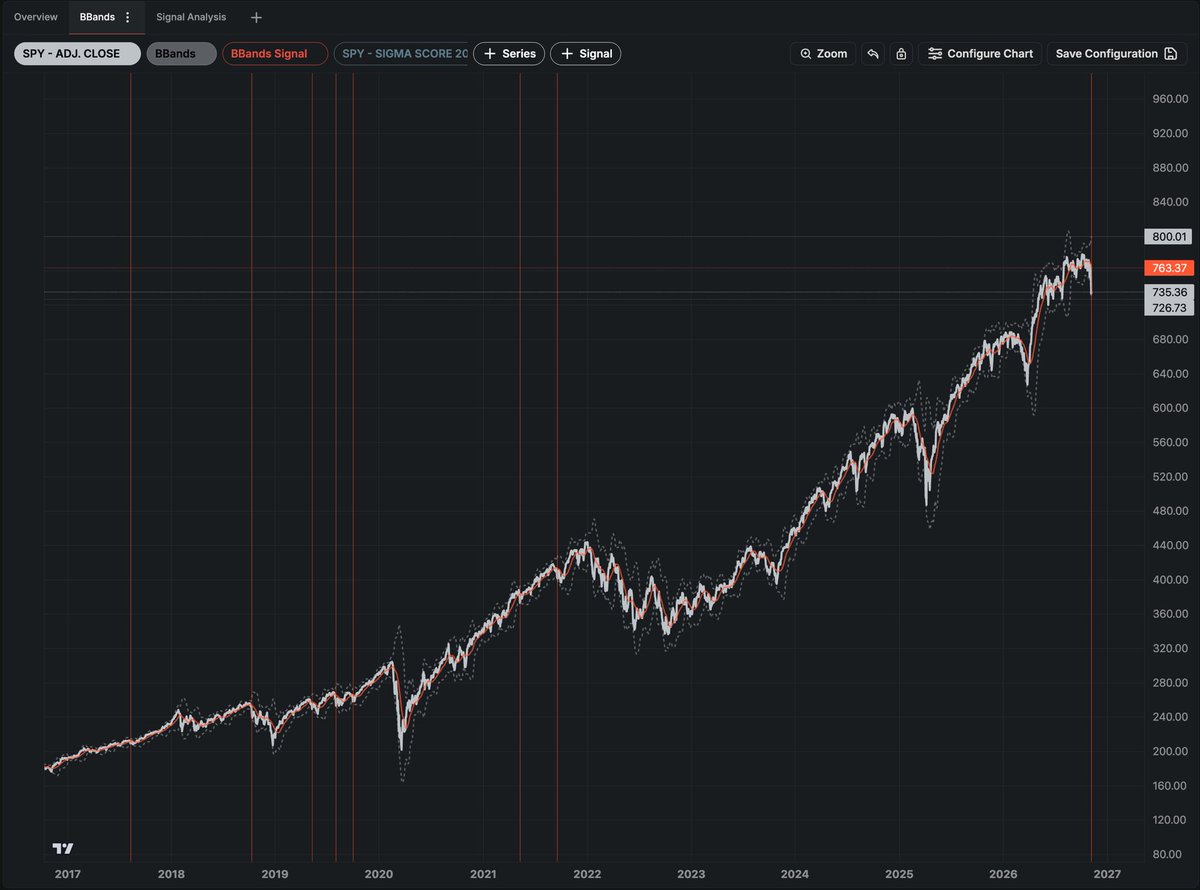
Last week’s selloff pushed the market 3.1 standard deviations below its 20-DMA.
This is an extreme reading which is unlikely to last.
We found 16 instances in the past 26 years when the index stretched this far below its 20-day average while holding above its 200-day average.
One month later, the market was higher in 13 out of those cases, with a median gain of +2.68%.
Small sample size, but tilts the odds in the dip-buyers favor as long as support holds.
Critically, this is $SPY, not $QQQ, $XLK or $SMH. Big difference right now.
Last week’s selloff pushed the market 3.1 standard deviations below its 20-DMA.
This is an extreme reading which is unlikely to last.
We found 16 instances in the past 26 years when the index stretched this far below its 20-day average while holding above its 200-day average.
One month later, the market was higher in 13 out of those cases, with a median gain of +2.68%.
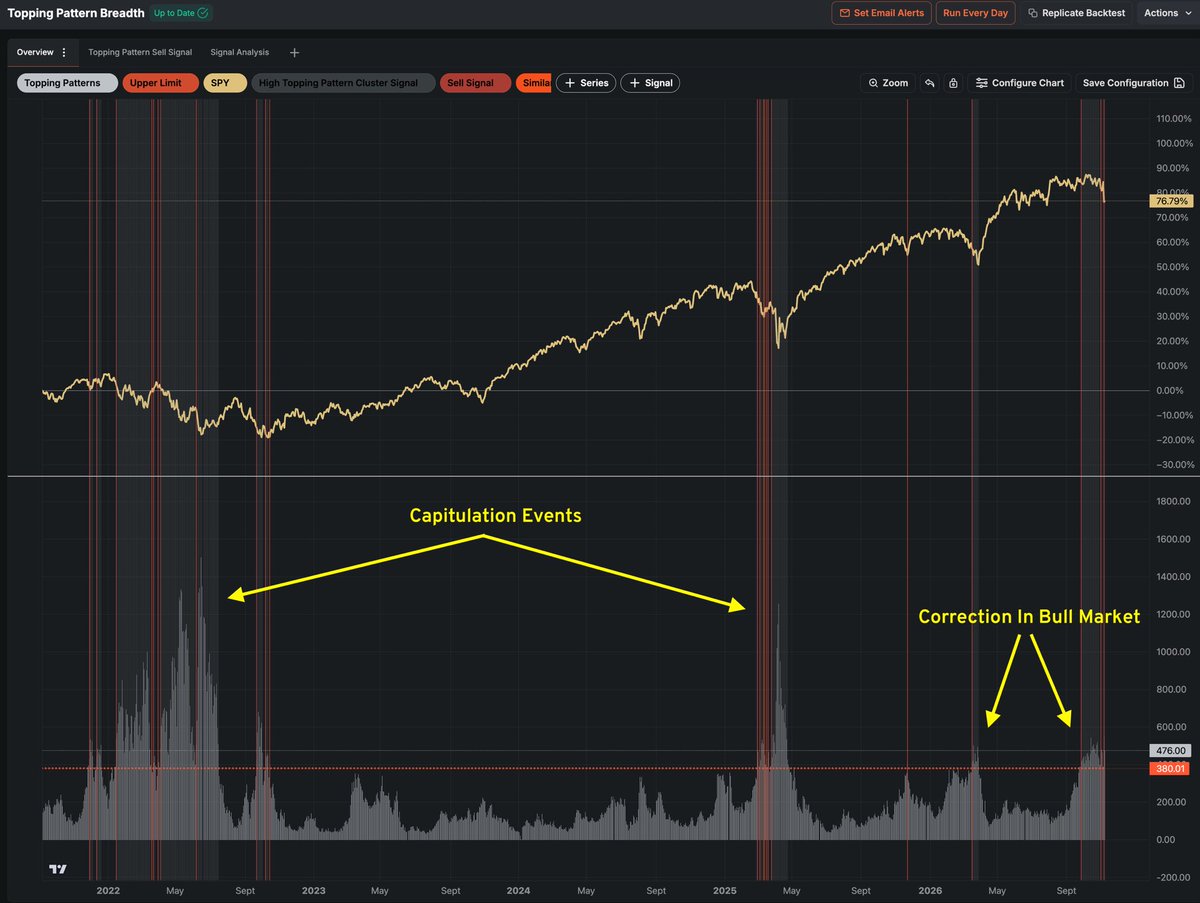
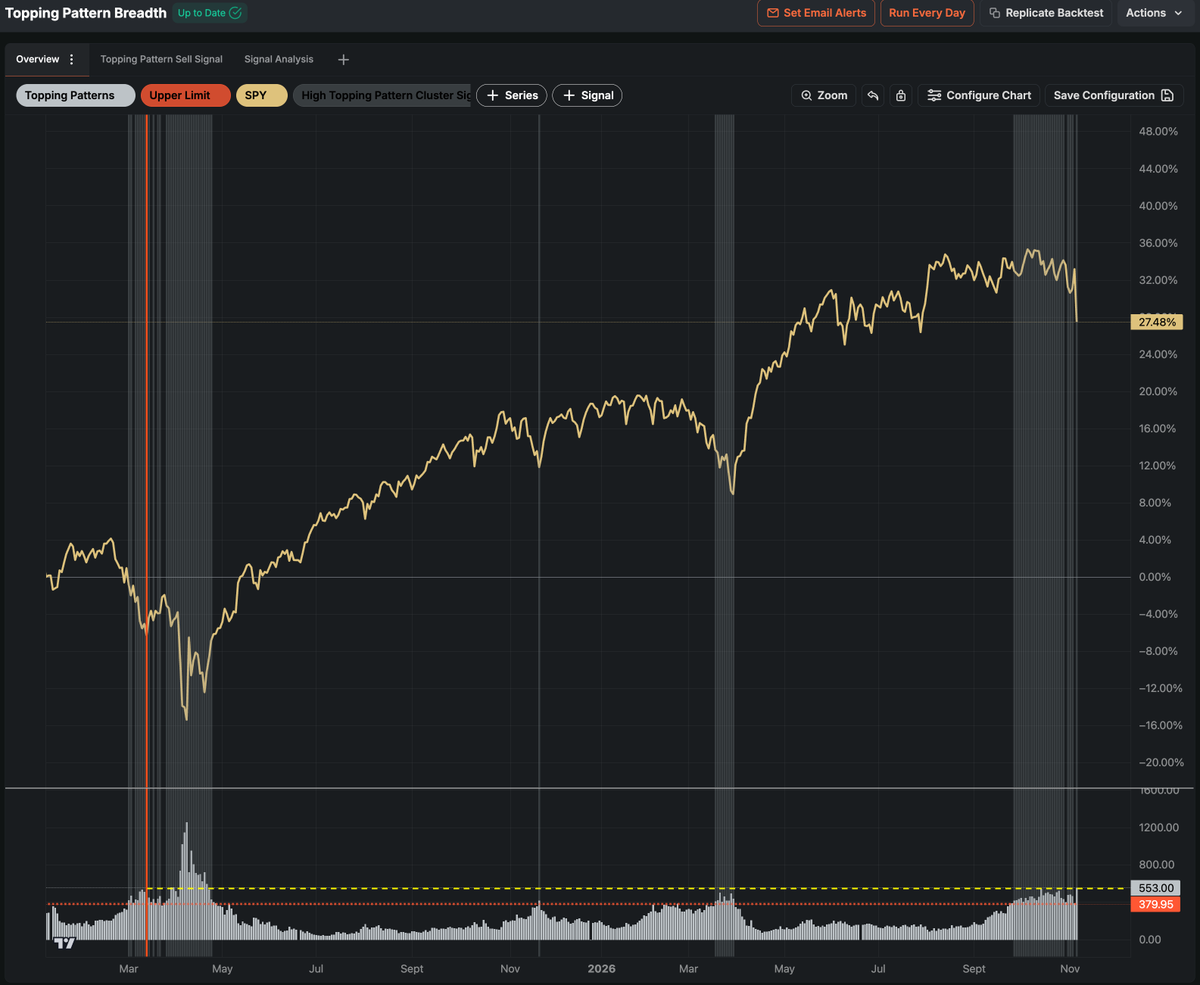
The number of stocks in topping patterns (now 553) is elevated enough to signal a risky regime, though it remains well below the capitulation lows of April 2025, when the figure exceeded 1,000.
Instead, the current reading is more comparable to the initial decline that produced a +4% bounce before eventually leading to a further and final low.
Topping Patterns = number of broken technical charts: https://t.co/3PAz2B66H6
In the study link above, you can actually scroll and see what real capitulation looks like. We're not nearly at those levels right now.
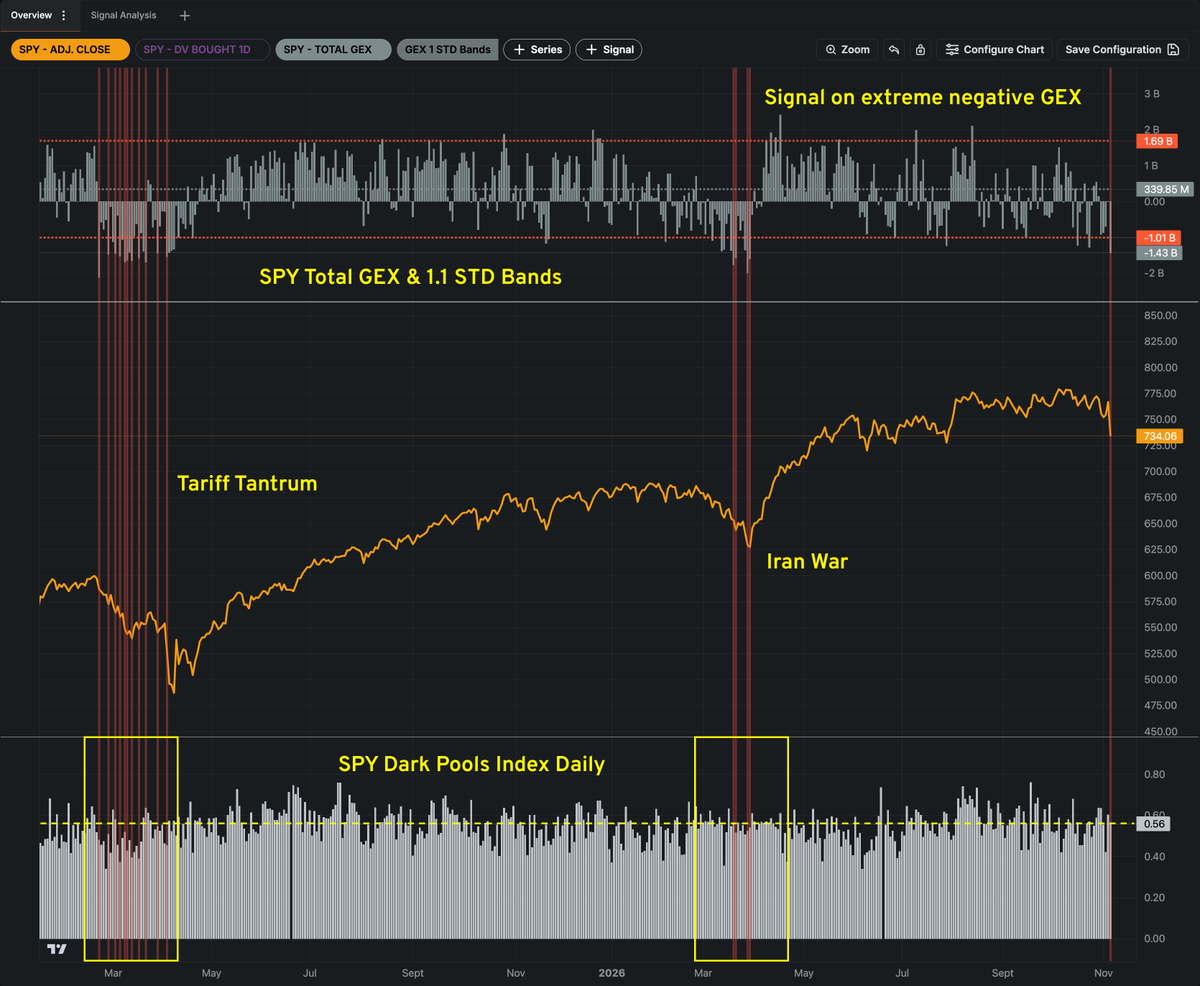
$SPY’s negative GEX has now reached levels comparable to those seen in the previous two crisis events: the Iran war and the 2025 Tariff Tantrum.
As the chart below shows, the same condition marked the bottom during the Iran episode, while in 2025 it only signaled the start of a more protracted downturn.
Although markets eventually recovered in both cases, the path and duration of the recovery differed markedly.
The bottom panel shows institutional accumulation via the Dark Pools Index, which was relatively high yesterday (56%); during the tariffs episode, institutional accumulation was significantly lower.
Full study here: https://t.co/xKljMuEBwP