Après des mois d’étude et d’apprentissage de la méthode ATS enseignée par @ATS_Eric et @Donovan_Ray_1 (merci pour leur partage d'expérience et de connaissances ! 🙏), voici les premiers résultats de backtests sur le Nasdaq via TradingView.
📅 Période de backtest : 01/01/2008 à aujourd’hui
📈 Résultats :
Taux de réussite : 78%
Performance totale : +940%
Drawdown : 15%
Levier: aucun (1)
À noter que ce backtest ne prend pas en compte les spreads ni les éventuels écarts de cours d’un CFD de broker.
On reste prudent et humble avec ces chiffres, mais c'est une base encourageante pour la suite. Hâte de voir jusqu’où cette aventure mènera ! #Trading #Backtesting #Nasdaq420
Comme promis @ATS_Eric 😉
J'ai refait le site de A à Z. Voilà ce qui a changé et pourquoi.
Avant : 10 entrées de menu, 9 sections, 7 stratégies affichées d'un coup. Un mur de données.
Maintenant : on commence par le début.
https://t.co/q2HWw1x1C0
#QuantTrading#Backtest
Claude Fable 5 will be available again globally tomorrow.
After a series of productive conversations with the US government, we're redeploying the model with a new set of classifiers to target and block more cybersecurity tasks. In the near term, some routine tasks like coding and debugging will fall back to Opus 4.8. We’ll continue to refine these classifiers over the coming weeks to reduce false positives and better distinguish genuine misuse from legitimate requests.
We’ve also begun drafting a consensus framework—with Amazon, Microsoft, Google, and other Glasswing partners—for assessing the severity of AI jailbreaks and how AI developers should respond to them. We invite other industry partners and model providers to join us in this effort.
Finally, we’re scaling up our collaboration with the US government on model testing and safeguards. This will include pre-release access to models and safeguards for evaluation, information sharing on jailbreaks and misuse, and dedicated resources for joint research.
Thank you to our users for your patience, and to our partners across the government, industry, and the research community who worked alongside us to make Fable 5 available again.
Read our full blog: https://t.co/VHyum831ri
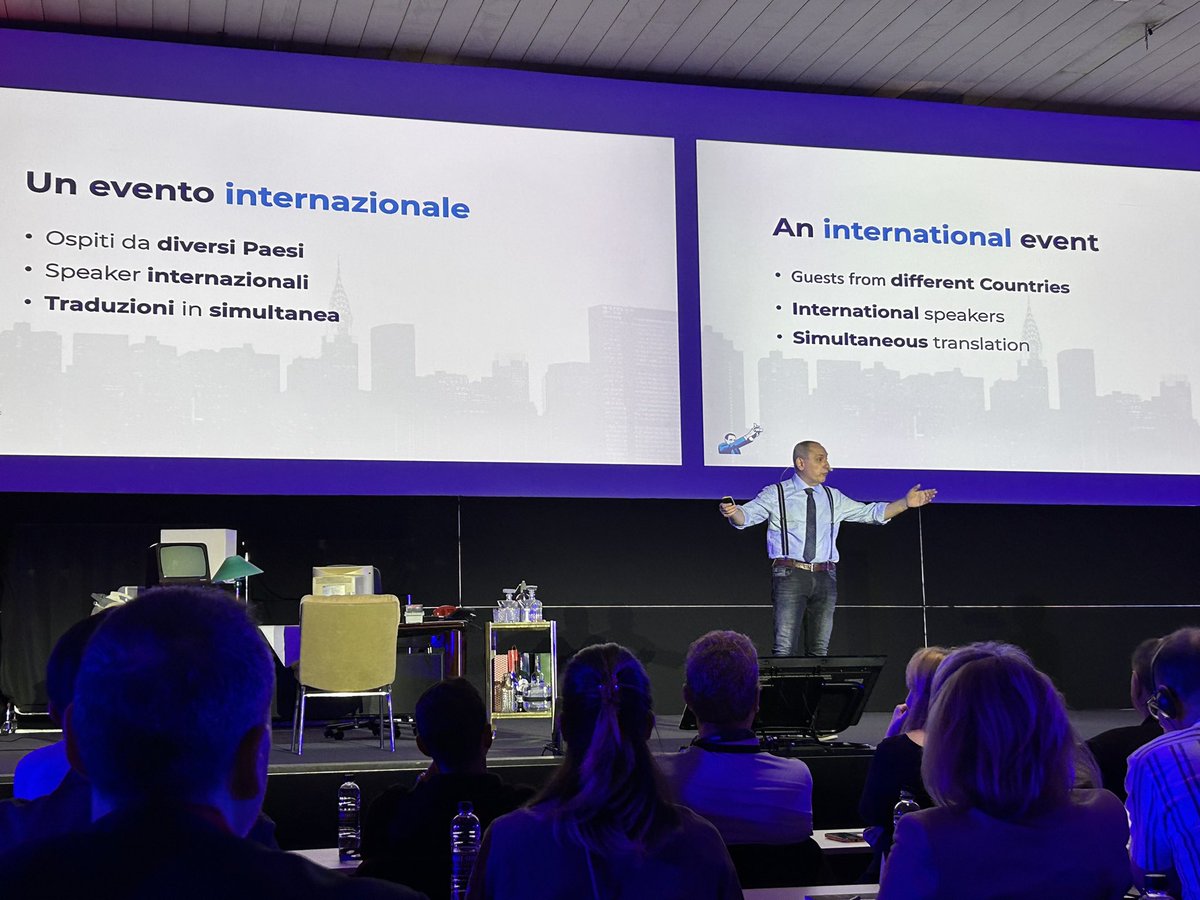
Superbe Algotrading Summit de Andrea Unger:
Je viens de passer 3 jours à côté de Venise au Unger Summit organisé par Andrea Unger (quadruple champion du monde de trading) avec Kevin Davey (triple
Champion du monde) et Michael Cook (ancien champion du monde également) comme invités d’honneurs.
500 algotraders venus du monde entier, c’était un moment riche en contenu et en connexions: inoubliable!!
Merci à @UngerAcademy et son équipe, @kjtrading pour le temps de qualité passé avec nous, Michael Cook pour ces conseils avisés sur le trading saisonnier et à tous les nouveaux amis algotraders venus des 4 coins du monde!
RSI is on almost every trader's chart. CCI gets mentioned occasionally.
I ran both through 4,500,000 tests to find out which one actually works as a breakout filter.
The result wasn't close.
The test setup: one foundational E-mini NASDAQ breakout strategy. Long only. Entry on a break above the prior day's low plus 0.8 x ATR(40). Exit end of day.
No indicator filters at all in the base version.
From that base, I generated 1,000 strategy siblings using strategy DNA extraction (I used an algorithm built in BreakoutOS). Same structure, different market calibration. 1,000 strategies effectively representing 1,000 different market regimes, all tested at the same time.
Then I set different RSI and CCI input parameters to test. 4,500 in total.
That's 4,500 parameter combinations across 1,000 strategies each. 4,500,000 total tests.
The scoring wasn't just "did net profit go up."
Each condition was ranked across three fitness functions: net profit/drawdown ratio, average trade improvement, and a bounce index. The bounce index is the one that matters most. It measures what percentage of originally losing strategies a filter was able to recover. Not just improving winners. Actually fixing broken strategies.
The threshold for a full recommendation: improving more than 500 out of 1,000 strategies. That's a hard bar.
Here's what RSI's best condition returned.
A 50% recommendation score. Rated "viable." It improved some strategies. It never dominated on any of the three fitness functions. It didn't crack the top half of the rankings.
Here's what the best CCI condition returned:
640 out of 1,000 strategies improved on net profit/drawdown.
650 out of 1,000 improved on average trade.
610 out of 1,000 improved on the bounce index.
Average trade improvement: +65%. Bounce index improvement: +60%.
Every top-ranked condition on the scorecard was CCI. RSI didn't appear until the lower half.
The winning CCI condition wasn't "CCI above 100."
It was this: take the lowest CCI value over the last N bars and check whether it dropped below -100 at any point in that window.
Like this: CCI_FILTER = Lowest(CCI(x), N-bars) < -100
Not where CCI is right now. Where it has been recently.
The logic: if the market registered deeply oversold CCI during the lookback period and is now breaking out, that's a trend-following signal with genuine momentum behind it. Flat CCI throughout the window means weak directional context. The filter excludes those setups.
Optimal parameters: CCI period 33, lookback 12 bars, lowest CCI below -100.
The optimization map showed something more important than a single best value.
Almost any CCI period between 24 and 36, combined with a lookback between 8 and 16, produced robust results. You're not searching for one magic number. You're working inside a validated zone.
RSI measures where price is relative to its recent range.
CCI measures where price is relative to a statistical average. For a breakout strategy that needs directional context, that distinction is exactly what matters.
4,500,000 tests. CCI won every category. RSI didn't come close.
Excellent article de @onlybreakouts sur les filtres dans les stratégies de breakout! Conclusion: rien de mieux qu’un bon vieux filtre de volatilité, de tendance ou de volume pour améliorer significativement une stratégie de breakout !
Save this. The next time someone pitches a proprietary indicator, remember what 4,115 strategies said about complexity vs simplicity.
The full indicator study - 100 AI-generated conditions, ranking tables, methodology: https://t.co/vIKwvCTjmq
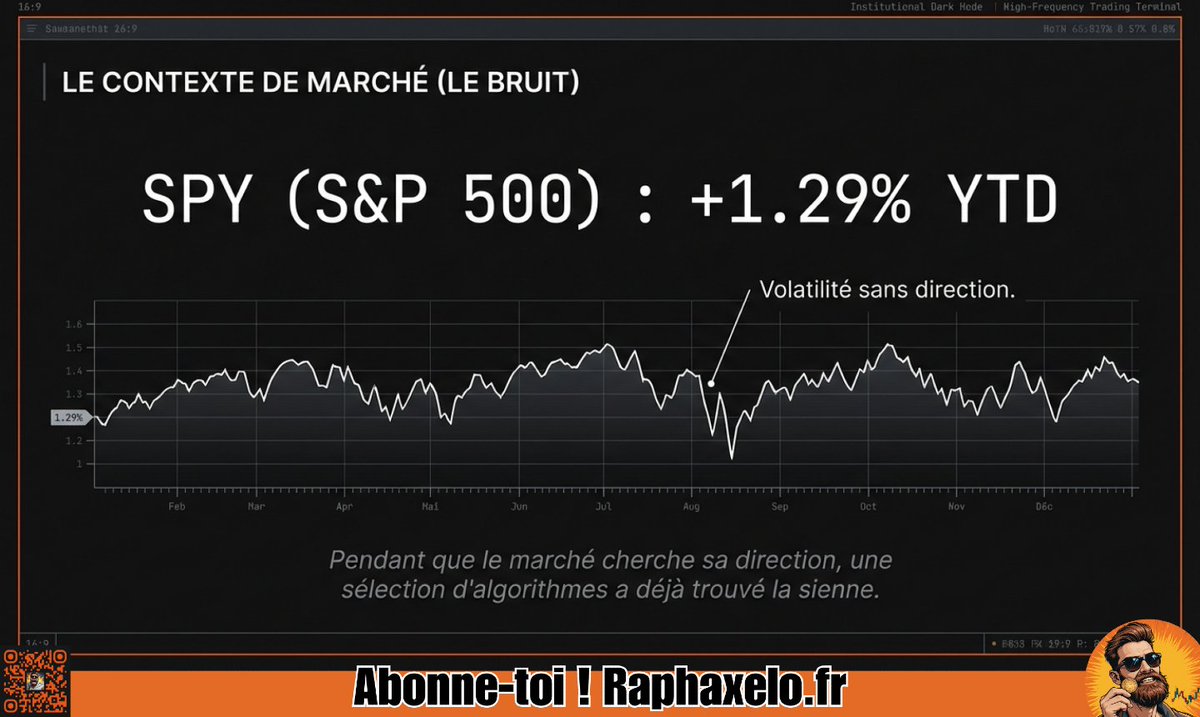
🚨 Le marché fait du surplace (+1.29%), mais nos algos viennent de sortir les scores de janvier.
Certaines stratégies ne se contentent pas de battre le marché : elles l'atomisent littéralement.
Focus sur le TOP 3 des portefeuilles qui dominent 2026. 👇
@NotionRaphaxelo Merci @NotionRaphaxelo ☺️! Et bravo surtout à toi pour tout ce que tu as monté en 2025: c’est énorme! Alors je te souhaite tout le succès que tu mérites grandement! 👍🍀
Bonne année 2026 🎯
2025 = 1ère vraie année de trading systématique.
Même algorithme ATS (CFD DAX – FXCM), deux réalités :
En Démo :
+85 % (+42K€ sur un capital de 50K€ réinitialisé tous les mois, 2% risqué par trade) pour un DD de ~20%
En Live (argent réel, semi-auto) :
+23 % depuis Juin pour un DD de 15%
2026 : Apprentissage continu, mise en place et robustification d'un portefeuille d'algos si le temps (et ma patience) me le permet.
Merci à mes mentors ATS: @Donovan_Ray_1 et @ATS_Eric 🙏
Et merci aussi les gars à @265Souls , @DavidG18278195 et @NotionRaphaxelo pour votre support et votre enthousiasme motivant!
@265Souls Merci @265Souls ! Mes meilleurs vœux à toi aussi! 🥂 Ton approche et tes algos sont une source de motivation aussi!!
J’espère retrouver du temps car c’est ça la denrée rare!
@NotionRaphaxelo Top ca! Il me tarde de découvrir ca :)
Une bonne interview bien détaillée de lui ici : https://t.co/WdLT9FAmu4
(tu peux t'abonner à la chaine si t'es ok avec l'anglais et si c'est pas déjà fait, ca devrait te plaire :))
@NotionRaphaxelo C'est une sorte de stratégie Momentum + Quality avec rotation de valeurs périodique? (sélection des actions au plus fort momentum qui satisfont des critères fondamentaux?) Nick Radge fait ca, c'est un truc que j'ai dans le radar (quand j'aurais enfin du temps)