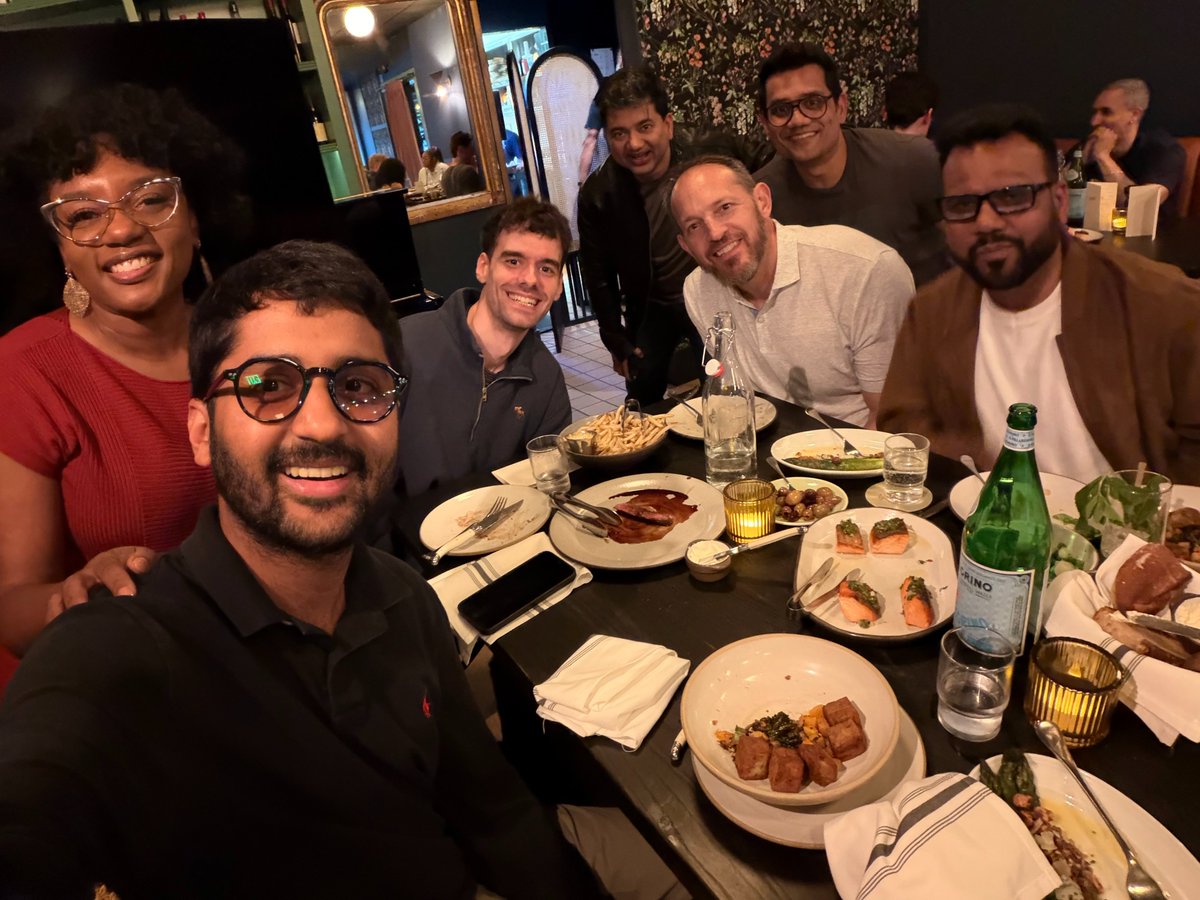
Fantastic evening connecting with the @OracleDevs team and fellow community members before the main event in San Francisco! 🇺🇸
Looking forward to tomorrow’s technical workshops at Oracle HQ. I’ll be diving deep into building agentic applications and speaking with the executive team.
3 Calls, 2 Real Conversation: My Experience with the Aurora AI Team 👨🏻💻
(I Didn’t Expect This from an Open Source Team Call..... What Happened When I Shared My Real DevOps Problems with Aurora AI) #LearningInPublic
🚀 Real Conversations > Tutorials — My Experience with the Aurora AI Team
Over the past few days, I had the opportunity to interact with a member of the Aurora AI team across multiple calls—and honestly, it turned out to be far more valuable than I expected.
🔹First Call
A quick 15-minute introduction. Got a clear overview of the platform and clarified some initial doubts. (ft. NoahCasarottoDinning )
🔹Second Call
Unexpectedly cancelled due to an ice storm in Montreal (no WiFi, no internet). A reminder that behind every tech product, there are real-world challenges too.
🔹Third Call (The Real Deep Dive)
This was supposed to be another short call… but it stretched to 40+ minutes. (ft. OlivierTrudeau )
And that’s where the real learning happened.
💡 What We Discussed
At the very beginning, he made something very clear:
They are not hiring, and they don’t want to give false hope or waste anyone’s time.
That honesty stood out.
I shared my perspective —
I’m not here just for roles, but for hands-on learning, real-world exposure, and building meaningful systems.
⚙️ My Hands-On Experience with Aurora AI
I walked him through my implementation journey:
✅ Challenges I faced:
i) PostgreSQL credential issues
ii) Grafana setup & experimentation
iii) SSH authentication struggles
iv) AWS connector complexities
✅ What worked smoothly:
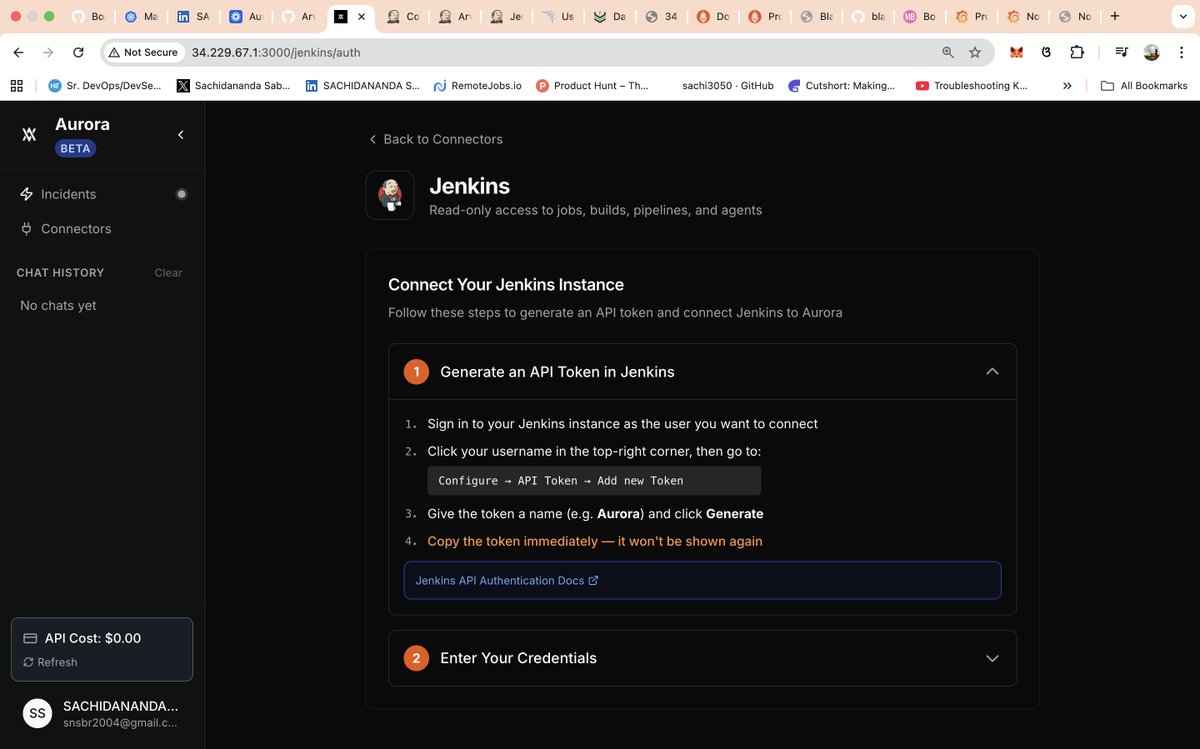
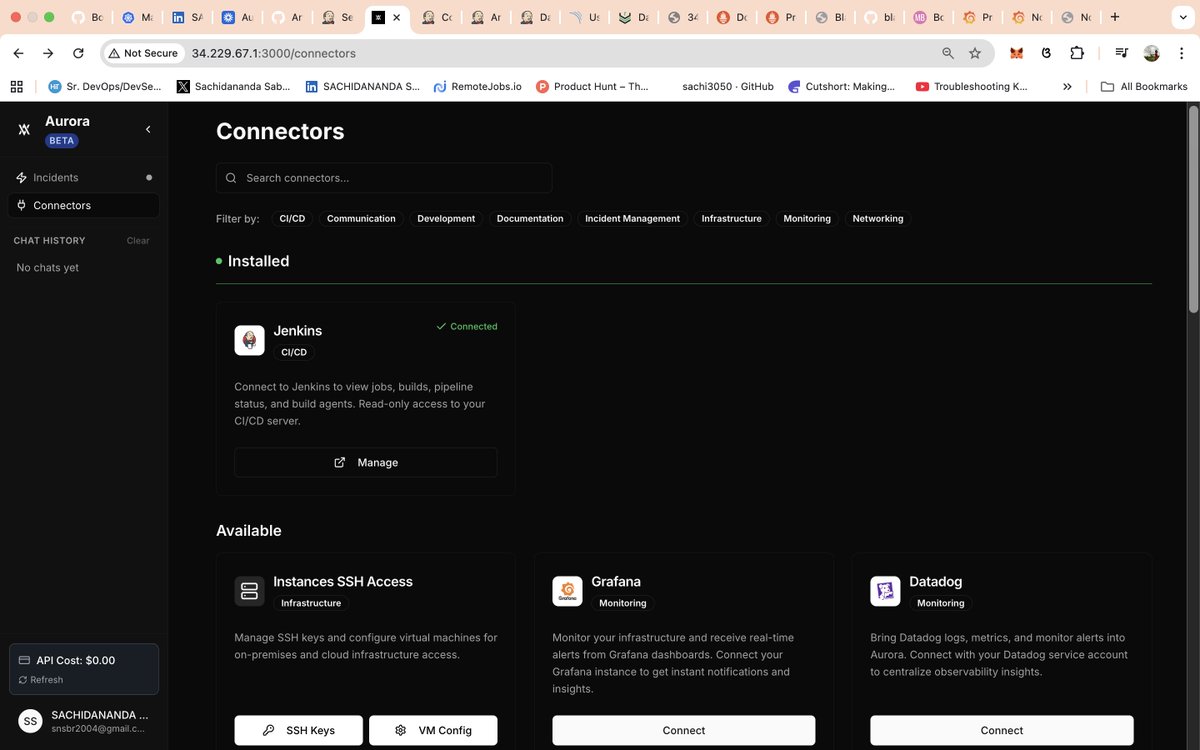
Jenkins Connector — surprisingly frictionless
→ Honestly, this was the most enjoyable part of the integration.
His reaction?
He genuinely appreciated hearing real user problems, not just “everything works fine” feedback.
🔍 My Approach
I wasn’t just “using” Aurora AI.
I was:
i) Breaking my own system (intentionally)
ii) Stopping services inside a Kubernetes cluster
iii) Observing logs in Grafana
iv) Watching how Aurora AI detects and triggers incidents
Because that’s how real learning happens.
💬 A Moment That Stuck With Me
When I mentioned Jenkins was smooth, he said:
"We recently worked on that connector — we really needed real user feedback."
That moment made me realize:
👉 Your hands-on experience matters more than you think.
📚 Advice I Received
At the end, I asked for one piece of advice.
He said:
👉 "Push more. The way you experiment, explain, and think — that’s what will take you forward."
And honestly, that hit differently.
🌱 Final Thoughts
It didn’t feel like a formal call.
It felt like a real conversation between builders.
Also had a great discussion about:
1) Open-source culture
2) How hectic and multi-dimensional their work is
3) Managing engineering + product + growth simultaneously
🙏 Huge thanks to "OlivierTrudeau" for the time, honesty, and guidance.
Also grateful that he appreciated my #LearningInPublic journey.
I’ll keep building. I’ll keep experimenting. 🚀
For more detailed Explanations : https://t.co/Ra8SM18ZcN
#DevOps #SRE #OpenSource #AuroraAI #LearningInPublic #AWS #Kubernetes #Jenkins #Grafana
🚀 Implementing an AI-Driven SRE Lab with Aurora on AWS
(End-to-End DevOps Lab Setup: Aurora AI, EKS, CI/CD, and Observability 🤓👨🏻💻)
Over the past few days I’ve been experimenting with an open-source platform called Aurora — an AI-powered root cause analysis tool for Site Reliability Engineers.
To explore it properly, I built a small DevOps/SRE lab on AWS EC2 with four dedicated VMs:
• Aurora / AI – running the Aurora application
• EKS-Cluster – Kubernetes cluster provisioned via Terraform
• Jenkins – CI/CD automation server
• Monitoring – Prometheus + Grafana stack
Step 1: Aurora Setup
My first focus was getting Aurora running. It took time because I’m relatively new to infrastructure setups like this. After several troubleshooting sessions and persistence, I finally succeeded in configuring it. I had already shared that journey in my previous post.
Step 2: Creating the Kubernetes Layer
Next came the EKS cluster.
I forked my Git repository where I implemented a Terraform-based EKS cluster creation workflow and initiated the cluster provisioning.
Step 3: CI/CD Infrastructure
After the cluster was ready, I moved to the Jenkins VM.
This part included:
i) Setting up Jenkins
ii) Installing and configuring SonarQube
iii) Setting up Nexus Repository
iv) Installing Jenkins plugins
v) Adding credentials securely
vi) Creating CI/CD pipelines
vii) Configuring RBAC in Kubernetes
viii) Creating Kubernetes secrets in Jenkins for cluster authentication
ix) Troubleshooting failed builds until pipelines were stable
This is something I work on almost daily, so even though it’s time-consuming, it becomes a natural flow of learning and improvement.
Step 4: Monitoring Layer
Then I focused on the Monitoring VM:
Installed:
1) Prometheus
2) Node Exporter
3) Blackbox Exporter
4) Grafana
Prometheus collects metrics from exporters and forwards them to Grafana for visualization.
Step 5: Integrating Aurora
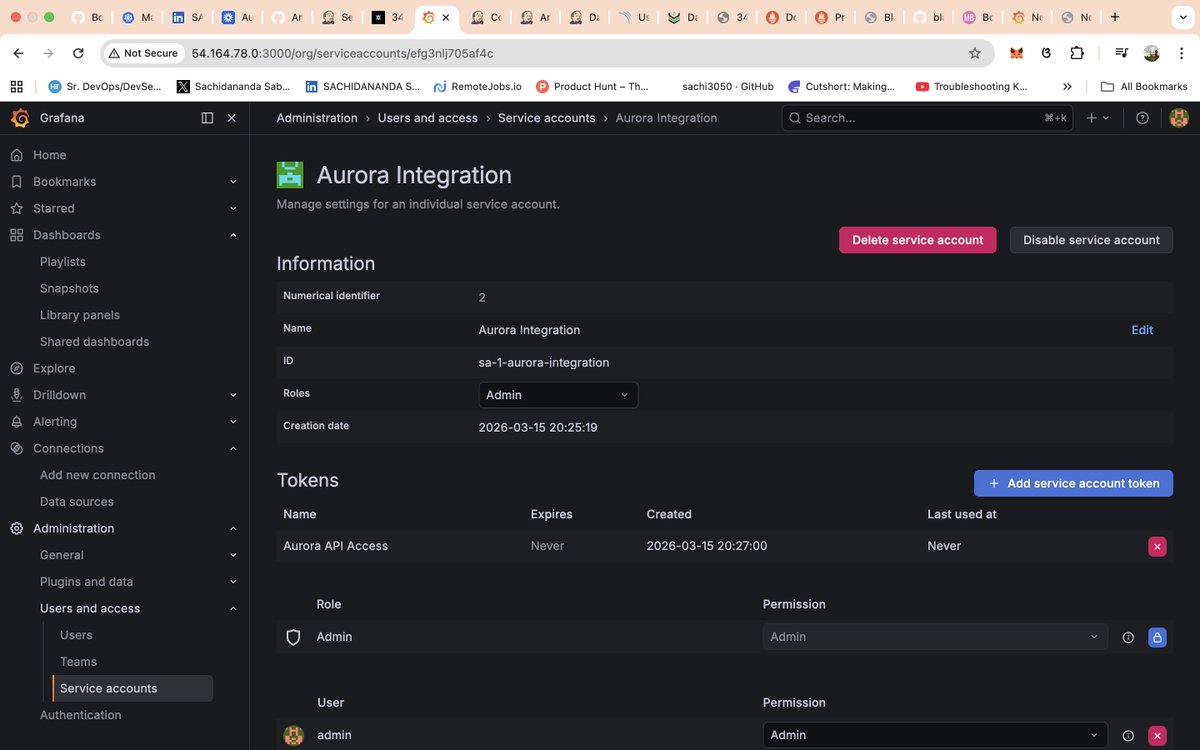
Now came the most interesting part — integrating Aurora AI with the monitoring stack.
Aurora is designed to perform AI-powered root cause analysis (RCA) for incidents. Instead of manually checking logs across multiple systems, Aurora automatically gathers telemetry, correlates signals, and identifies the most likely root cause.
The platform has two key sections:
🔹 Incidents – where alerts and incidents appear with RCA insights
🔹 Connectors – where integrations are configured (Grafana, Datadog, Netdata, Dynatrace, Coroot, Splunk, ThousandEyes, PagerDuty, BigPanda, and more)
Some of these tools were completely new to me, which made the exploration even more interesting.
Whenever an issue occurs in the system, Aurora can trigger an incident, analyze the logs and telemetry, and surface the actual root cause.
This means instead of spending hours digging through logs, SREs can focus on improving system reliability and architecture.
Currently, everything is running well except one challenge:
I’m still working on connecting Grafana with Aurora properly.
Once that’s done, I plan to intentionally break parts of the system and observe how Aurora performs AI-driven root cause analysis in real scenarios.
This entire project is purely for learning and experimentation.
If you’re building similar DevOps/SRE setups, hopefully this journey gives some context for troubleshooting along the way. The documentation is quite detailed — but hands-on work always teaches the most.
Huge thanks to:
• @LauretteBonfilsDuval for introducing me to this platform
• @NoahcasarottoDinning for the discussion about this application, in a quick call
• @DamianLoch for the demo of the application Always building, always learning.
For more detailed Explanations : https://t.co/8NXsT9aZsH
GitHub : https://t.co/KMFaKCCT3F
Website : https://t.co/Ga5MX40ZEt
#LearningInPublic #SRE #DevOps #OpenSource #AuroraAI #CloudComputing
🚀 Installing Aurora – AI-Powered Root Cause Analysis for SREs (Learning Journey)
Recently, I spun up an AWS EC2 instance named “AI” and attempted to install an open-source application called Aurora, an AI-powered root cause analysis platform designed for Site Reliability Engineers.
This wasn’t my first attempt. In a previous try, I got stuck around the database layer and had to pause the setup. This time, I came back with a bit more clarity and determination to see it through.
Here’s a quick summary of the challenges I ran into during installation:
1) Docker & Docker Compose issues
The system initially didn’t have Docker and Docker Compose installed.
2) Compose version mismatch
The repository expected the newer Docker Compose v2, but the environment had an older version which caused CLI compatibility issues.
3) Makefile troubleshooting
The Makefile actually turned out to be extremely helpful for debugging and understanding the build process.
4) "No space left on device" error
This one took a while. I tried cleaning unused Docker images, then expanded storage, and finally adjusted some configuration before things started moving again.
5) Vault token hide-and-seek
Aurora uses HashiCorp Vault for secrets management, and retrieving the Vault root token was an interesting puzzle. Eventually, I had to dig into Docker container logs and processes to extract it.
And then finally… 🎉
I saw the Aurora login page, created a new account, and started exploring the platform.
For testing, I initially used an OpenRouter API key with a 1-hour expiration. Later I generated a new one with a longer expiry and restarted Aurora to continue experimenting with the features.
This entire exercise was purely for learning purposes, and I wanted to share it because if you’re new to this kind of infrastructure setup, you might run into similar hurdles.
The documentation is actually very good and step-by-step—but hands-on troubleshooting teaches a lot more.
Huge thanks to:
• @LauretteBonfilsDuval for introducing me to this platform
• @NoahcasarottoDinning for the discussion about this application, in a quick call
• @DamianLoch for the demo of the application
Always building, always learning.
For more detailed Explanations : https://t.co/3lOzi5oCDG
GitHub : https://t.co/KMFaKCCT3F
Website : https://t.co/Ga5MX40ZEt
#LearningInPublic #SRE #DevOps #OpenSource #AuroraAI #CloudComputing
Containerizing and Monitoring a Java Application with Modern DevOps Tools 🤓👨🏻💻
(DevOps in Action: Jenkins Pipeline + Kubernetes Deployment + Monitoring Stack )
Recently, I worked on deploying and monitoring a Java-based BoardGame application in a cloud-native environment. The goal was not just deployment, but also building a complete DevOps pipeline with security, artifact management, and observability.
The application was containerized using Docker and deployed into an Kubernetes cluster running on Amazon EKS.
To automate the build and deployment workflow, I implemented a CI/CD pipeline using Jenkins.
Here’s a quick overview of the workflow and tooling involved:
1) Installed Java as a prerequisite for Jenkins
2) Integrated Apache Maven for building the application
3) Implemented code quality analysis using SonarQube
4) Performed vulnerability scanning using Trivy for both files and container images
5) Managed artifacts using Sonatype Nexus Repository
After the CI/CD pipeline was in place, I moved to the observability layer, which is essential for understanding system health and performance in production.
For monitoring and metrics collection, I implemented:
i) Prometheus for metrics scraping and storage
ii) Grafana for building dashboards
iii) Prometheus Node Exporter to monitor node-level metrics
iv) Prometheus Blackbox Exporter for endpoint and service availability checks
This project helped me connect multiple DevOps concepts together — CI/CD, containerization, Kubernetes orchestration, security scanning, artifact management, and monitoring.
Building the full pipeline from code to observability provided a much clearer understanding of how modern cloud-native applications are deployed and monitored in real-world environments.
Thank you for your valuable time. See you in the next one.
Special thank to @devopsshack for the Tutorial and source code.
Keep Learning in Public 🚀
GitHub Repo : https://t.co/fAqo7iNYFL
For more Details : https://t.co/zhhjGWXnUl
......
#DevOps #Kubernetes #AWS #Monitoring #Observability #Jenkins #Docker #Prometheus #Grafana
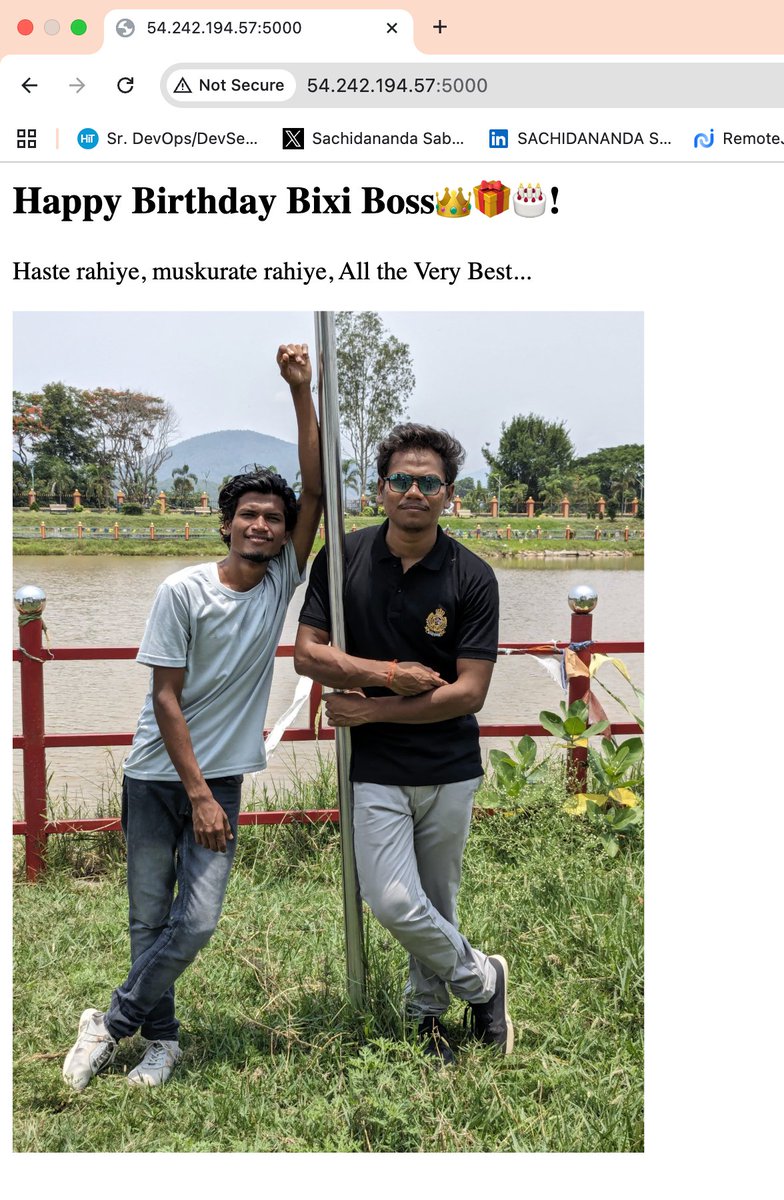
Deploying a Birthday Surprise with DevOps: A Fun Python + Docker Project 🤓👨🏻💻
(Code, Containers, and Celebration: A DevOps Birthday Project 🤩)
Sometimes the best way to celebrate someone is by combining creativity with the skills you love. This time, I decided to do something a little different for a close friend’s upcoming birthday.
Instead of a traditional message, I built a small DevOps-powered birthday surprise.
The idea was simple:
Deploy a lightweight Python web application that displays a birthday message, package it using Docker, and automate the whole delivery process using a CI/CD pipeline built with GitHub Actions.
Here’s what the mini-project looked like:
• Built a simple Python application using Flask
• Containerized the application with Docker
• Created a CI/CD pipeline using GitHub Actions
• Stored secrets securely (Docker credentials, EC2 host, SSH key) inside GitHub repository secrets
• Automatically built the Docker image and pushed it to Docker Hub
• Deployed the container on an Amazon EC2 instance
• Accessed the Birthday webpage directly from the browser after the pipeline completed
After a few builds and tests, the pipeline ran successfully and the page loaded perfectly. Seeing a personal idea turn into a fully automated deployment was genuinely satisfying.
I actually did something similar last year, but this time I wanted to ensure everything was polished and ready before the birthday arrives. Today was just a quick pipeline run to verify that the code, container, and deployment workflow are all working smoothly.
Key takeaway for anyone who wants to try something similar:
If you'd like to create a fun tech surprise for a friend or loved one, you can simply fork my repository, update your Docker credentials and EC2 details, change the message or image, and run the pipeline. Your own surprise webpage will be live in minutes.
DevOps is usually associated with infrastructure, automation, and production systems. But sometimes it can also be used to create small, memorable moments for people we care about.
Looking forward to seeing his reaction on his birthday.
GitHub Repo: https://t.co/gkWQMkUEGY
For more details : https://t.co/0q4WSxv9et
#DevOps #Docker #GitHubActions #Python #Flask #CloudComputing #CI_CD #BuildInPublic
Designing DevOps Challenges for AI Agents: "My Terminal Bench 2.0 Experience"🚀
(From Errors=1 to Trials=1: "Building a Hard AI-DevOps Task")
"Rejection or Learning"? My Journey with Terminal Bench 2.0 Assessment 👨🏻💻
Today, I submitted my project for a “Design and implement a hard DevOps/SWE task for an AI agent” assessment. The goal? Not to solve a DevOps problem myself—but to create a challenging problem for an AI agent to solve.
The Objective :-
i) The task had to be solvable but difficult.
ii) On 10 runs, a standard LLM agent’s success rate should be > 0.0 but < 0.7.
iii) The AI agent had to demonstrate reasoning, like analyzing logs and resolving circular dependencies—not just file manipulations.
My Workflow :-
1️⃣ Installed UV, Groq, and set up a Python virtual environment. Configured Groq API keys for real-world DevOps interaction.
2️⃣ Used the Harbor default skeleton template and customized it according to my task requirements.
3️⃣ Faced multiple failures: Errors=1, Trials=0, Mean=0.0 repeatedly. I debugged the environment, dependency issues, and container setups until finally achieving Trials=1, Errors=0.
4️⃣ Despite everything, the mean value remained 0.0, meaning my AI agent didn’t fully meet the target success rate.
💡 Key Takeaways :-
1) A rejection doesn’t mean failure—it’s an incredible learning experience.
2) Hands-on experience with AI agents solving DevOps/SWE tasks, managing containers, and debugging runtime environments is priceless.
3) For anyone into AI/ML, DevOps, SWE, SRE, this assessment is a golden opportunity—remote contract for 3 months, and real-world engineering exposure : @BespokeLabs .
Special thanks to Ahmed Riaz , Asad Khaleel , Bespoke Labs for considering me and giving me this chance. 🙏
Even if the results weren’t perfect, the learning and exposure were unmatched! 💪
................................................................
PROJECT WORKFLOW :-
1. Understand the Objective (Before Doing Anything)
i) Your task is not solving a DevOps problem.
ii) Your task is creating a DevOps problem for an AI agent to solve.
iii) Specifically: You must build a Terminal Bench 2.0 task where:
iv) An AI agent interacts with a Linux terminal and tries to solve a difficult DevOps or SWE issue.
Examples of such tasks could include:
1) Fixing a broken Docker build
2) Debugging a failing microservice
3) Resolving dependency conflicts
4) Fixing a CI/CD pipeline
5) Debugging Kubernetes deployment issues
6) Repairing a broken API backend
But the key requirement is: The task must be solvable but difficult.
2. Environment Setup (Exact Commands)
This section must be done before task creation.
Step 1 — Install UV
curl -LsSf https://t.co/2yvNyGVbdg | sh
Restart the shell or run:
source $HOME/.local/bin/env
Step 2 — Initialize Project
Create a working directory:
mkdir terminal-bench-task
cd terminal-bench-task
Run:
uv init
Step 3 — Create Python Environment
uv venv --python 3.12
Activate it:
source .venv/bin/activate
Step 4 — Install Harbor CLI
uv tool install harbor
Verify:
harbor --version
3. LLM API Setup
i) This part is mandatory because the agent needs an LLM backend.
ii) Create an account on Groq console.
iii) Generate an API key.
Then run:
uv pip install groq
Create .env:
touch .env
Add your key:
echo 'GROQ_API_KEY="your_api_key"' > .env
Export it:
export GROQ_API_KEY="your_api_key"
4. Create the Task Skeleton
Now you create the task structure.
Run:
harbor tasks init "abc_xyz"
This generates a task directory.
Example:
abc_xyz/
5. Implement the Required Task Structure
Inside the generated folder you must build this structure:
abc_xyz/
│
├── task.toml
├── instruction.md
│
├── environment/
│ ├── Dockerfile
│ └── app files #We can add more files,if required(in any section)
│
├── solution/
│ ├── https://t.co/RfYbFFJPlF
│ └── scripts
│
└── tests/
├── https://t.co/z8aqAtiWWe
└── test_outputs.py
Now the document specifies exact responsibilities for each file.
6. task.toml Configuration
Inside task.toml you must add:
[environment.runtime]
python = "3.12"
This ensures reproducibility.
7. instruction.md (The AI Prompt)
This file is what the AI agent reads.
You must describe:
i) The system
ii) The problem
iii) The expected outcome
But you must NOT reveal the solution steps.
Example structure:
You are working on a microservice deployment.
The build pipeline is failing due to dependency conflicts.
Your goal is to make the build succeed and ensure the service starts correctly.
8. environment/ (The Broken System)
This directory represents the system the agent must debug.
It may contain:
i) source code
ii) configs
iii) Docker setup
iv) scripts
v) microservices
Inside the Dockerfile (You must include):
COPY * /app/
Everything will be mounted inside /app.
Important rule from the doc(Do NOT include) :
i) solution files
ii) test files
The agent must not see them.
9. solution/ (Golden Solution)
a) This is the human-written correct solution.
b) You implement scripts that fix the problem.
c) Then https://t.co/RfYbFFJPlF must run them.
Example:
solution/
├ fix_dependencies.sh
└ https://t.co/RfYbFFJPlF
https://t.co/RfYbFFJPlF runs:
bash fix_dependencies.sh
This solution is used only for oracle validation.
10. tests/ (Verification)
You must write pytest tests that verify the task was solved.
Example checks:
i) Service runs
ii) API returns correct response
iii) File generated
iv) Build passes
Tests go inside:
tests/test_outputs.py
You must NOT edit:
tests/test.sh
11. Run the Oracle Test
Run this outside the task directory:
harbor run -p "./abc_xyz" -a oracle
What happens:
i) Harbor builds Docker
ii) runs https://t.co/RfYbFFJPlF
iii) executes tests
If tests fail → your environment or solution is broken.
12. Run the AI Agent
Now run the real evaluation.
harbor run -p "./abc_xyz" \
-a terminus-2 \
--model groq/moonshotai/kimi-k2-instruct-0905 \
-k 10 \
-n 10
Explanation:
terminus-2 → the AI terminal agent
model → Groq LLM
k=10 → run the task 10 times
n=10 → concurrent threads
13. Difficulty Requirement
Your task must satisfy: 0 < success_rate < 0.7
Meaning:
i) AI must sometimes solve it
ii) AI must often fail
If success = 100% → too easy If success = 0% → impossible
14. Quality Rules (Important)
The document explicitly requires:
A) Functional Tests
Tests must verify real system behavior.
B) Pinned Versions
Example:
pip install numpy==1.21.0
NOT:
pip install numpy
C) No Cheating
Agent should not find solution by reading files.
D) Test Isolation
Tests must not exist inside the Docker container.
E) Real Errors
If simulating disk/permission problems:
They must actually occur, not fake messages.
15. Submission
Prepare folder: abc_xyz/
Compress: abc_xyz.zip
Upload to: Target Location
... Project Submitted(wait for the RESPONSE FROM the team).
For more detailed Explanations : https://t.co/yAzsZIwjcx
Thank you for your Valuable time, see you in the next one,... 💝
#DevOps #AI #Groq_API_Key #Harbor #UV #SWE #SRE #MachineLearning #TerminalBench #Groq #RemoteWork #CareerGrowth #AI_Agents #BeSpoke_Labs #LLM #Assessment
..
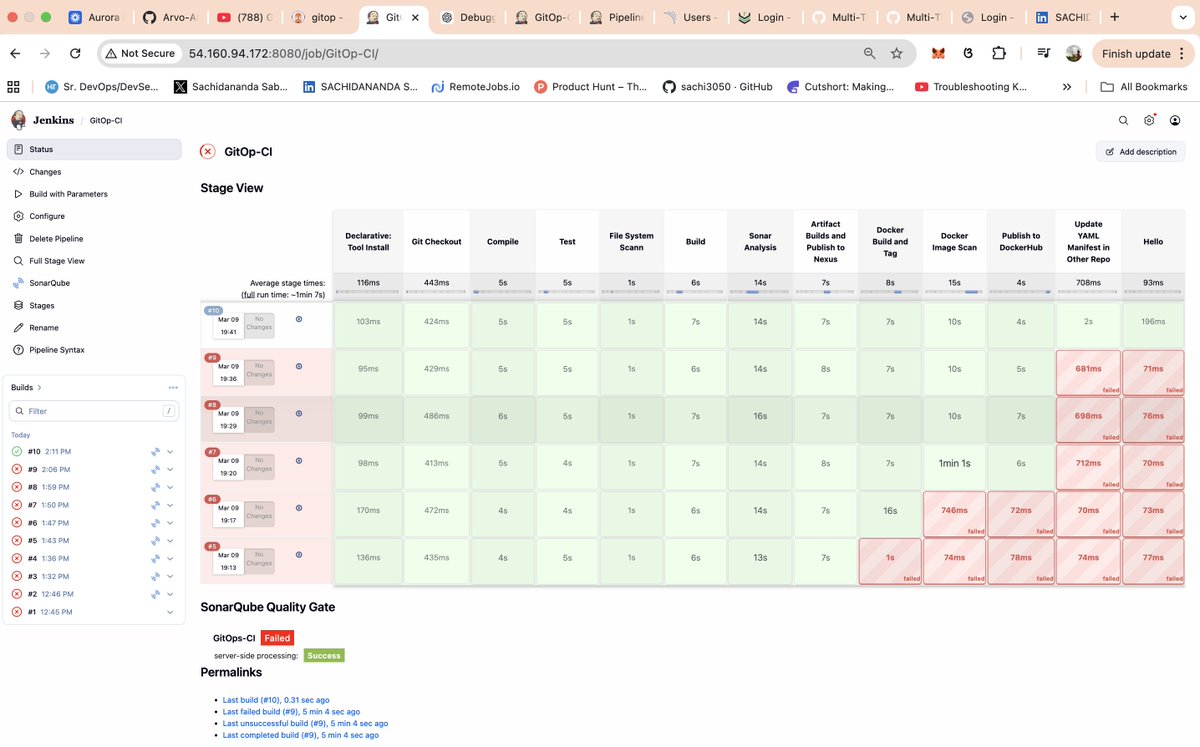
🚀 End-to-End GitOps CI/CD Pipeline with Jenkins, Docker, Kubernetes, and ArgoCD
(👨🏻💻 CI with Jenkins + CD with GitOps: A Modern DevOps Workflow 🤓 🚀)
I recently built a complete GitOps-based CI/CD pipeline for a multi-tier banking application to automate the entire software delivery lifecycle—from code commit to deployment in a Kubernetes cluster.
The goal of this project was to implement a modern DevOps workflow where Continuous Integration is handled by Jenkins and Continuous Deployment follows the GitOps model using ArgoCD.
🔹 CI/CD Pipeline Workflow
The pipeline begins when developers push code to GitHub.
1️⃣ Source Code Checkout
Jenkins pulls the latest code from the repository to start the pipeline.
2️⃣ Compile Stage
The application is compiled using Maven to ensure the code builds successfully.
3️⃣ Test Stage
Automated unit tests are executed to validate the application functionality.
4️⃣ File System Security Scan
Trivy scans the project files to detect potential vulnerabilities or sensitive data.
5️⃣ Build & Package Stage
The application is packaged into a deployable JAR artifact using Maven.
6️⃣ Static Code Analysis (SonarQube)
SonarQube analyzes the code for bugs, vulnerabilities, and maintainability issues to ensure code quality.
7️⃣ Artifact Publishing to Nexus Repository
The generated artifact is stored in Nexus, enabling version control and centralized artifact management.
8️⃣ Docker Image Build & Tagging
The application is containerized into a Docker image with a version tag.
9️⃣ Container Image Security Scan
Trivy scans the Docker image for OS and library vulnerabilities.
🔟 Push Image to DockerHub
The secure Docker image is pushed to DockerHub for distribution.
1️⃣1️⃣ GitOps Repository Update
The pipeline automatically updates the Kubernetes deployment manifest in the CD repository by replacing the image tag with the newly built Docker image version.
⚙ Continuous Deployment using GitOps with ArgoCD
Instead of deploying directly from Jenkins, the project follows the GitOps principle where Git acts as the single source of truth.
The deployment process works as follows:
• ArgoCD continuously monitors the CD Git repository
• When Jenkins updates the Kubernetes manifest with a new image tag
• ArgoCD detects the change in the repository
• Using Auto-Sync, ArgoCD automatically applies the updated manifest to the Kubernetes cluster
• Kubernetes pulls the new Docker image and updates the running application
This approach ensures deployments are declarative, version-controlled, auditable, and fully automated.
🛠 Technologies Used
• GitHub – Source Code Management
• Jenkins – CI Pipeline Automation
• Maven – Build & Dependency Management
• SonarQube – Code Quality Analysis
• Trivy – Security Vulnerability Scanning
• Nexus Repository – Artifact Storage
• Docker – Containerization
• Kubernetes – Container Orchestration
• ArgoCD – GitOps Continuous Deployment
💡 This project demonstrates how combining CI pipelines with GitOps CD creates a scalable and reliable DevOps workflow where infrastructure and deployments are fully automated and managed through Git.
Special Thanks to @devopsshack for the amazing Lecture and Source Code.
Thank you for your time, See you in the next one 🤝.
#DevOps #GitOps #Jenkins #ArgoCD #Docker #Kubernetes #CI_CD #CloudNative #Automation
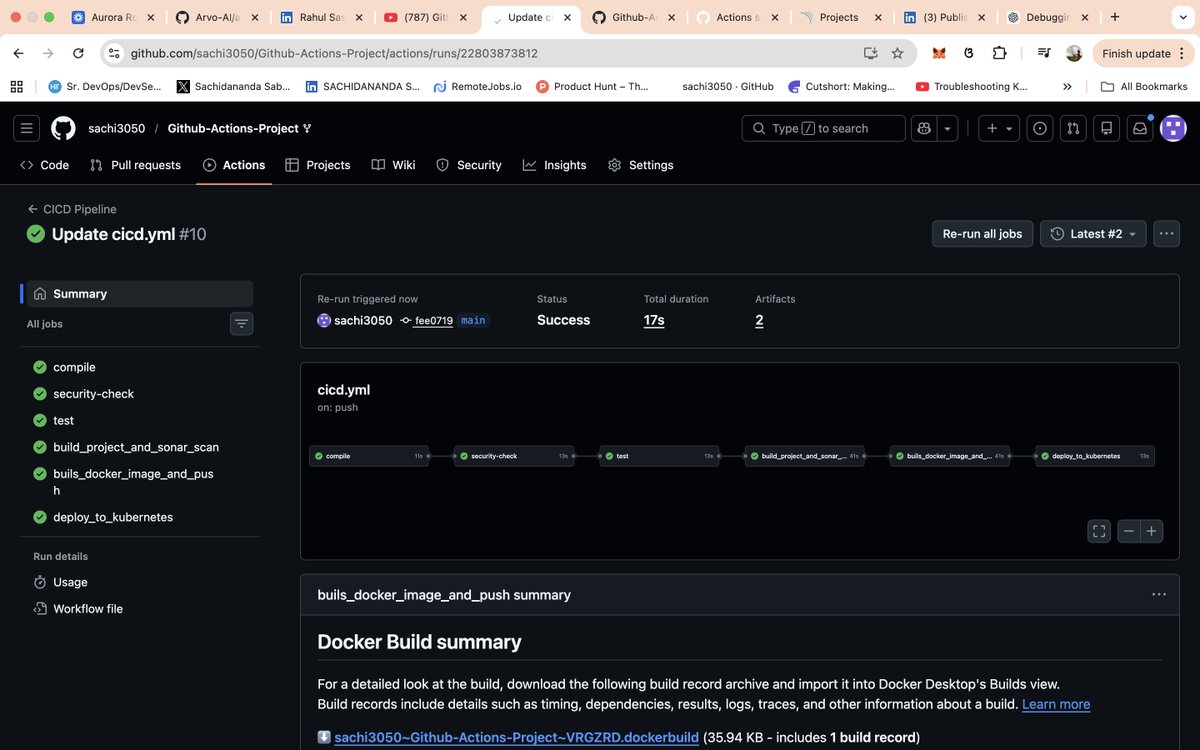
🚀 From Compilation Errors to EKS Deployment: Building a CI/CD Pipeline with GitHub Actions
(7 CI/CD Errors I Faced While Building a GitHub Actions Pipeline (And How I Fixed Them))
Recently, I worked on deploying a Java-based Banking Application using a GitHub Actions Self-Hosted Runner and learned a lot through the process.
Instead of using GitHub hosted runners, I created my own self-hosted runner on a VM, which allowed more control over the environment and tools required for the pipeline.
🔧 CI/CD Workflow Stages
My pipeline includes multiple jobs:
✅ Git Checkout
✅ Maven Setup & Compilation
✅ Unit Testing
✅ SonarQube Code Quality Analysis
✅ Docker Image Build & Push
✅ Deployment to an AWS EKS Cluster
✅ Accessing the application via a Load Balancer in the browser
⚠️ Challenges Faced Along the Way
While setting up the pipeline, I encountered several issues:
• Compilation errors during the build stage
• Maven not installed on the runner machine
• unzip command not found while installing tools
• Invalid project key configuration in SonarQube properties
• AWS region configuration mismatch
• Multiple AWS installations (one on the VM and another inside the workflow)
Each issue helped me understand how CI/CD environments actually work behind the scenes.
For More Detailed Explanations : https://t.co/QsvfUXDRW9
🎯 Key Takeaways
• Proper runner environment setup is critical for self-hosted runners
• Tool dependencies must be installed before workflows run
• Small configuration issues can break automated pipelines
• Debugging CI/CD pipelines improves real DevOps troubleshooting skills
Finally, the application was successfully containerized, pushed to Docker Hub, deployed to EKS, and accessed through a Load Balancer.
This project was a great hands-on experience in GitHub Actions, DevOps pipelines, and Kubernetes deployments.
Special Thanks to @devopsshack for the YT Tutorial and Source Code.
Lecture : https://t.co/v7yOCpL3xM
Source Code : https://t.co/LX4XFexsGc
#DevOps #GitHubActions #SelfHostedRunner #CICD #Docker #Kubernetes #AWS #SonarQube #Java
Linux is free
Docker is free
Kubernetes is free
Git is free
GitHub is free
GitHub Actions is free
GitLab is free
Python is free
Node.js is free
Go is free
PostgreSQL is free
MySQL is free
MongoDB is free
Redis is free
Terraform is free
Ansible is free
Jenkins is free
Prometheus is free
Grafana is free
NGINX is free
Apache is free
VS Code is free
Postman is free
Figma is free
Vercel is free
Netlify is free
AWS is free tier
GCP is free tier
Azure is free tier
ChatGPT is free
Claude is free
Gemini is free
Perplexity is free
Hugging Face is free
Ollama is free
Stable Diffusion is free
TensorFlow is free
PyTorch is free
LangChain is free
What’s stopping you from becoming the greatest engineer?
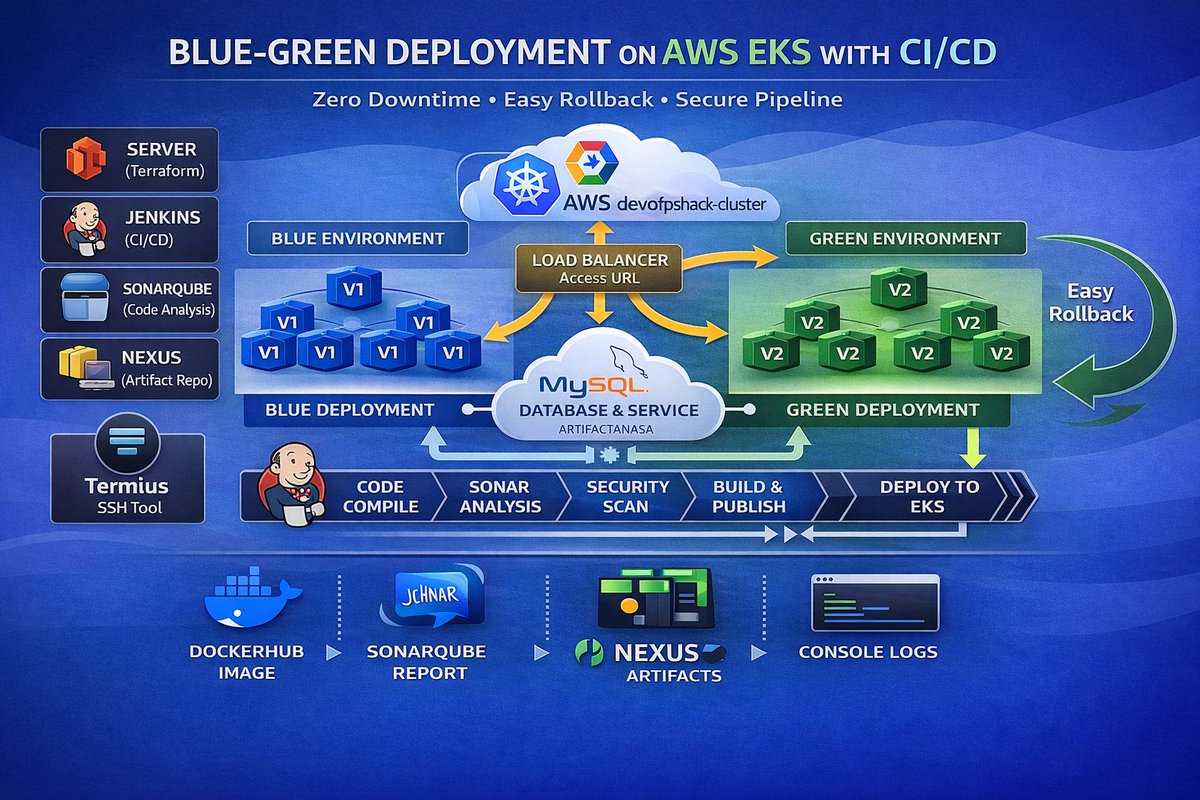
(Zero Downtime ❤️🔥. Instant Rollback 🤩. Real DevOps 🤓)
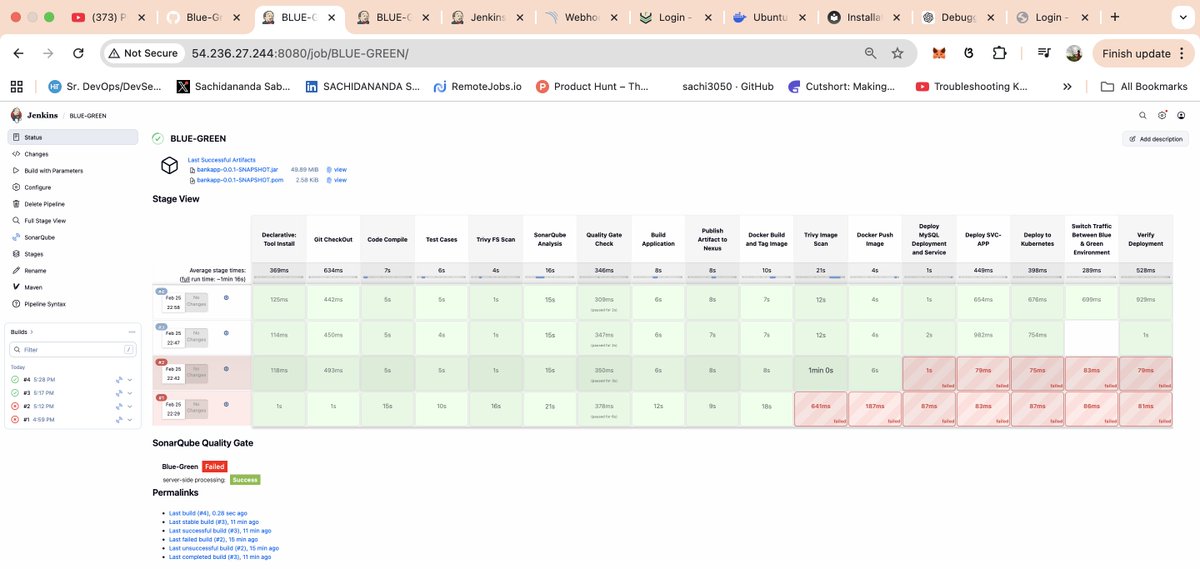
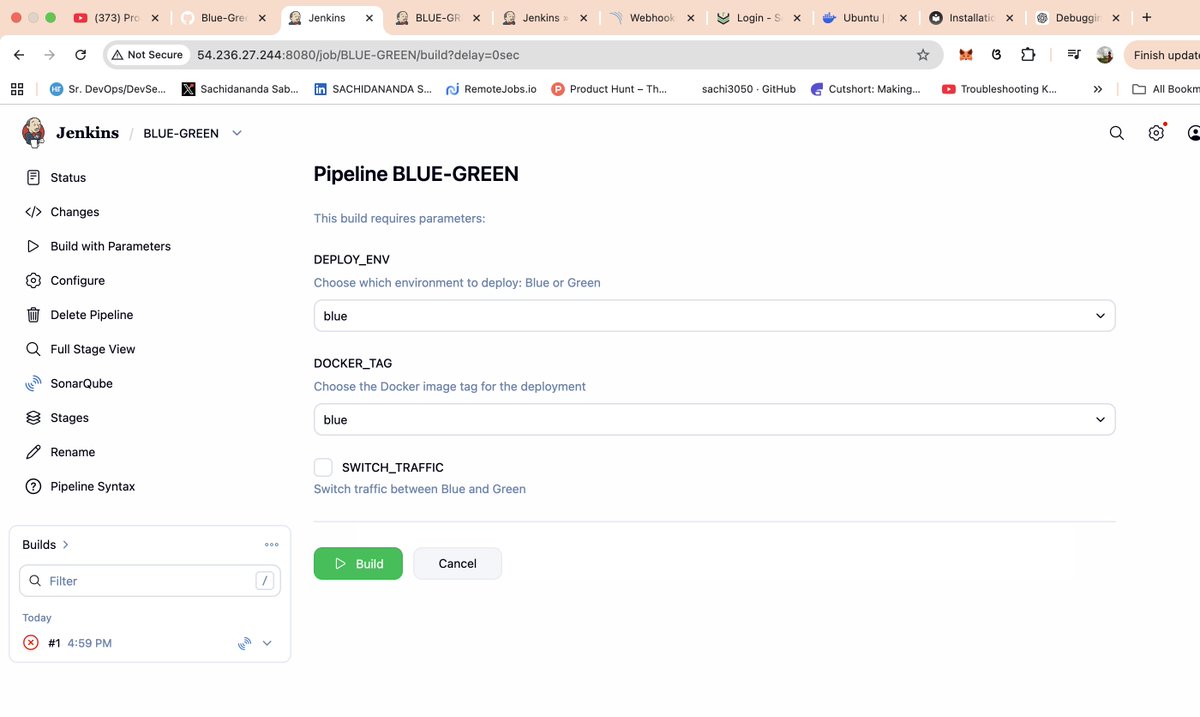
🚀 Parameter-Driven Blue-Green Deployment with Jenkins Pipelines 👨🏻💻
✈️ CI/CD + Security + Blue-Green Deployment: A Complete DevOps Project 🎓
I recently completed a hands-on DevOps project implementing a fully automated Blue-Green Deployment architecture using:
☁️ Amazon Web Services (EC2 + EKS)
⚙️ Terraform for Infrastructure as Code
🔁 Jenkins for CI/CD
🔍 SonarQube for Code Analysis & Quality Gates
📦 Sonatype Nexus Repository for Artifact Management
🐳 Docker for Containerization
☸️ Kubernetes (EKS Cluster)
🔐 Trivy for Security Scanning
🏗 Infrastructure Setup 👨🏻💻
Provisioned 4 EC2 instances:
i) Server – Terraform + EKS cluster creation (devopsshack-cluster)
ii) Jenkins – CI/CD orchestration
iii) SonarQube – Static code analysis & Quality Gate enforcement
iv) Nexus – Artifact repository
Used Termius for secure SSH management across all servers.
🔁 Blue-Green Deployment Strategy 🤓
Core concept:
🗄 MySQL Database + Service → Constant
🌍 LoadBalancer URL → Constant
🚀 Application Environment → Swappable (Blue / Green)
Only the application layer changes. Infrastructure and database remain stable.
I maintained:
4 Kubernetes YAML files
Traffic switching is handled by dynamically patching the Kubernetes Service selector:
kubectl patch service bankapp-service ...
This ensures:
✅ Zero Downtime
✅ Instant Rollback
✅ Safer Production Releases
🔄 Jenkins Pipeline Highlights 👨🏻💻
i) Parameterized Builds (DEPLOY_ENV, DOCKER_TAG, SWITCH_TRAFFIC)
ii) Maven build lifecycle
iii) Trivy file system & image scanning
iv) SonarQube Quality Gate enforcement
v) Artifact publishing to Nexus
vi) Docker build & push to DockerHub
vii) Kubernetes deployment via kubeconfig
viii) Controlled traffic switching
Nothing is hardcoded — everything modular and parameterized.
👀 Visible Outputs 💝
✔ DockerHub image versions
✔ SonarQube analysis dashboard
✔ Nexus artifact repository
✔ Jenkins console logs
✔ EKS cluster pods and services
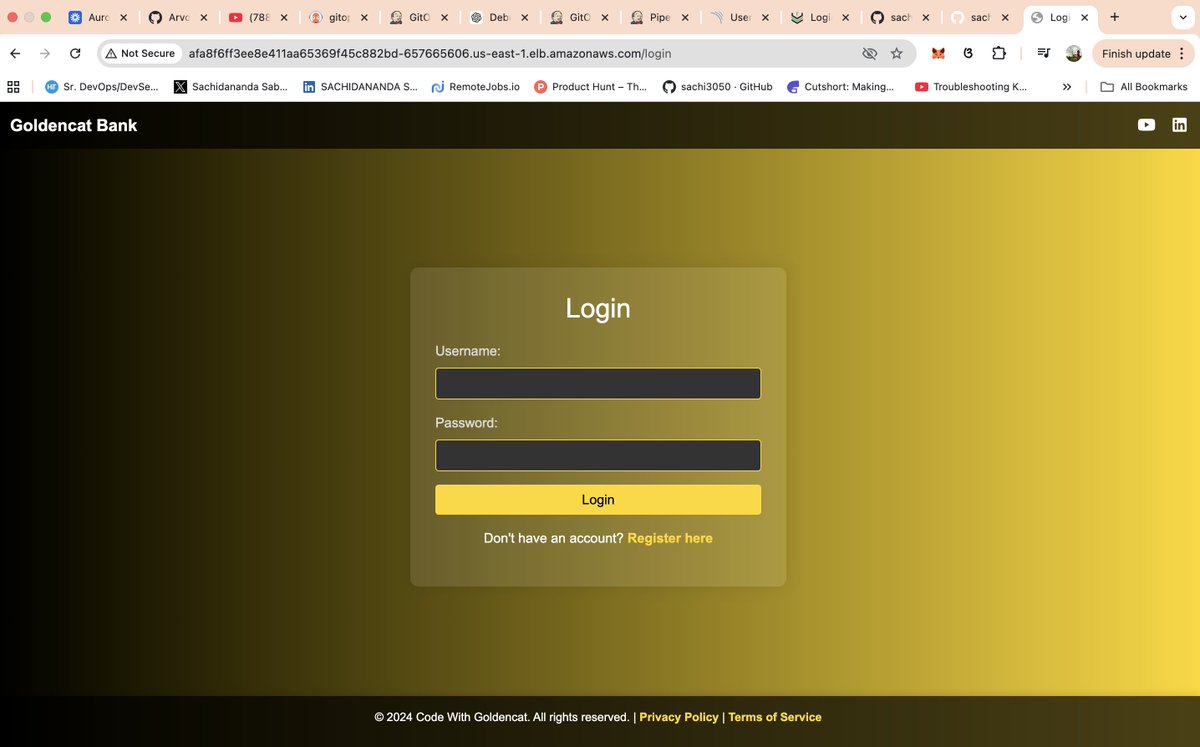
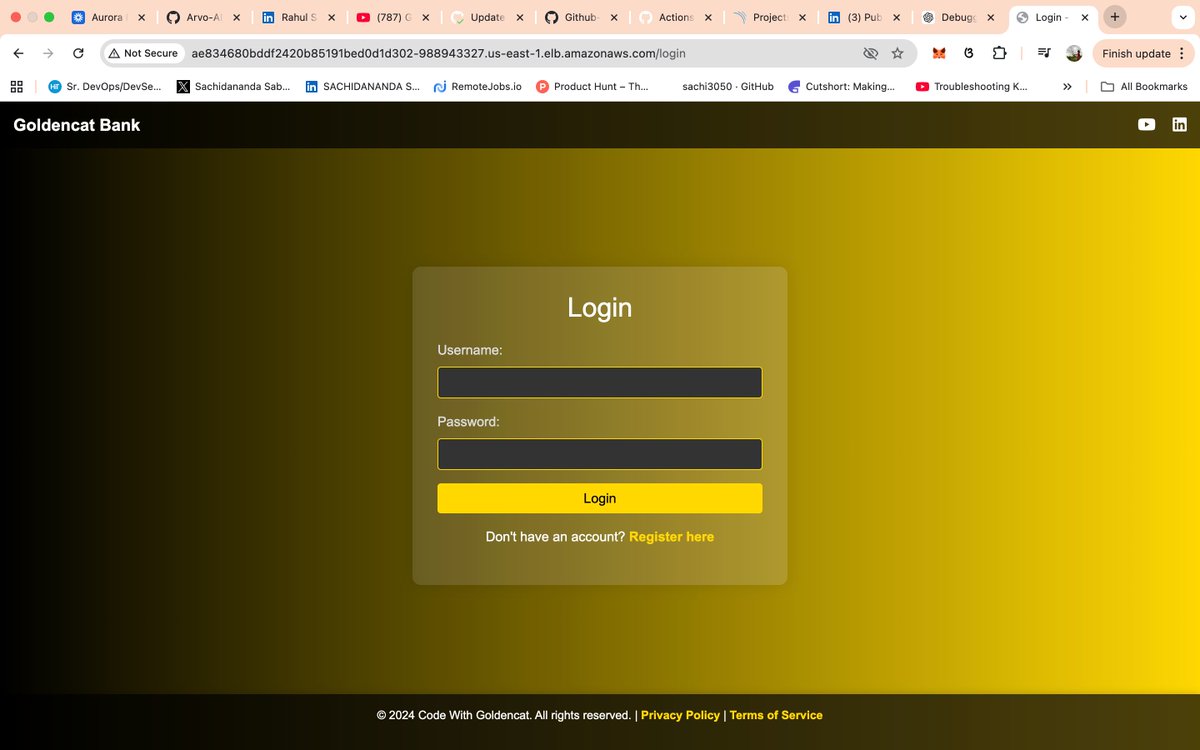
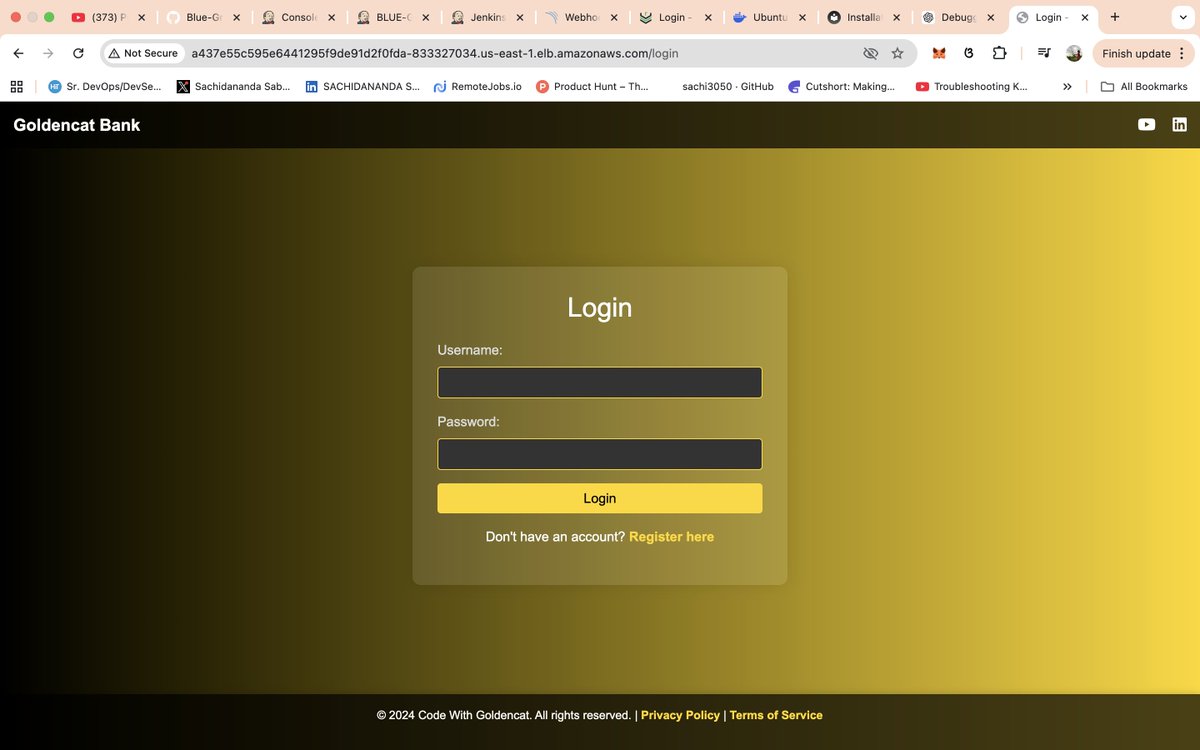
✔ Application is accessible on both the environments
We must not delete the Blue pod which is running in the Blue Environment, why because we may need to revert back to our old environment for any emergency or unwanted/unknown situations and events.
Fun Part 😅 :-
I forgot that, I created the Cluster using Terraform. And I thought it would be kubectl or eksctl or something else.
Jokes Apart : Don't forget to delete the Cluster 💯✌🏻
🎯 Key Learnings 🤓
1) Infrastructure as Code prevents manual drift.
2) Parameterized pipelines enable controlled production releases.
3) Security scanning must be part of CI, not an afterthought.
4) Blue-Green deployment significantly reduces deployment risk.
5) Modular YAML + labels make traffic switching clean and predictable.
This project strengthened my understanding of real-world production deployment strategies and DevSecOps integration.
For more detailed Explanations of this project : https://t.co/4aHLCOH2XP
Special Thanks to @devopsshack for the Insightful Session on Youtube and Source Code.
Youtube : https://t.co/ZrvKbABDvu
GitHub: https://t.co/AQKtsDqEtV
Would love feedback or discussions on production-grade deployment strategies 👇
Thank you for your Time, See you in the next one 🤝
#DevOps #AWS #Kubernetes #EKS #Terraform #Jenkins #BlueGreenDeployment #DevSecOps
Building and Debugging a GPT-Powered DevOps Assistant
(I’ve got architecture, debugging, billing drama, and a bank-visit cliffhanger)
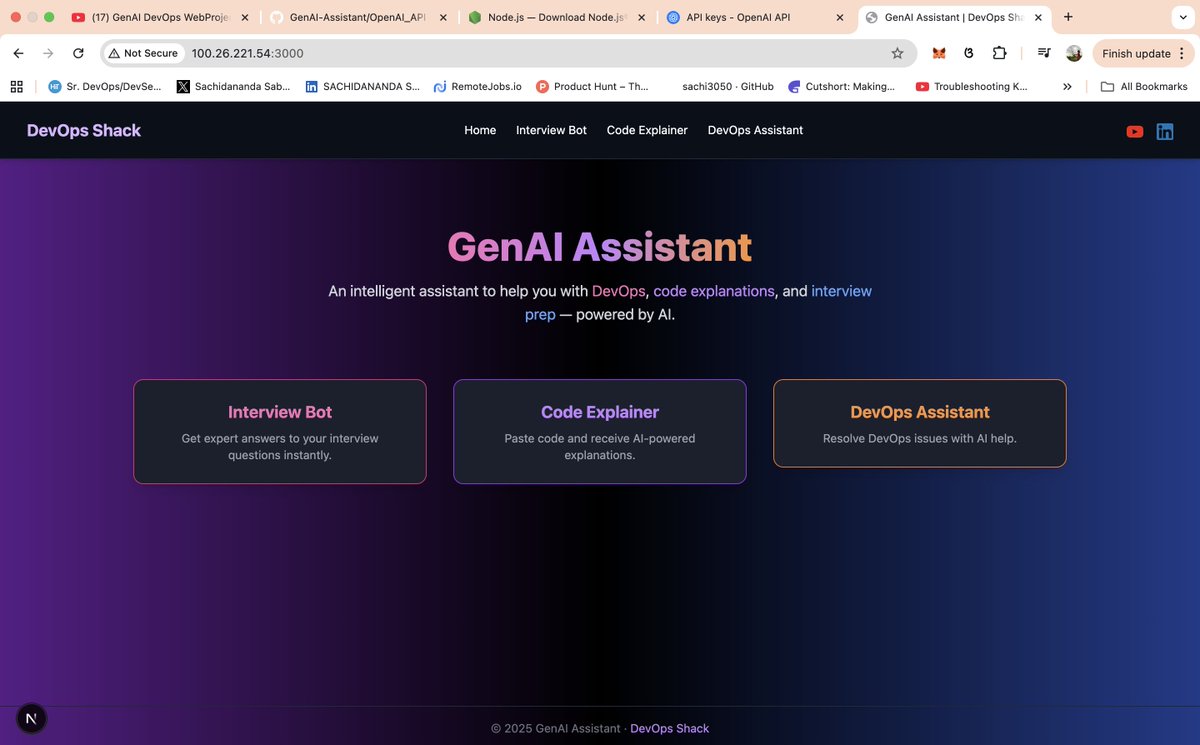
🚀 Deployed My GenAI-Assistant Project (Next.js + Python + GPT LLM)
Excited to share that I successfully deployed my GenAI-Assistant Project inside a Virtual Machine using a Python Virtual Environment (venv).
Big credits to @devopsshack for the amazing lecture and source code guidance 🙌
🏗️ Project Architecture
This project consists of 3 main components:
1️⃣ Frontend – Built using Next.js
2️⃣ Backend – Built using Python (running inside a Virtual Environment)
3️⃣ LLM Model – Powered by OpenAI GPT
🔁 User Request (or Query) Flow:
User → Frontend → Backend (Proxy) → LLM → Backend → Frontend → User
Simple. Clean. Scalable.
💡 Core Features
1) Interview Bot Ask: "How should I prepare and present myself for a DevOps interview?" → Get structured, practical guidance instantly.
2) Code Explainer Paste your code → Get detailed explanations with real-world scenarios.
3) DevOps Assistant Stuck on a DevOps issue? Ask anything related to CI/CD, Docker, Kubernetes, Cloud, etc.
The real magic happens in the PROMPT engineering layer — where we define:
"You're a DevOps Expert. Explain this code in detail with examples and real-world scenarios."
That instruction drives the intelligence behind every response 🧠.
🚀 Deployment Details
i) Frontend & Backend running in the same VM (different sessions)
ii) Backend inside Python VENV
iii) Frontend using npm
iv) Accessed via Public IP on port 3000
v) Ports used: 22 SSH, 3000 Frontend, 8000 Backend
Deployment was successful. Multiple times.
But…
It seems like : Everything is fine. And not in Reality.
🎯 The Real Twist
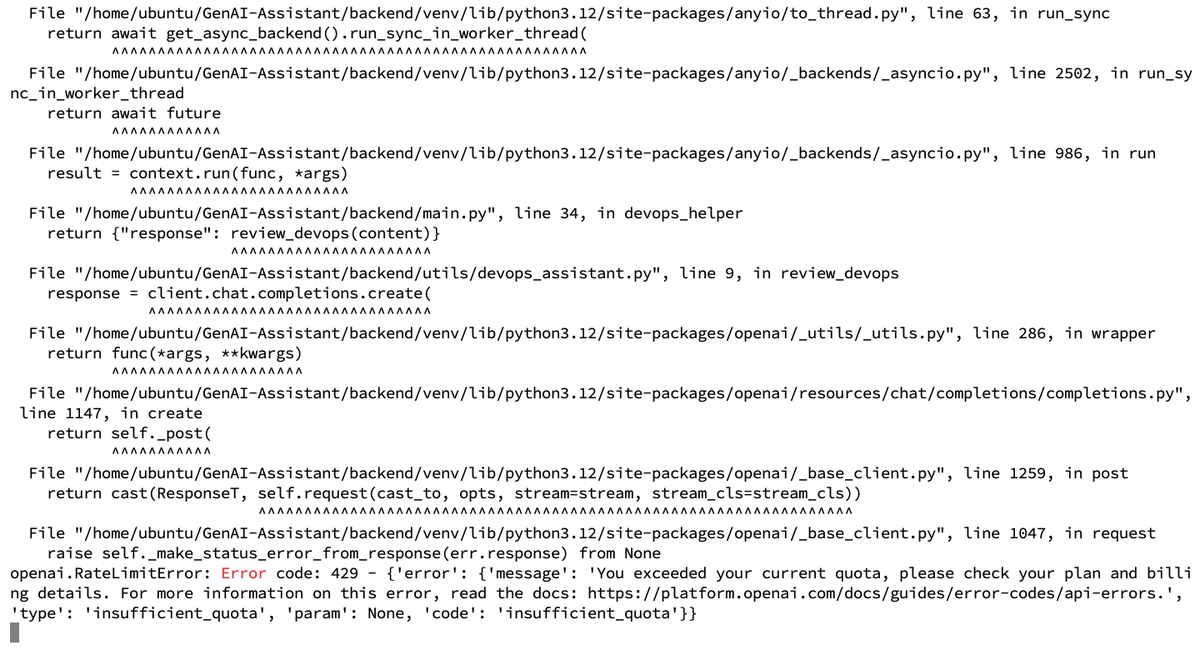
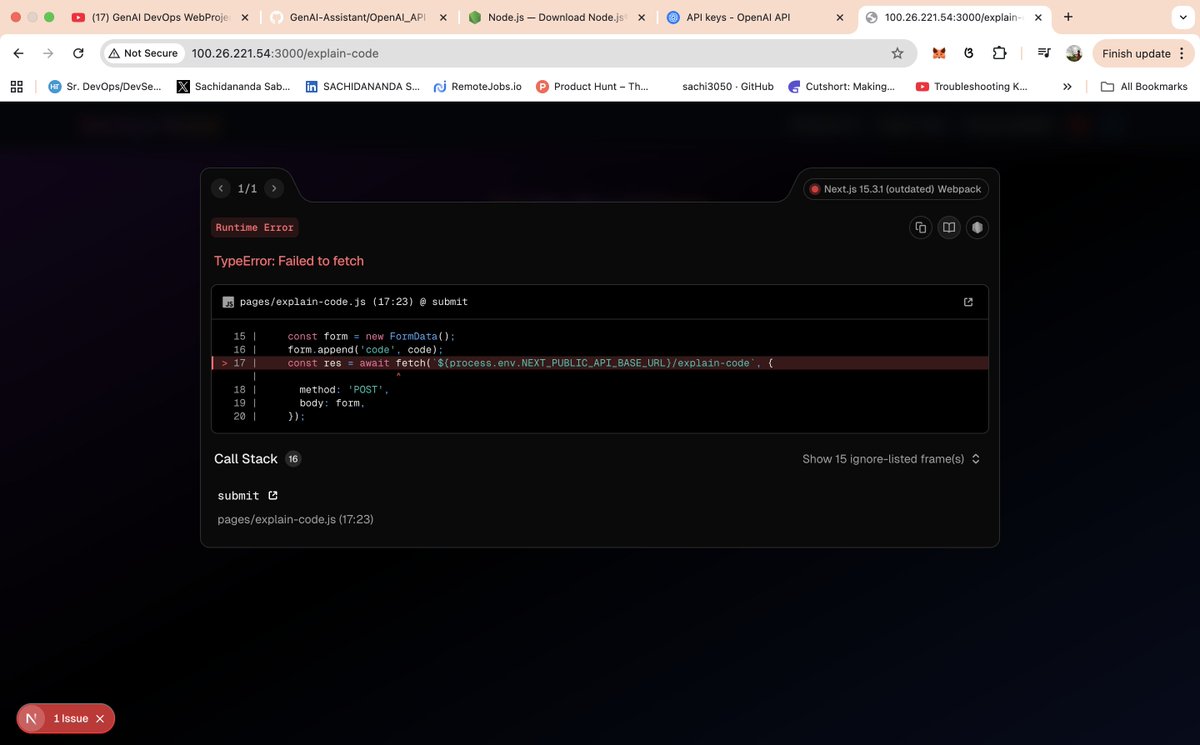
Whenever I asked a query — I kept getting errors.
At first, I thought:
a) Maybe wrong implementation?
b) Maybe missed a configuration?
c) Maybe API routing issue?
After digging deep into frontend & backend logs…
I found the real culprit:
👉 OpenAI Free API usage limit expired.
1) No popup ⛔️.
2) No obvious warning during API key creation ⛔️.
3) The issue was hidden in the Billing Dashboard ⛔️.
Classic production lesson: Not every failure is a code failure 🫡.
Basically, In all the Components where I've used the OpenAI API_KEY : I got the same response back. (Linkedln Post URL provided for more details)
💳 The Unexpected DevOps Challenge
Tried adding billing details.
i) Plot twist: My debit card wasn’t enabled for international transactions 😅
ii) Tried enabling it. Called customer care. Still "Unable to authenticate payment method".
iii) Final solution? Visit bank branch.
Sometimes debugging and Troubleshooting happens in banking systems too 😂😅🙂
🧠 Key Lessons
a) Always check logs before assuming 👨🏻💻.
b) Monitor API usage & billing 😳.
c) Deployment success ≠ Functional success 🤓.
d) DevOps is not just tech — it’s systems thinking 🧠.
🚀 Once billing is sorted, the "Gen-AI Assistant" is fully production-ready 🤩 .
Special thanks again to @devopsshack for the Amazing Lecture and Source Code 🙏.
Lecture : https://t.co/Z6gpxbKfqp
GitHub : https://t.co/2cNeM0Mb3w
See you in the next build. Thanks for your time...
#GenAI #DevOps #OpenAI #NextJS #Python #LLM #LearningInPublic
🚀 Building a GenAI Project with Node.js and Python — DevOps Project (Learning in Public)
(Everything Worked—Except the AI Part 😅)
How a Node.js App Talks to AI: Frontend → Backend → API
I’ve been working on a GenAI-based Node.js application that acts as a personal AI assistant for developers 🤖💻
🧩 Project Architecture
The application is divided into 3 clear layers:
1) Frontend (Node.js) – User interacts with the AI
2) Backend (Python) – Handles logic, request flow, and orchestration
3) API Layer – Powered using OpenAI API key
📌 Request flow:
User → Frontend → Backend → OpenAI API → Backend → Frontend → User
✨ What the App Does
i) Assists with tech-related problems
ii) Explains code and concepts
iii) Helps with troubleshooting
iv) Supports interview preparation
v) Acts as a daily AI assistant for developers
🛠️ Current Status (Real Talk)
I implemented everything step by step by following a tutorial.
✅ Frontend is working
✅ Backend is working
⚠️ The challenge is with API key integration with the backend
At this stage, I believe the issue lies in how the AI-assisted API key is being handled or configured.
It’s not a failure — it’s a clarity gap, and that’s part of building real projects.
Same Result Happened in both the cases of running in Local as well as Dockerizing this application. For more Detailed explanations : https://t.co/TBg6Vl2NYs
GitHub_Repo : https://t.co/2cNeM0Mb3w
🔍 What’s Next
a) Deep-diving into the source code
b) Understanding OpenAI API key handling in detail
c) Fixing the root cause and shipping the working version
I didn’t give up.
I’ll be back with the successful update soon 🚀
Always open to feedback, suggestions, and discussions.
Thanking you for your valuable time, See you soon 🤝...
#LearningInPublic #GenAI #NodeJS #OpenAI #AIEngineering #BackendDevelopment #FullStack #DevOpsMindset
🤓 DevOps Monitoring That Talks Back 🫣🫣
🚀 Prometheus + AlertManager + BlackBox Exporter : A Real-Time Monitoring Setup
(Break It ❤️🔥. Monitor It👨🏻💻. Alert It 😳. Fix It 🤓. — Real-World DevOps in Action🤩)
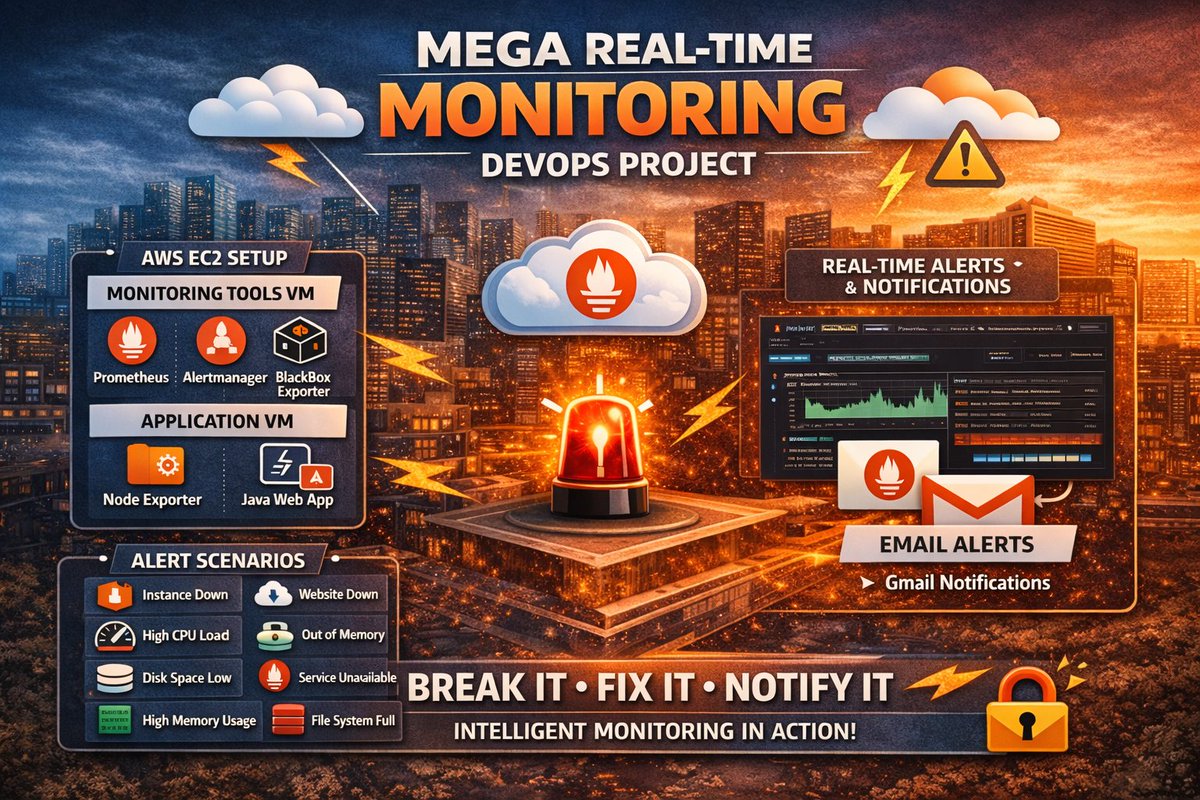
🚀 Ultimate MEGA Real-Time Monitoring DevOps Project | Prometheus, Alert_Manager, Blackbox, Node Exporter
Recently, I completed an end-to-end, real-time monitoring DevOps project where the focus was not just monitoring, but actionable alerts + intelligent notifications.
🔍 Project Overview
The goal was simple but powerful:
👉 Monitor instances, services, and websites
👉 Get real-time alerts
👉 Receive customized email notifications only when it actually matters
🏗️ Architecture Setup
1) Created 2 AWS EC2 VMs
i) Monitoring Tools VM
ii) Application VM
2) Connected via Termius (SSH)
⚙️ What I Implemented
On Application VM
a) Installed & configured Node Exporter
b) Ran a Java-based Web Application directly using Maven
On Monitoring Tools VM
Installed & configured :-
a) Prometheus
b) Alertmanager
c) Blackbox Exporter
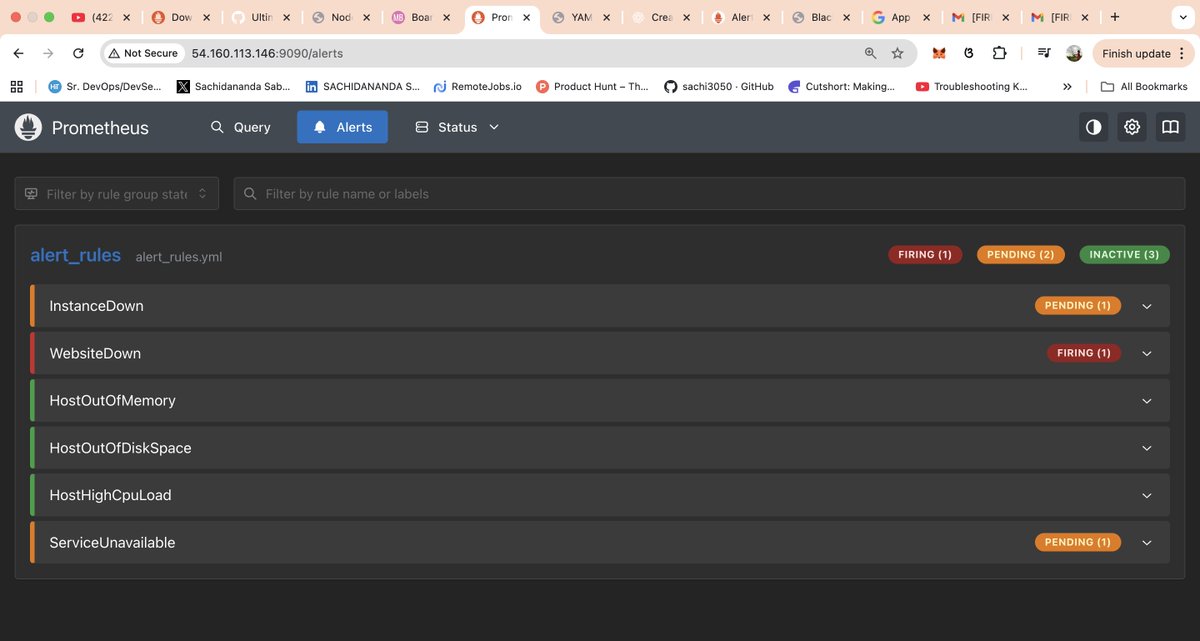
📊 Monitoring & Alert Scenarios Implemented
Configured alert rules for real-world failure scenarios :-
1️⃣ Instance Down
2️⃣ Website Down
3️⃣ Host Out of Memory
4️⃣ Host Out of Disk Space
5️⃣ High CPU Load
6️⃣ Service Unavailable
7️⃣ High Memory Usage
8️⃣ File System Full
🚨 Real-Time Testing (The Best Part!)
I intentionally broke things :-
1) Crashed services
2) Took websites down
3) Stopped Node Exporter
➡️ Alerts immediately reflected on Prometheus
➡️ Email notifications triggered automatically
➡️ Alerts stopped once services recovered
🎯 Why This Matters
Not every failure deserves panic.
This project proves how we can :-
i) Avoid false alerts
ii) Trigger notifications only after a defined duration
iii) Customize alerting behavior based on severity, time, and conditions
For Gmail alerts, I used Google App Password Manager, ensuring secure and automated notifications.
📸 Proof of work included via screenshots
For More Clarity and Detailed Explanations : https://t.co/5qwnIjCWmZ
YouTube Lecture : https://t.co/TR78alOUE7
GitHub and Docs : https://t.co/OBnC3SUv88
Always open to :-
💬 Suggestions
💡 Feedback
🤝 Discussions
Special thanks to @devopsshack for the amazing brainstorming session and documentation support 🙌
Thank you for your Valuable Time 🤝
Let’s keep building and learning in public 🚀
#LearningInPublic #DevOps #Monitoring #Prometheus #Alertmanager #BlackboxExporter #NodeExporter #AWS #EC2 #SRE #Observability #CloudEngineering #Java
DevOps isn’t just DevOps anymore. It has become the foundation for entire specializations.
MLOps → DevOps for ML models
Deploy, monitor, and manage machine learning pipelines at scale.
DevSecOps → DevOps with security-first mindset
Shift left. Security isn’t a gate anymore, it’s part of the pipeline.
FinOps → DevOps for cloud costs
Optimize spending while maintaining performance. Make finance and engineering work together.
AIOps → DevOps powered by AI
Use AI/ML to predict incidents, automate responses, and reduce MTTR.
DataOps → DevOps for data pipelines
Bring CI/CD practices to data engineering and analytics.
GitOps → DevOps driven by Git
Infrastructure and deployments managed entirely through Git workflows.
Platform Engineering → DevOps meets product thinking
Build internal developer platforms that abstract complexity.
These aren’t separate careers. They’re extensions of what good DevOps engineers already do.
Learn the fundamentals deeply. The specializations will make sense when you need them.
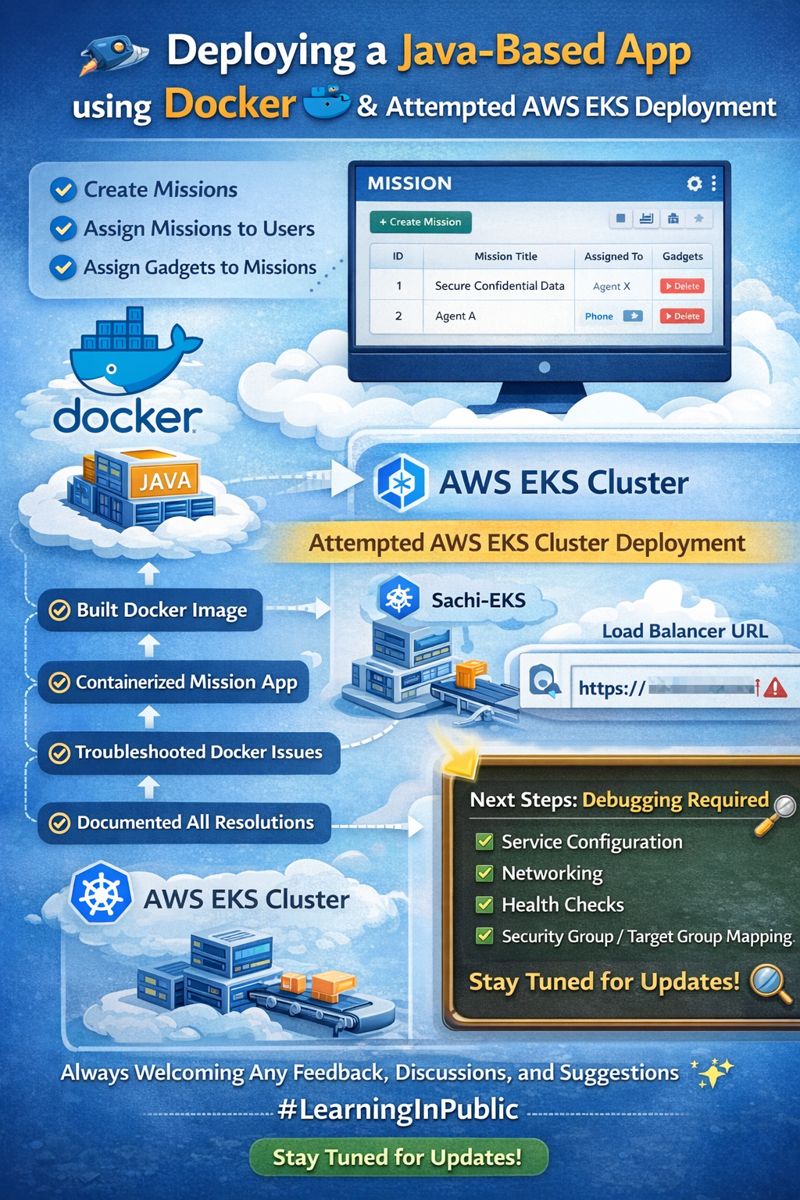
🚀Turning Code Into Containers 🤓: My DevOps Deployment Journey with Docker 👨🏻💻
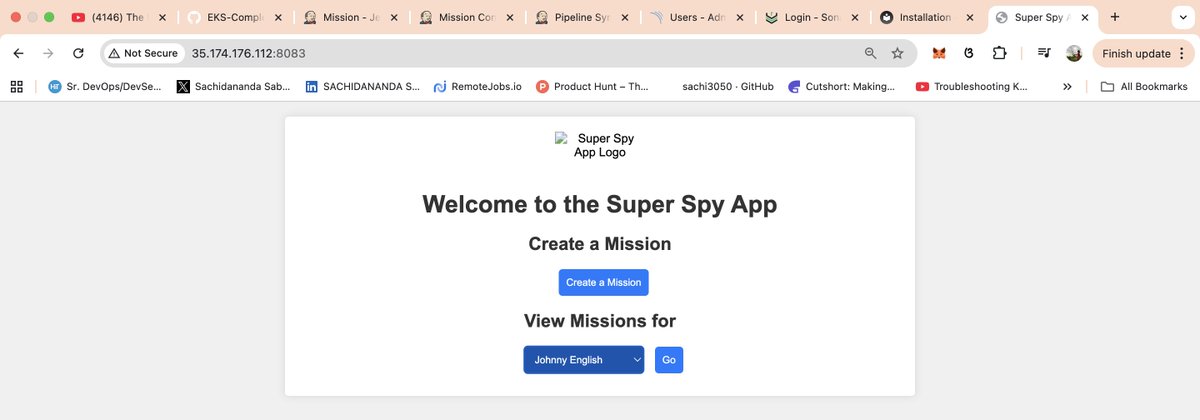
Deploying Java Mission App using Docker + EKS Attempt 🚀
Just completed deploying a Java-based application called "Mission" using Docker as part of my DevOps hands-on learning journey.
#LearningInPublic
🧩 Mission App Features:
✅ Create Missions
✅ Assign Missions to users
✅ Assign Gadgets to Missions
✅ Simple & Clean UI
🐳 What I Did Using Docker:
i) Built Docker Image
ii) Containerized the Java App
iii) Ran & Tested Application
iv) Troubleshot build/runtime issues
v) Documented resolutions via screenshots
☸️ Kubernetes Attempt :-
I also tried deploying the app into my AWS EKS cluster:
👉 Cluster Name: Sachi-EKS
👉 Integrated with CI/CD pipeline
✔ Load Balancer URL generated successfully
❌ Application currently shows Unreachable
Seems like debugging is required around:
• Service configuration
• Networking
• Health checks
• Possibly security group / target group mapping
The Docker deployment is working successfully for now ✅
Will soon debug the EKS deployment and share updates in the next post.
Special thanks to @devopsshack for the amazing tutorials, source code, and documentation 🙌
Always open to:
💬 Feedback
💬 Suggestions
💬 Debugging ideas
💬 Discussions
Let’s grow together 🚀
#DevOps #Docker #AWS #EKS #Kubernetes #Cloud #CICD #Java #LearningInPublic
..
1️⃣ Participation Announcement
🚀 Joining the hackathon: **The UI Strikes Back** ⚡
Building generative UI apps where AI doesn’t just talk —
it **creates & interacts with UI components** 🤯
Powered by @tambo_ai × @WeMakeDevs
Let the rebellion begin 👾
#TheUIStrikesBack #TamboSDK #Hackathon #GenerativeUI #React
2️⃣ Repo Star + Visibility
⭐ Just starred the @tambo_ai repo!
This hackathon is about redefining how UIs are built:
🧠 Natural language → 🧩 Live React components
Excited to explore generative + interactive UI patterns.
May the components be with us 🛸
#TheUIStrikesBack #OpenSource #DevCommunity
3️⃣
7 days.
Infinite UI possibilities.
From dashboards to chat-based app builders —
AI is no longer behind the UI, it *is* the UI.
Hackathon: The UI Strikes Back
Let’s ship something unforgettable 🚀
#TheUIStrikesBack #BuildInPublic #AIUX #React
Building in public, learning fast.
Generative UI is the future 🔮
Powered by @tambo_ai






![Snsbr2004Sabar's tweet photo. Designing DevOps Challenges for AI Agents: "My Terminal Bench 2.0 Experience"🚀
(From Errors=1 to Trials=1: "Building a Hard AI-DevOps Task")
"Rejection or Learning"? My Journey with Terminal Bench 2.0 Assessment 👨🏻💻
Today, I submitted my project for a “Design and implement a hard DevOps/SWE task for an AI agent” assessment. The goal? Not to solve a DevOps problem myself—but to create a challenging problem for an AI agent to solve.
The Objective :-
i) The task had to be solvable but difficult.
ii) On 10 runs, a standard LLM agent’s success rate should be > 0.0 but < 0.7.
iii) The AI agent had to demonstrate reasoning, like analyzing logs and resolving circular dependencies—not just file manipulations.
My Workflow :-
1️⃣ Installed UV, Groq, and set up a Python virtual environment. Configured Groq API keys for real-world DevOps interaction.
2️⃣ Used the Harbor default skeleton template and customized it according to my task requirements.
3️⃣ Faced multiple failures: Errors=1, Trials=0, Mean=0.0 repeatedly. I debugged the environment, dependency issues, and container setups until finally achieving Trials=1, Errors=0.
4️⃣ Despite everything, the mean value remained 0.0, meaning my AI agent didn’t fully meet the target success rate.
💡 Key Takeaways :-
1) A rejection doesn’t mean failure—it’s an incredible learning experience.
2) Hands-on experience with AI agents solving DevOps/SWE tasks, managing containers, and debugging runtime environments is priceless.
3) For anyone into AI/ML, DevOps, SWE, SRE, this assessment is a golden opportunity—remote contract for 3 months, and real-world engineering exposure : @BespokeLabs .
Special thanks to Ahmed Riaz , Asad Khaleel , Bespoke Labs for considering me and giving me this chance. 🙏
Even if the results weren’t perfect, the learning and exposure were unmatched! 💪
................................................................
PROJECT WORKFLOW :-
1. Understand the Objective (Before Doing Anything)
i) Your task is not solving a DevOps problem.
ii) Your task is creating a DevOps problem for an AI agent to solve.
iii) Specifically: You must build a Terminal Bench 2.0 task where:
iv) An AI agent interacts with a Linux terminal and tries to solve a difficult DevOps or SWE issue.
Examples of such tasks could include:
1) Fixing a broken Docker build
2) Debugging a failing microservice
3) Resolving dependency conflicts
4) Fixing a CI/CD pipeline
5) Debugging Kubernetes deployment issues
6) Repairing a broken API backend
But the key requirement is: The task must be solvable but difficult.
2. Environment Setup (Exact Commands)
This section must be done before task creation.
Step 1 — Install UV
curl -LsSf https://t.co/2yvNyGVbdg | sh
Restart the shell or run:
source $HOME/.local/bin/env
Step 2 — Initialize Project
Create a working directory:
mkdir terminal-bench-task
cd terminal-bench-task
Run:
uv init
Step 3 — Create Python Environment
uv venv --python 3.12
Activate it:
source .venv/bin/activate
Step 4 — Install Harbor CLI
uv tool install harbor
Verify:
harbor --version
3. LLM API Setup
i) This part is mandatory because the agent needs an LLM backend.
ii) Create an account on Groq console.
iii) Generate an API key.
Then run:
uv pip install groq
Create .env:
touch .env
Add your key:
echo 'GROQ_API_KEY="your_api_key"' > .env
Export it:
export GROQ_API_KEY="your_api_key"
4. Create the Task Skeleton
Now you create the task structure.
Run:
harbor tasks init "abc_xyz"
This generates a task directory.
Example:
abc_xyz/
5. Implement the Required Task Structure
Inside the generated folder you must build this structure:
abc_xyz/
│
├── task.toml
├── instruction.md
│
├── environment/
│ ├── Dockerfile
│ └── app files #We can add more files,if required(in any section)
│
├── solution/
│ ├── https://t.co/RfYbFFJPlF
│ └── scripts
│
└── tests/
├── https://t.co/z8aqAtiWWe
└── test_outputs.py
Now the document specifies exact responsibilities for each file.
6. task.toml Configuration
Inside task.toml you must add:
[environment.runtime]
python = "3.12"
This ensures reproducibility.
7. instruction.md (The AI Prompt)
This file is what the AI agent reads.
You must describe:
i) The system
ii) The problem
iii) The expected outcome
But you must NOT reveal the solution steps.
Example structure:
You are working on a microservice deployment.
The build pipeline is failing due to dependency conflicts.
Your goal is to make the build succeed and ensure the service starts correctly.
8. environment/ (The Broken System)
This directory represents the system the agent must debug.
It may contain:
i) source code
ii) configs
iii) Docker setup
iv) scripts
v) microservices
Inside the Dockerfile (You must include):
COPY * /app/
Everything will be mounted inside /app.
Important rule from the doc(Do NOT include) :
i) solution files
ii) test files
The agent must not see them.
9. solution/ (Golden Solution)
a) This is the human-written correct solution.
b) You implement scripts that fix the problem.
c) Then https://t.co/RfYbFFJPlF must run them.
Example:
solution/
├ fix_dependencies.sh
└ https://t.co/RfYbFFJPlF
https://t.co/RfYbFFJPlF runs:
bash fix_dependencies.sh
This solution is used only for oracle validation.
10. tests/ (Verification)
You must write pytest tests that verify the task was solved.
Example checks:
i) Service runs
ii) API returns correct response
iii) File generated
iv) Build passes
Tests go inside:
tests/test_outputs.py
You must NOT edit:
tests/test.sh
11. Run the Oracle Test
Run this outside the task directory:
harbor run -p "./abc_xyz" -a oracle
What happens:
i) Harbor builds Docker
ii) runs https://t.co/RfYbFFJPlF
iii) executes tests
If tests fail → your environment or solution is broken.
12. Run the AI Agent
Now run the real evaluation.
harbor run -p "./abc_xyz" \
-a terminus-2 \
--model groq/moonshotai/kimi-k2-instruct-0905 \
-k 10 \
-n 10
Explanation:
terminus-2 → the AI terminal agent
model → Groq LLM
k=10 → run the task 10 times
n=10 → concurrent threads
13. Difficulty Requirement
Your task must satisfy: 0 < success_rate < 0.7
Meaning:
i) AI must sometimes solve it
ii) AI must often fail
If success = 100% → too easy If success = 0% → impossible
14. Quality Rules (Important)
The document explicitly requires:
A) Functional Tests
Tests must verify real system behavior.
B) Pinned Versions
Example:
pip install numpy==1.21.0
NOT:
pip install numpy
C) No Cheating
Agent should not find solution by reading files.
D) Test Isolation
Tests must not exist inside the Docker container.
E) Real Errors
If simulating disk/permission problems:
They must actually occur, not fake messages.
15. Submission
Prepare folder: abc_xyz/
Compress: abc_xyz.zip
Upload to: Target Location
... Project Submitted(wait for the RESPONSE FROM the team).
For more detailed Explanations : https://t.co/yAzsZIwjcx
Thank you for your Valuable time, see you in the next one,... 💝
#DevOps #AI #Groq_API_Key #Harbor #UV #SWE #SRE #MachineLearning #TerminalBench #Groq #RemoteWork #CareerGrowth #AI_Agents #BeSpoke_Labs #LLM #Assessment
..](https://pbs.twimg.com/media/HDJtAdcb0AEL5JN.jpg)
![Snsbr2004Sabar's tweet photo. Designing DevOps Challenges for AI Agents: "My Terminal Bench 2.0 Experience"🚀
(From Errors=1 to Trials=1: "Building a Hard AI-DevOps Task")
"Rejection or Learning"? My Journey with Terminal Bench 2.0 Assessment 👨🏻💻
Today, I submitted my project for a “Design and implement a hard DevOps/SWE task for an AI agent” assessment. The goal? Not to solve a DevOps problem myself—but to create a challenging problem for an AI agent to solve.
The Objective :-
i) The task had to be solvable but difficult.
ii) On 10 runs, a standard LLM agent’s success rate should be > 0.0 but < 0.7.
iii) The AI agent had to demonstrate reasoning, like analyzing logs and resolving circular dependencies—not just file manipulations.
My Workflow :-
1️⃣ Installed UV, Groq, and set up a Python virtual environment. Configured Groq API keys for real-world DevOps interaction.
2️⃣ Used the Harbor default skeleton template and customized it according to my task requirements.
3️⃣ Faced multiple failures: Errors=1, Trials=0, Mean=0.0 repeatedly. I debugged the environment, dependency issues, and container setups until finally achieving Trials=1, Errors=0.
4️⃣ Despite everything, the mean value remained 0.0, meaning my AI agent didn’t fully meet the target success rate.
💡 Key Takeaways :-
1) A rejection doesn’t mean failure—it’s an incredible learning experience.
2) Hands-on experience with AI agents solving DevOps/SWE tasks, managing containers, and debugging runtime environments is priceless.
3) For anyone into AI/ML, DevOps, SWE, SRE, this assessment is a golden opportunity—remote contract for 3 months, and real-world engineering exposure : @BespokeLabs .
Special thanks to Ahmed Riaz , Asad Khaleel , Bespoke Labs for considering me and giving me this chance. 🙏
Even if the results weren’t perfect, the learning and exposure were unmatched! 💪
................................................................
PROJECT WORKFLOW :-
1. Understand the Objective (Before Doing Anything)
i) Your task is not solving a DevOps problem.
ii) Your task is creating a DevOps problem for an AI agent to solve.
iii) Specifically: You must build a Terminal Bench 2.0 task where:
iv) An AI agent interacts with a Linux terminal and tries to solve a difficult DevOps or SWE issue.
Examples of such tasks could include:
1) Fixing a broken Docker build
2) Debugging a failing microservice
3) Resolving dependency conflicts
4) Fixing a CI/CD pipeline
5) Debugging Kubernetes deployment issues
6) Repairing a broken API backend
But the key requirement is: The task must be solvable but difficult.
2. Environment Setup (Exact Commands)
This section must be done before task creation.
Step 1 — Install UV
curl -LsSf https://t.co/2yvNyGVbdg | sh
Restart the shell or run:
source $HOME/.local/bin/env
Step 2 — Initialize Project
Create a working directory:
mkdir terminal-bench-task
cd terminal-bench-task
Run:
uv init
Step 3 — Create Python Environment
uv venv --python 3.12
Activate it:
source .venv/bin/activate
Step 4 — Install Harbor CLI
uv tool install harbor
Verify:
harbor --version
3. LLM API Setup
i) This part is mandatory because the agent needs an LLM backend.
ii) Create an account on Groq console.
iii) Generate an API key.
Then run:
uv pip install groq
Create .env:
touch .env
Add your key:
echo 'GROQ_API_KEY="your_api_key"' > .env
Export it:
export GROQ_API_KEY="your_api_key"
4. Create the Task Skeleton
Now you create the task structure.
Run:
harbor tasks init "abc_xyz"
This generates a task directory.
Example:
abc_xyz/
5. Implement the Required Task Structure
Inside the generated folder you must build this structure:
abc_xyz/
│
├── task.toml
├── instruction.md
│
├── environment/
│ ├── Dockerfile
│ └── app files #We can add more files,if required(in any section)
│
├── solution/
│ ├── https://t.co/RfYbFFJPlF
│ └── scripts
│
└── tests/
├── https://t.co/z8aqAtiWWe
└── test_outputs.py
Now the document specifies exact responsibilities for each file.
6. task.toml Configuration
Inside task.toml you must add:
[environment.runtime]
python = "3.12"
This ensures reproducibility.
7. instruction.md (The AI Prompt)
This file is what the AI agent reads.
You must describe:
i) The system
ii) The problem
iii) The expected outcome
But you must NOT reveal the solution steps.
Example structure:
You are working on a microservice deployment.
The build pipeline is failing due to dependency conflicts.
Your goal is to make the build succeed and ensure the service starts correctly.
8. environment/ (The Broken System)
This directory represents the system the agent must debug.
It may contain:
i) source code
ii) configs
iii) Docker setup
iv) scripts
v) microservices
Inside the Dockerfile (You must include):
COPY * /app/
Everything will be mounted inside /app.
Important rule from the doc(Do NOT include) :
i) solution files
ii) test files
The agent must not see them.
9. solution/ (Golden Solution)
a) This is the human-written correct solution.
b) You implement scripts that fix the problem.
c) Then https://t.co/RfYbFFJPlF must run them.
Example:
solution/
├ fix_dependencies.sh
└ https://t.co/RfYbFFJPlF
https://t.co/RfYbFFJPlF runs:
bash fix_dependencies.sh
This solution is used only for oracle validation.
10. tests/ (Verification)
You must write pytest tests that verify the task was solved.
Example checks:
i) Service runs
ii) API returns correct response
iii) File generated
iv) Build passes
Tests go inside:
tests/test_outputs.py
You must NOT edit:
tests/test.sh
11. Run the Oracle Test
Run this outside the task directory:
harbor run -p "./abc_xyz" -a oracle
What happens:
i) Harbor builds Docker
ii) runs https://t.co/RfYbFFJPlF
iii) executes tests
If tests fail → your environment or solution is broken.
12. Run the AI Agent
Now run the real evaluation.
harbor run -p "./abc_xyz" \
-a terminus-2 \
--model groq/moonshotai/kimi-k2-instruct-0905 \
-k 10 \
-n 10
Explanation:
terminus-2 → the AI terminal agent
model → Groq LLM
k=10 → run the task 10 times
n=10 → concurrent threads
13. Difficulty Requirement
Your task must satisfy: 0 < success_rate < 0.7
Meaning:
i) AI must sometimes solve it
ii) AI must often fail
If success = 100% → too easy If success = 0% → impossible
14. Quality Rules (Important)
The document explicitly requires:
A) Functional Tests
Tests must verify real system behavior.
B) Pinned Versions
Example:
pip install numpy==1.21.0
NOT:
pip install numpy
C) No Cheating
Agent should not find solution by reading files.
D) Test Isolation
Tests must not exist inside the Docker container.
E) Real Errors
If simulating disk/permission problems:
They must actually occur, not fake messages.
15. Submission
Prepare folder: abc_xyz/
Compress: abc_xyz.zip
Upload to: Target Location
... Project Submitted(wait for the RESPONSE FROM the team).
For more detailed Explanations : https://t.co/yAzsZIwjcx
Thank you for your Valuable time, see you in the next one,... 💝
#DevOps #AI #Groq_API_Key #Harbor #UV #SWE #SRE #MachineLearning #TerminalBench #Groq #RemoteWork #CareerGrowth #AI_Agents #BeSpoke_Labs #LLM #Assessment
..](https://pbs.twimg.com/media/HDJs74ma8AA9vVn.jpg)
![Snsbr2004Sabar's tweet photo. Designing DevOps Challenges for AI Agents: "My Terminal Bench 2.0 Experience"🚀
(From Errors=1 to Trials=1: "Building a Hard AI-DevOps Task")
"Rejection or Learning"? My Journey with Terminal Bench 2.0 Assessment 👨🏻💻
Today, I submitted my project for a “Design and implement a hard DevOps/SWE task for an AI agent” assessment. The goal? Not to solve a DevOps problem myself—but to create a challenging problem for an AI agent to solve.
The Objective :-
i) The task had to be solvable but difficult.
ii) On 10 runs, a standard LLM agent’s success rate should be > 0.0 but < 0.7.
iii) The AI agent had to demonstrate reasoning, like analyzing logs and resolving circular dependencies—not just file manipulations.
My Workflow :-
1️⃣ Installed UV, Groq, and set up a Python virtual environment. Configured Groq API keys for real-world DevOps interaction.
2️⃣ Used the Harbor default skeleton template and customized it according to my task requirements.
3️⃣ Faced multiple failures: Errors=1, Trials=0, Mean=0.0 repeatedly. I debugged the environment, dependency issues, and container setups until finally achieving Trials=1, Errors=0.
4️⃣ Despite everything, the mean value remained 0.0, meaning my AI agent didn’t fully meet the target success rate.
💡 Key Takeaways :-
1) A rejection doesn’t mean failure—it’s an incredible learning experience.
2) Hands-on experience with AI agents solving DevOps/SWE tasks, managing containers, and debugging runtime environments is priceless.
3) For anyone into AI/ML, DevOps, SWE, SRE, this assessment is a golden opportunity—remote contract for 3 months, and real-world engineering exposure : @BespokeLabs .
Special thanks to Ahmed Riaz , Asad Khaleel , Bespoke Labs for considering me and giving me this chance. 🙏
Even if the results weren’t perfect, the learning and exposure were unmatched! 💪
................................................................
PROJECT WORKFLOW :-
1. Understand the Objective (Before Doing Anything)
i) Your task is not solving a DevOps problem.
ii) Your task is creating a DevOps problem for an AI agent to solve.
iii) Specifically: You must build a Terminal Bench 2.0 task where:
iv) An AI agent interacts with a Linux terminal and tries to solve a difficult DevOps or SWE issue.
Examples of such tasks could include:
1) Fixing a broken Docker build
2) Debugging a failing microservice
3) Resolving dependency conflicts
4) Fixing a CI/CD pipeline
5) Debugging Kubernetes deployment issues
6) Repairing a broken API backend
But the key requirement is: The task must be solvable but difficult.
2. Environment Setup (Exact Commands)
This section must be done before task creation.
Step 1 — Install UV
curl -LsSf https://t.co/2yvNyGVbdg | sh
Restart the shell or run:
source $HOME/.local/bin/env
Step 2 — Initialize Project
Create a working directory:
mkdir terminal-bench-task
cd terminal-bench-task
Run:
uv init
Step 3 — Create Python Environment
uv venv --python 3.12
Activate it:
source .venv/bin/activate
Step 4 — Install Harbor CLI
uv tool install harbor
Verify:
harbor --version
3. LLM API Setup
i) This part is mandatory because the agent needs an LLM backend.
ii) Create an account on Groq console.
iii) Generate an API key.
Then run:
uv pip install groq
Create .env:
touch .env
Add your key:
echo 'GROQ_API_KEY="your_api_key"' > .env
Export it:
export GROQ_API_KEY="your_api_key"
4. Create the Task Skeleton
Now you create the task structure.
Run:
harbor tasks init "abc_xyz"
This generates a task directory.
Example:
abc_xyz/
5. Implement the Required Task Structure
Inside the generated folder you must build this structure:
abc_xyz/
│
├── task.toml
├── instruction.md
│
├── environment/
│ ├── Dockerfile
│ └── app files #We can add more files,if required(in any section)
│
├── solution/
│ ├── https://t.co/RfYbFFJPlF
│ └── scripts
│
└── tests/
├── https://t.co/z8aqAtiWWe
└── test_outputs.py
Now the document specifies exact responsibilities for each file.
6. task.toml Configuration
Inside task.toml you must add:
[environment.runtime]
python = "3.12"
This ensures reproducibility.
7. instruction.md (The AI Prompt)
This file is what the AI agent reads.
You must describe:
i) The system
ii) The problem
iii) The expected outcome
But you must NOT reveal the solution steps.
Example structure:
You are working on a microservice deployment.
The build pipeline is failing due to dependency conflicts.
Your goal is to make the build succeed and ensure the service starts correctly.
8. environment/ (The Broken System)
This directory represents the system the agent must debug.
It may contain:
i) source code
ii) configs
iii) Docker setup
iv) scripts
v) microservices
Inside the Dockerfile (You must include):
COPY * /app/
Everything will be mounted inside /app.
Important rule from the doc(Do NOT include) :
i) solution files
ii) test files
The agent must not see them.
9. solution/ (Golden Solution)
a) This is the human-written correct solution.
b) You implement scripts that fix the problem.
c) Then https://t.co/RfYbFFJPlF must run them.
Example:
solution/
├ fix_dependencies.sh
└ https://t.co/RfYbFFJPlF
https://t.co/RfYbFFJPlF runs:
bash fix_dependencies.sh
This solution is used only for oracle validation.
10. tests/ (Verification)
You must write pytest tests that verify the task was solved.
Example checks:
i) Service runs
ii) API returns correct response
iii) File generated
iv) Build passes
Tests go inside:
tests/test_outputs.py
You must NOT edit:
tests/test.sh
11. Run the Oracle Test
Run this outside the task directory:
harbor run -p "./abc_xyz" -a oracle
What happens:
i) Harbor builds Docker
ii) runs https://t.co/RfYbFFJPlF
iii) executes tests
If tests fail → your environment or solution is broken.
12. Run the AI Agent
Now run the real evaluation.
harbor run -p "./abc_xyz" \
-a terminus-2 \
--model groq/moonshotai/kimi-k2-instruct-0905 \
-k 10 \
-n 10
Explanation:
terminus-2 → the AI terminal agent
model → Groq LLM
k=10 → run the task 10 times
n=10 → concurrent threads
13. Difficulty Requirement
Your task must satisfy: 0 < success_rate < 0.7
Meaning:
i) AI must sometimes solve it
ii) AI must often fail
If success = 100% → too easy If success = 0% → impossible
14. Quality Rules (Important)
The document explicitly requires:
A) Functional Tests
Tests must verify real system behavior.
B) Pinned Versions
Example:
pip install numpy==1.21.0
NOT:
pip install numpy
C) No Cheating
Agent should not find solution by reading files.
D) Test Isolation
Tests must not exist inside the Docker container.
E) Real Errors
If simulating disk/permission problems:
They must actually occur, not fake messages.
15. Submission
Prepare folder: abc_xyz/
Compress: abc_xyz.zip
Upload to: Target Location
... Project Submitted(wait for the RESPONSE FROM the team).
For more detailed Explanations : https://t.co/yAzsZIwjcx
Thank you for your Valuable time, see you in the next one,... 💝
#DevOps #AI #Groq_API_Key #Harbor #UV #SWE #SRE #MachineLearning #TerminalBench #Groq #RemoteWork #CareerGrowth #AI_Agents #BeSpoke_Labs #LLM #Assessment
..](https://pbs.twimg.com/media/HDJsyzFbQAEFVo8.jpg)
















![Snsbr2004Sabar's tweet photo. Designing DevOps Challenges for AI Agents: "My Terminal Bench 2.0 Experience"🚀
(From Errors=1 to Trials=1: "Building a Hard AI-DevOps Task")
"Rejection or Learning"? My Journey with Terminal Bench 2.0 Assessment 👨🏻💻
Today, I submitted my project for a “Design and implement a hard DevOps/SWE task for an AI agent” assessment. The goal? Not to solve a DevOps problem myself—but to create a challenging problem for an AI agent to solve.
The Objective :-
i) The task had to be solvable but difficult.
ii) On 10 runs, a standard LLM agent’s success rate should be > 0.0 but < 0.7.
iii) The AI agent had to demonstrate reasoning, like analyzing logs and resolving circular dependencies—not just file manipulations.
My Workflow :-
1️⃣ Installed UV, Groq, and set up a Python virtual environment. Configured Groq API keys for real-world DevOps interaction.
2️⃣ Used the Harbor default skeleton template and customized it according to my task requirements.
3️⃣ Faced multiple failures: Errors=1, Trials=0, Mean=0.0 repeatedly. I debugged the environment, dependency issues, and container setups until finally achieving Trials=1, Errors=0.
4️⃣ Despite everything, the mean value remained 0.0, meaning my AI agent didn’t fully meet the target success rate.
💡 Key Takeaways :-
1) A rejection doesn’t mean failure—it’s an incredible learning experience.
2) Hands-on experience with AI agents solving DevOps/SWE tasks, managing containers, and debugging runtime environments is priceless.
3) For anyone into AI/ML, DevOps, SWE, SRE, this assessment is a golden opportunity—remote contract for 3 months, and real-world engineering exposure : @BespokeLabs .
Special thanks to Ahmed Riaz , Asad Khaleel , Bespoke Labs for considering me and giving me this chance. 🙏
Even if the results weren’t perfect, the learning and exposure were unmatched! 💪
................................................................
PROJECT WORKFLOW :-
1. Understand the Objective (Before Doing Anything)
i) Your task is not solving a DevOps problem.
ii) Your task is creating a DevOps problem for an AI agent to solve.
iii) Specifically: You must build a Terminal Bench 2.0 task where:
iv) An AI agent interacts with a Linux terminal and tries to solve a difficult DevOps or SWE issue.
Examples of such tasks could include:
1) Fixing a broken Docker build
2) Debugging a failing microservice
3) Resolving dependency conflicts
4) Fixing a CI/CD pipeline
5) Debugging Kubernetes deployment issues
6) Repairing a broken API backend
But the key requirement is: The task must be solvable but difficult.
2. Environment Setup (Exact Commands)
This section must be done before task creation.
Step 1 — Install UV
curl -LsSf https://t.co/2yvNyGVbdg | sh
Restart the shell or run:
source $HOME/.local/bin/env
Step 2 — Initialize Project
Create a working directory:
mkdir terminal-bench-task
cd terminal-bench-task
Run:
uv init
Step 3 — Create Python Environment
uv venv --python 3.12
Activate it:
source .venv/bin/activate
Step 4 — Install Harbor CLI
uv tool install harbor
Verify:
harbor --version
3. LLM API Setup
i) This part is mandatory because the agent needs an LLM backend.
ii) Create an account on Groq console.
iii) Generate an API key.
Then run:
uv pip install groq
Create .env:
touch .env
Add your key:
echo 'GROQ_API_KEY="your_api_key"' > .env
Export it:
export GROQ_API_KEY="your_api_key"
4. Create the Task Skeleton
Now you create the task structure.
Run:
harbor tasks init "abc_xyz"
This generates a task directory.
Example:
abc_xyz/
5. Implement the Required Task Structure
Inside the generated folder you must build this structure:
abc_xyz/
│
├── task.toml
├── instruction.md
│
├── environment/
│ ├── Dockerfile
│ └── app files #We can add more files,if required(in any section)
│
├── solution/
│ ├── https://t.co/RfYbFFJPlF
│ └── scripts
│
└── tests/
├── https://t.co/z8aqAtiWWe
└── test_outputs.py
Now the document specifies exact responsibilities for each file.
6. task.toml Configuration
Inside task.toml you must add:
[environment.runtime]
python = "3.12"
This ensures reproducibility.
7. instruction.md (The AI Prompt)
This file is what the AI agent reads.
You must describe:
i) The system
ii) The problem
iii) The expected outcome
But you must NOT reveal the solution steps.
Example structure:
You are working on a microservice deployment.
The build pipeline is failing due to dependency conflicts.
Your goal is to make the build succeed and ensure the service starts correctly.
8. environment/ (The Broken System)
This directory represents the system the agent must debug.
It may contain:
i) source code
ii) configs
iii) Docker setup
iv) scripts
v) microservices
Inside the Dockerfile (You must include):
COPY * /app/
Everything will be mounted inside /app.
Important rule from the doc(Do NOT include) :
i) solution files
ii) test files
The agent must not see them.
9. solution/ (Golden Solution)
a) This is the human-written correct solution.
b) You implement scripts that fix the problem.
c) Then https://t.co/RfYbFFJPlF must run them.
Example:
solution/
├ fix_dependencies.sh
└ https://t.co/RfYbFFJPlF
https://t.co/RfYbFFJPlF runs:
bash fix_dependencies.sh
This solution is used only for oracle validation.
10. tests/ (Verification)
You must write pytest tests that verify the task was solved.
Example checks:
i) Service runs
ii) API returns correct response
iii) File generated
iv) Build passes
Tests go inside:
tests/test_outputs.py
You must NOT edit:
tests/test.sh
11. Run the Oracle Test
Run this outside the task directory:
harbor run -p "./abc_xyz" -a oracle
What happens:
i) Harbor builds Docker
ii) runs https://t.co/RfYbFFJPlF
iii) executes tests
If tests fail → your environment or solution is broken.
12. Run the AI Agent
Now run the real evaluation.
harbor run -p "./abc_xyz" \
-a terminus-2 \
--model groq/moonshotai/kimi-k2-instruct-0905 \
-k 10 \
-n 10
Explanation:
terminus-2 → the AI terminal agent
model → Groq LLM
k=10 → run the task 10 times
n=10 → concurrent threads
13. Difficulty Requirement
Your task must satisfy: 0 < success_rate < 0.7
Meaning:
i) AI must sometimes solve it
ii) AI must often fail
If success = 100% → too easy If success = 0% → impossible
14. Quality Rules (Important)
The document explicitly requires:
A) Functional Tests
Tests must verify real system behavior.
B) Pinned Versions
Example:
pip install numpy==1.21.0
NOT:
pip install numpy
C) No Cheating
Agent should not find solution by reading files.
D) Test Isolation
Tests must not exist inside the Docker container.
E) Real Errors
If simulating disk/permission problems:
They must actually occur, not fake messages.
15. Submission
Prepare folder: abc_xyz/
Compress: abc_xyz.zip
Upload to: Target Location
... Project Submitted(wait for the RESPONSE FROM the team).
For more detailed Explanations : https://t.co/yAzsZIwjcx
Thank you for your Valuable time, see you in the next one,... 💝
#DevOps #AI #Groq_API_Key #Harbor #UV #SWE #SRE #MachineLearning #TerminalBench #Groq #RemoteWork #CareerGrowth #AI_Agents #BeSpoke_Labs #LLM #Assessment
..](https://pbs.twimg.com/media/HDJtHLtboAElc3e.jpg)