The Sales Ledger’s „Stats“ tab got a major update:
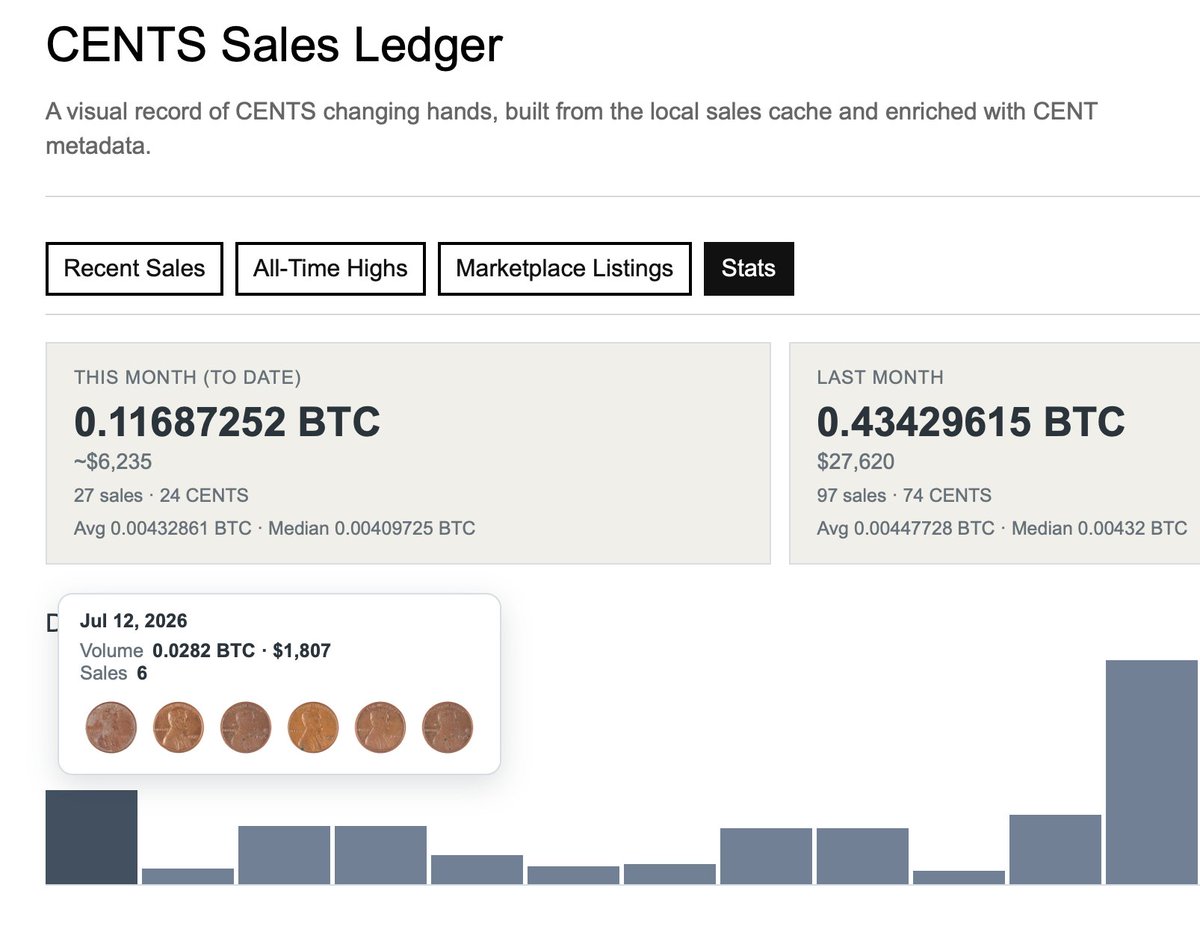
Hovering a bar on the Stats tab’s „Daily Volume“ chart now shows a small mosaic of the actual CENTS sold that day, the same idea as the mini-CENT preview on the Collectors page.
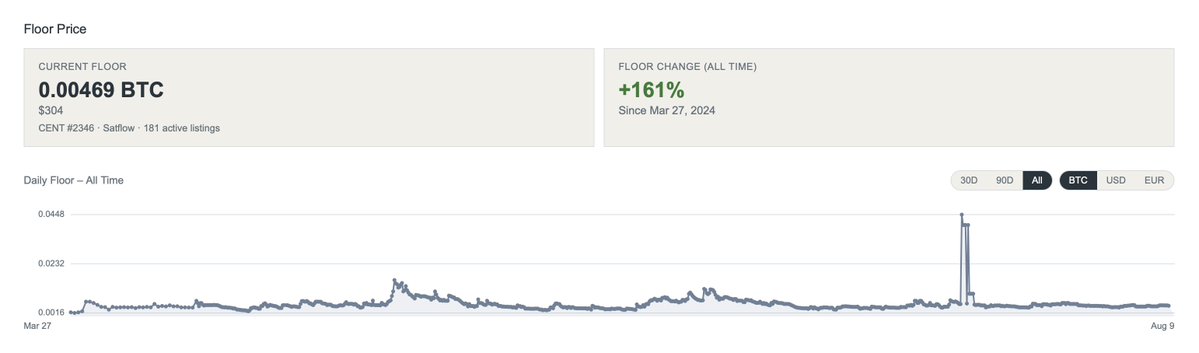
The new „Floor Price“ section goes back to mint day now. Floor price from 2026-06-15 onward is reconstructed from our own listing activity and reconciled against the live orderbook; earlier history (back to March 2024) is sourced from three third-party trackers, denser/more-direct preferred where more than one covers the same day, shown only where our own tracking hadn’t started yet.
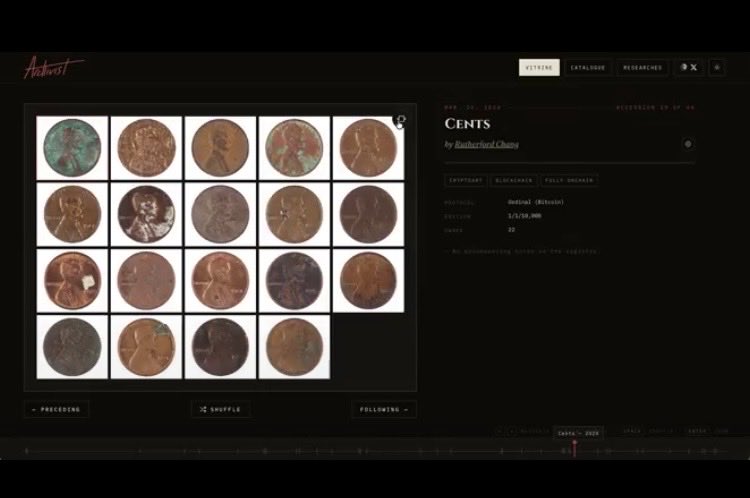
Owning assets is one thing. Arranging them is another. I put mine together over spare evenings and didn't expect much. A gallery makes you turn a list into a story, and it changes how you read your own collection. Especially if you collect across multiple mediums or protocols.
another great feature add on cents-vision
✊✊
they're not bad stats, it's pretty wild how consistent volume has been with CENTS, particularly considering the oft-reported death of Ordinals.
Update on cents-vision:
The Sales Ledger has a new „Stats“ tab, alongside Recent Sales, All-Time Highs and Marketplace Listings: month-to-date volume compared against the same point last month, a 30-day daily chart, and a 12-month monthly chart.