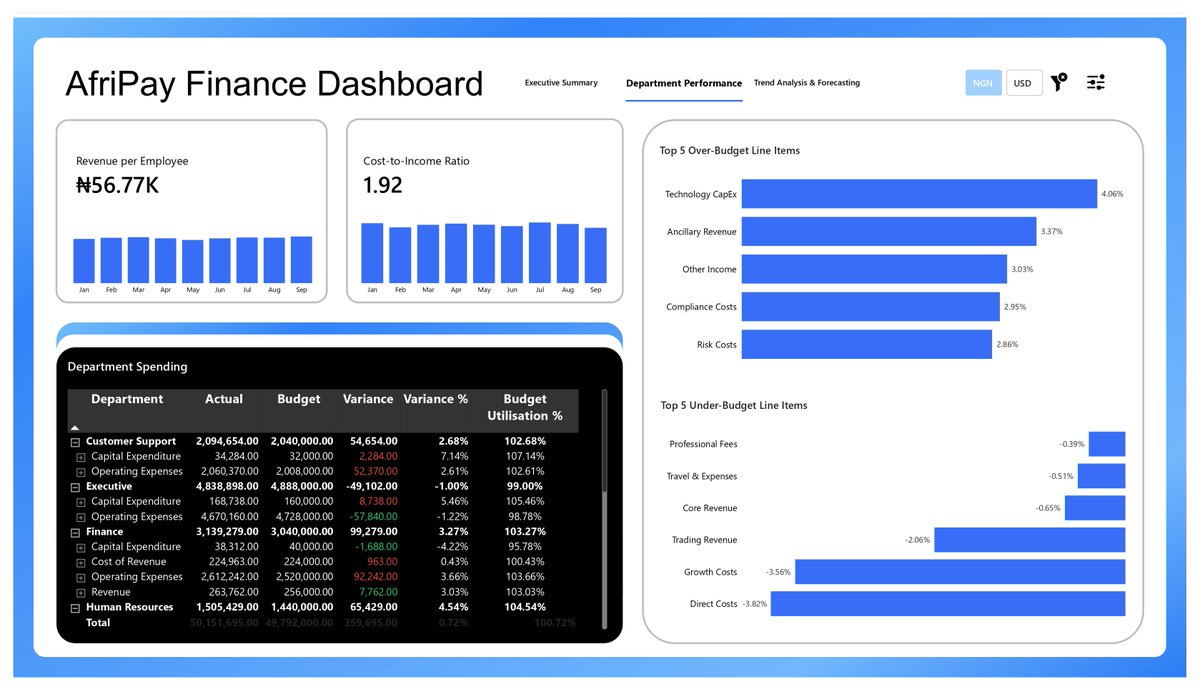
I just completed a Financial Performance Dashboard for AfriPay Solutions Ltd under the mentorship of Mubar Dauda.
This was not just a Power BI project. It was a real fintech business problem: turning fragmented financial data into decision-ready insights.
𝗣𝗮𝗴𝗲 𝟭 𝗼𝗳 𝘁𝗵𝗲 𝗔𝘁𝗵𝗹𝗲𝘁𝗲𝗫 𝗖𝗮𝗿𝗲 𝗱𝗮𝘀𝗵𝗯𝗼𝗮𝗿𝗱 𝗶𝘀 𝘁𝗮𝗸𝗶𝗻𝗴 𝘀𝗵𝗮𝗽𝗲.
3,323 injuries.
€6.33M in expenses.
52.4 average recovery days.
But the numbers aren’t the point.
This is what happens when a cohort moves past
“how do I build this?”
and starts thinking
“what should this do?”
→ KPI cards built with HTML visuals
→ Blink notifications that flag critical values
→ Cards that flip to reveal deeper context
This isn’t a report.
It responds.
It guides.
It makes decisions easier.
That shift didn’t happen by accident.
It came from weeks of:
→ Wireframing before building
→ Getting the data model right
→ Writing DAX with intent
Now it’s showing up in the output.
Page 2 is coming.
More refinement on Page 1.
𝗧𝗵𝗲 𝗳𝘂𝗹𝗹 𝗿𝗲𝘃𝗲𝗮𝗹 𝗶𝘀 𝗰𝗼𝗺𝗶𝗻𝗴 𝘀𝗼𝗼𝗻.
#Datafam
𝗠𝗼𝘀𝘁 𝗣𝗼𝘄𝗲𝗿 𝗕𝗜 𝗰𝗼𝘂𝗿𝘀𝗲𝘀 𝘀𝘁𝗼𝗽 𝗮𝘁 𝗗𝗔𝗫.
Mine doesn’t.
We’re wrapping up the Power BI series at Data with Danny
and before closing out, I introduced my students to two things most instructors aren’t teaching yet.
𝗙𝗶𝗿𝘀𝘁 𝗖𝗹𝗮𝘂𝗱𝗲’𝘀 𝗠𝗖𝗣 𝘀𝗲𝗿𝘃𝗲𝗿, connected directly to Power BI.
What that unlocked:
→ Model structure set up automatically
→ Measure folders organised without manual work
→ 35+ DAX measures written and optimised
In under 5 minutes.
Something that would normally take hours.
𝗦𝗲𝗰𝗼𝗻𝗱 𝘁𝗵𝗲 𝗛𝗧𝗠𝗟 𝗩𝗶𝗲𝘄𝗲𝗿 𝘃𝗶𝘀𝘂𝗮𝗹.
Most people don’t know Power BI can render HTML.
Once you know this, your KPI cards, injury summaries, and dynamic text
stop looking like dashboards
and start looking like products.
But before we touched any of it, I told my students this:
AI will never replace someone who understands the fundamentals.
It will replace someone who doesn’t
and thinks AI is a shortcut around learning them.
We spent weeks building the foundation first:
→ Data model
→ Relationships
→ DAX logic
Because if you don’t understand what a good measure looks like,
you won’t know when AI writes a bad one.
𝗔𝗜 𝗶𝗻 𝘁𝗵𝗲 𝗺𝗶𝗱𝗱𝗹𝗲.
𝗡𝗼𝘁 𝗮𝘁 𝘁𝗵𝗲 𝗯𝗲𝗴𝗶𝗻𝗻𝗶𝗻𝗴.
That’s the difference between working smart
and getting lucky.
#Datafam
𝗠𝘆 𝘀𝘁𝘂𝗱𝗲𝗻𝘁𝘀 𝗱𝗶𝗱𝗻’𝘁 𝗸𝗻𝗼𝘄 𝗱𝗮𝘁𝗮 𝗮𝗻𝗮𝗹𝘆𝘀𝘁𝘀 𝘂𝘀𝗲 𝗙𝗶𝗴𝗺𝗮.
Honestly, that reaction told me everything.
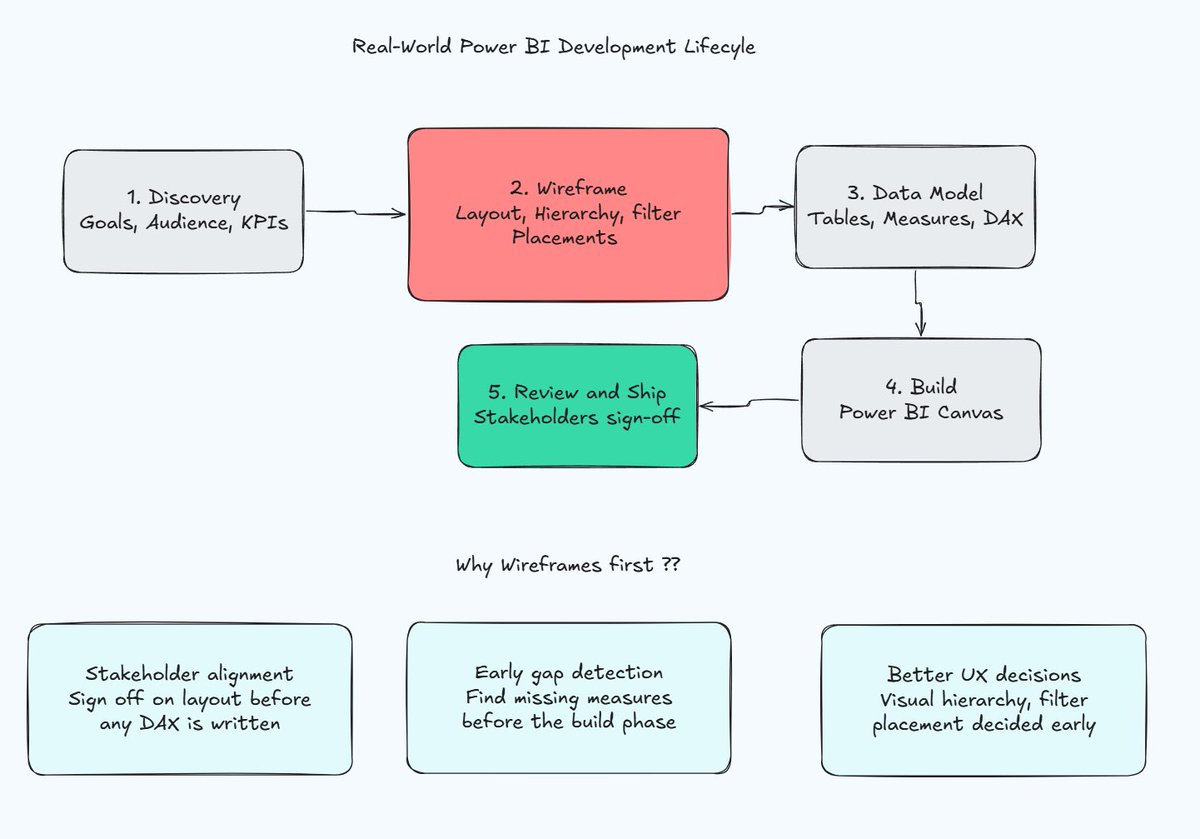
Today we covered wireframing in Power BI.
The moment I showed them how a wireframe catches gaps before a single DAX measure is written —
the questions got intense.
One student asked:
“So wireframing can actually prevent build problems?”
Yes.
That’s exactly the point.
Most people jump straight into Power BI and start building.
Then halfway through they realise:
→ The layout doesn’t tell a story
→ A measure they need doesn’t exist yet
→ The stakeholder wanted something completely different
Wireframing fixes all of that before it becomes expensive.
Discovery → Wireframe → Data Model → Build → Ship
That’s the real Power BI development lifecycle.
Not “open Power BI and start dragging visuals.”
𝗧𝗵𝗶𝘀 𝗶𝘀 𝘄𝗵𝘆 𝗜 𝘁𝗲𝗮𝗰𝗵 𝘁𝗵𝗲 𝗽𝗿𝗼𝗰𝗲𝘀𝘀, 𝗻𝗼𝘁 𝗷𝘂𝘀𝘁 𝘁𝗵𝗲 𝘁𝗼𝗼𝗹.
#Datafam