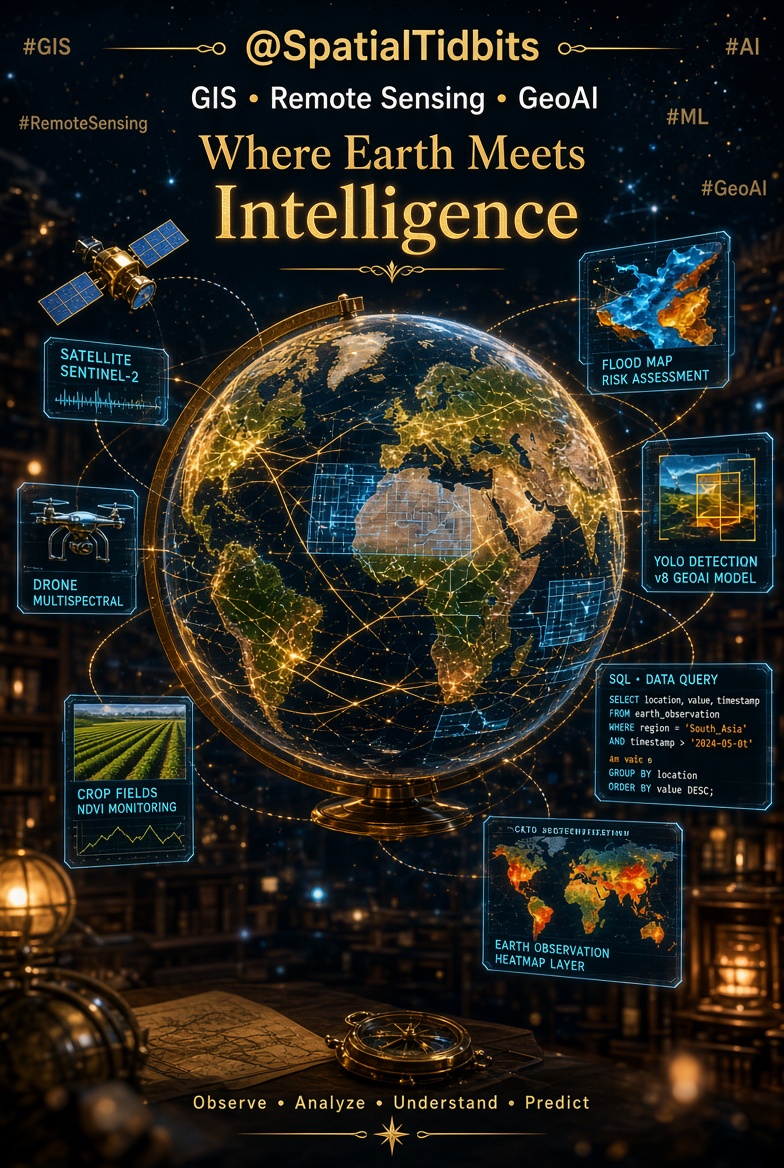
Page run by a Geospatial Engineer. Spatial Data, GIS & Remote Sensing | Exploring the intersection of ML & AI with spatial Tech 🌍 #GIS#RemoteSensing#AI#ML
Part 1 of a series on SQL for Geospatial Data:Mastering the Basics.
The basics will cover as much as the SQL cookbook covers thus tag along even for non spatial data
https://t.co/rHIDQS6iCE
#SpatialTidbits#100DaysOfSQL#geospatialanalysis#DataEngineer
🌏 Planetary Intelligence
Planet just opened up an AI interface to a decade of daily satellite images of the entire Earth. I have been playing with a pre-release and here are some samples of what you can do:
1) For the ag sector: “plot the crop performance of farms near Williams, California for the past 5 years seasons.”
2&3) Ski Season report: a couple samples from the prompt “make a report of the changing snow and ice conditions of the ski resorts in Tahoe for the past decade.” It also has pixel by pixel sliders of the snow levels over the years, part of a 30-page report.
4) My personal passion project: “find RGB signature of planes in flight near Paris airport.” High altitude objects in motion leave a very visible RGB parallax artifact. The push broom sensors in the imaging satellite use its steady motion to integrate a rectangular image from a line sensor sweeping forward in orbit like a push broom. With multiple lines of sensors for different colors, high altitude objects (planes, balloons, satellites) also cause misalignment from parallax shifts (unrelated to their lateral movement). This creates an easily detectable image artifact that can now serve as a search feature. Planet used this "bug" to search its daily planetary imaging database to find all of the high-altitude Chinese spy balloons and trace them back in time to their launch site in China.
Explore our Earth: https://t.co/QCZIQNCrk8
I’m hiring a Student Researcher at
@GoogleDeepMind.
I am looking for PhD students working on multi-agent organization, open-endedness, or self-improvement.
📍 Location: Toronto
🗓️ Duration: 6 months, 100%
🚀 Start date: Jan 2027
Apply now using the links below👇
I'm hiring a Student Researcher at @GoogleDeepMind Montreal 🇨🇦
I am looking for strong PhD students working at the intersection of embodied AI, coding agents and/or diffusion models.
📍 Montreal, Canada
🗓️ start in Q1/Q2 2027 (for 24-30 weeks)
How to apply 👇
I’m hiring a Student Researcher at @GoogleDeepMind.
I am looking for PhD students working on agents, open-endedness, self-improvement or scientific discovery.
📍 Location: London
🗓️ Duration: 24 weeks, 100%
🚀 Start date: June or July 2027
Apply now using the links below👇
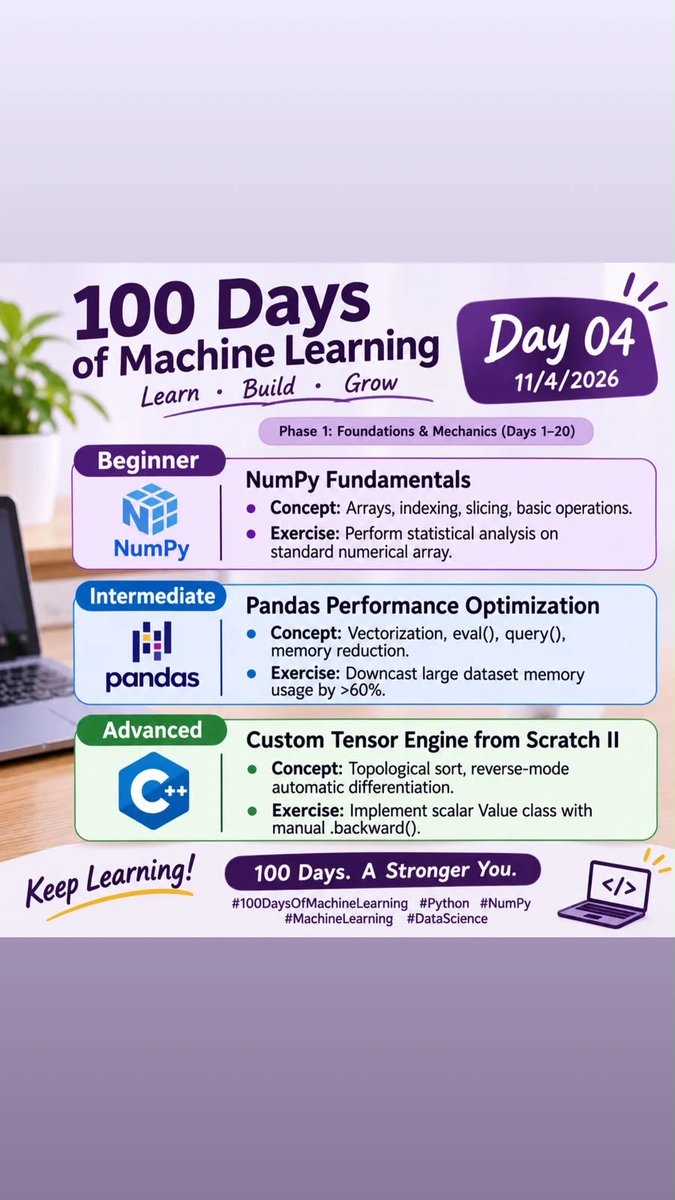
WiMLDS and WiDS will be hosting 100 Days of ML
You are more than welcome to join the communities and engage in the 3 tracks that the activity will be in ie Beginner, Intermediate and advanced track
Looking forward to having you
https://t.co/eKEG0o3O6J
Day 4 of 100 days of machine learning. The first part of the curriculum we are following is 20 days of the foundations & Mechanics
This is an open invite to everyone, Karibuni sana to Learn, build and grow
#100DaysOfML#WiMLDS#WomenInData
WiMLDS and WiDS will be hosting 100 Days of ML
You are more than welcome to join the communities and engage in the 3 tracks that the activity will be in ie Beginner, Intermediate and advanced track
Looking forward to having you
https://t.co/eKEG0o3O6J
The most detailed map of your city's power grid is a trade secret, and it turns out you never needed it.
If you want to know whether a neighbourhood can absorb a few hundred new rooftop solar panels, or where the lines would fail first in a cascading blackout, you need to know which cables feed which buildings, and which transformers and substations sit upstream of them. Utilities keep that map locked away as commercially sensitive and security-critical information. City planners, researchers and energy start-ups who want to model any of this are left guessing, and the worst blind spot is the "last mile", the low-voltage wires that run from the street to your front door.
Two researchers at the University of Oslo decided to rebuild the map from scratch, using nothing the public can't already get.
Their starting material was open infrastructure data: the recorded locations of power lines, poles, substations and transformers. Treating all of it as a network of connected points, they used graph algorithms to trace out the high and medium-voltage skeleton, the big arteries that carry electricity across a district. That part is the easy half, because the major assets are large and reasonably well documented.
The hard half is the last mile, and that's where the real work happens. They pulled in OpenStreetMap building outline data as their guide. With geospatial machine learning they grouped buildings into clusters of likely electricity demand, then worked out the most plausible physical route for the small wires linking each cluster to the nearest pole or transformer. In effect they reverse-engineered where the cables probably run by reasoning about where the buildings are and how a sensible grid would connect them.
To prove it works they pointed the whole thing at Alna, a district of Oslo. Out came a complete wiring diagram connecting 7,330 individual buildings to every major electricity asset in the area, each line sorted into its proper rung of the voltage hierarchy, high then medium then low. That is a full district's worth of grid, reconstructed without a single phone call to the utility.
The implication is pretty big. The same method runs on open data alone, so it can be aimed at any city on Earth without permission from anyone. Suddenly a planner can simulate power flow across a real neighbourhood, stress-test where the wires would buckle under a surge, and plan for the coming flood of electric cars and solar roofs, all on free inputs.
link to full article: https://t.co/9SkKjmKBdl
𝐁𝐮𝐢𝐥𝐝𝐢𝐧𝐠 𝐂𝐥𝐚𝐬𝐬𝐢𝐟𝐢𝐜𝐚𝐭𝐢𝐨𝐧 𝐰𝐢𝐭𝐡 𝐆𝐞𝐨𝐀𝐈 – 𝐆𝐨𝐨𝐠𝐥𝐞 𝐀𝐥𝐩𝐡𝐚𝐄𝐚𝐫𝐭𝐡 𝐢𝐧 𝐏𝐲𝐭𝐡𝐨𝐧
Here comes my first GeoAI tutorial from 2025 - also warch out to my recent full course!
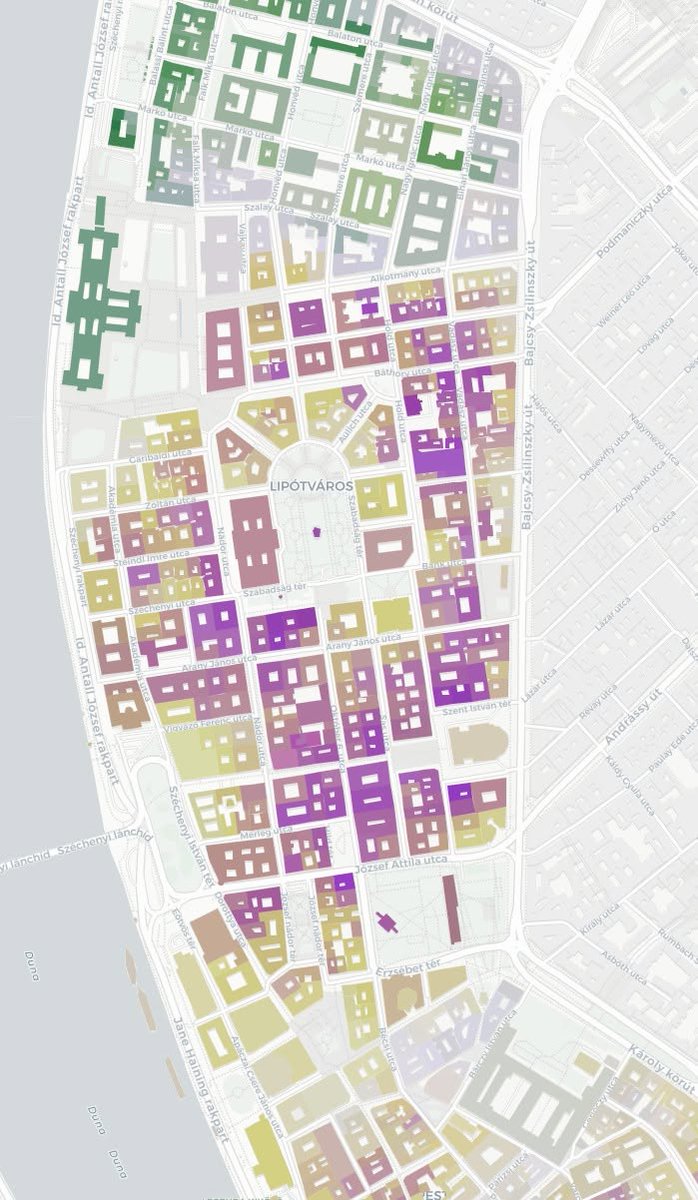
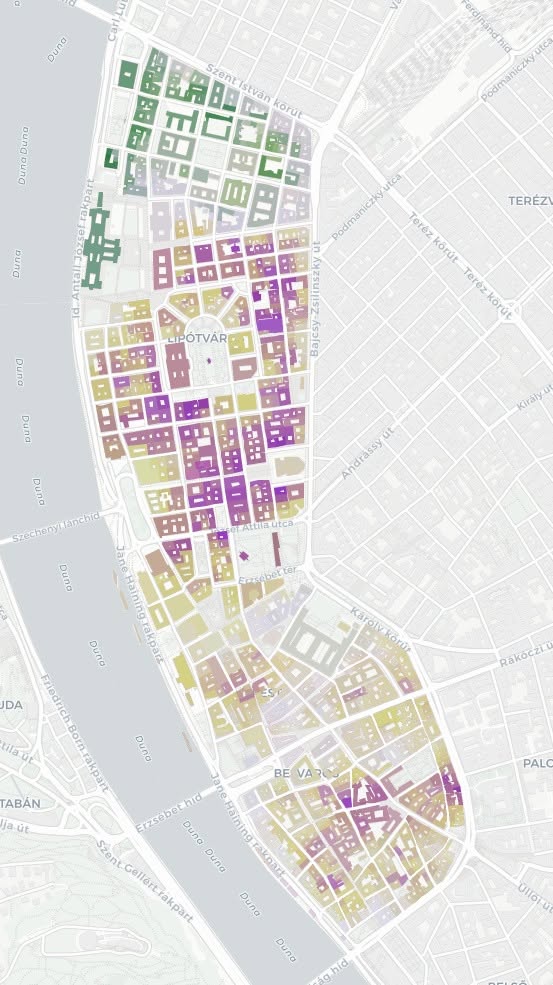
In the tutorial, we start by downloading the AlphaEarth data directly in Python, without any third-party tools, and then combine it with OpenStreetMap building footprints.
Quick recap: Google AlphaEarth is Google’s brand-new GeoAI Earth observation initiative that combines petabytes of satellite imagery and remote sensing to present large-scale, global, 10x10m-resolution multispectral (64 bands for starters) data.
Leveraging this kind of data, due to its small-scale spatial resolution and high feature variance, it's probably going to be a game-changer for data-driven urban planning. It allows data scientists and city planners alike to characterize urban-scale areas all around the world with high precision and harness a rich set of features for planning, predictive modeling, and many other applications - especially if combined with the right vector data.
🔔 𝐖𝐚𝐥𝐤-𝐭𝐡𝐫𝐨𝐮𝐠𝐡 𝐨𝐧 𝐘𝐨𝐮𝐭𝐮𝐛𝐞: https://t.co/PUK2Xq4tno
🔔 𝐂𝐨𝐝𝐞 𝐨𝐧 𝐒𝐮𝐛𝐬𝐭𝐚𝐜𝐤: https://t.co/T4vbhBLdaI
𝐓𝐡𝐞 𝐍𝐞𝐰 𝐒𝐜𝐢𝐞𝐧𝐜𝐞 𝐨𝐟 𝐌𝐚𝐩𝐬 - https://t.co/qRwV1ryEG1
𝐆𝐨𝐨𝐠𝐥𝐞 𝐀𝐥𝐩𝐡𝐚𝐄𝐚𝐫𝐭𝐡: https://t.co/tSQOM0CZ1w
#30DayMapChallenge #GeoAI #Python #GeospatialData #DataVisualization #MachineLearning #GIS #Mapping #OpenStreetMap #EarthEngine #AI #BuildingClassification #SpatialAnalysis #UrbanPlanning
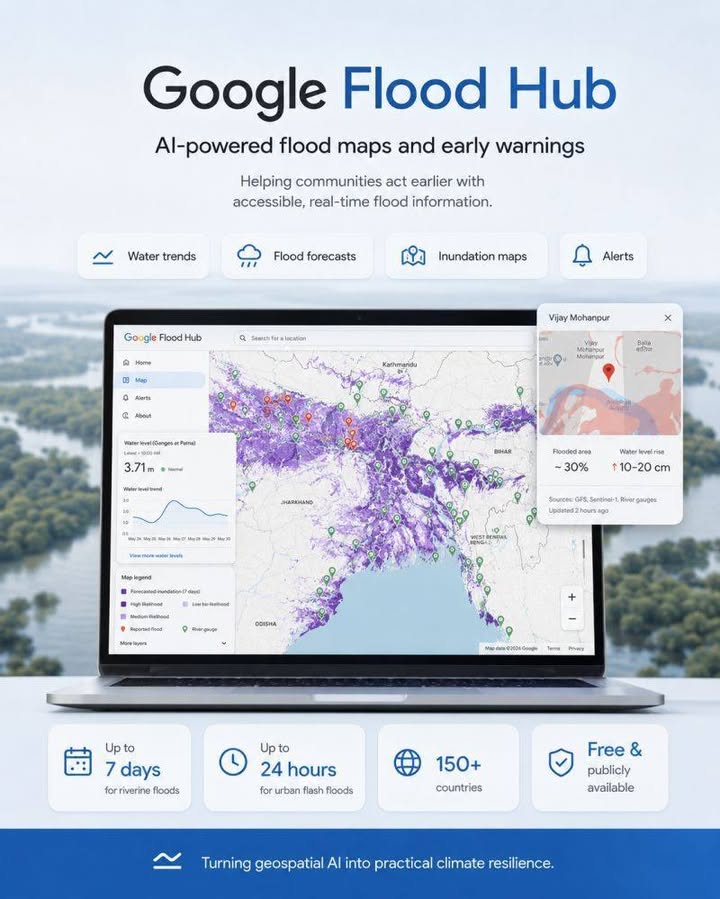
Have you seen Google Flood Hub yet?
Web explorer: https://t.co/4C6oUzBbrK
𝐓𝐡𝐞 𝐍𝐞𝐰 𝐒𝐜𝐢𝐞𝐧𝐜𝐞 𝐨𝐟 𝐌𝐚𝐩𝐬 - https://t.co/7oLqY4KQpA
Thanks for the infographics and the news to @Saurav https://t.co/j8hkqzvZyR
After 7 years as a geospatial data scientist, I quit my job.
I'm going all in to tell you stories hidden in satellite data
I've worked on cocoa and coffee supply chain monitoring, near real time flood maps with radar satellites that see through clouds, mapped trees in 3D to prevent wildfires and built pipelines that analyse crop yields at the scale of the US
But I've always kept going back to telling stories
I've done 70+ interviews of data scientists, CEOs, engineers, policy makers and artists all trying to better understand the impact of data, maps & satellites images in our lives
I've made videos seen by hundreds of thousands of people on how satellite & maps work.
So now I'm going all in
I believe the worlds need more people telling stories, of people; that statistics and data changes the world, but people and stories are what resonate.
A few weeks ago I already put a video out with @OurRadiantEarth about millions of people being miscounted in Argentina. One of the largest press outlets picked the story up, and now there's a conversation about this problem, that's what I want to go do
This is probably the scariest thing I've ever done in my life, but I'm also really excited about it
If you're a company doing cool, impactful stuff with satellite images, geospatial & data and can't get the world to pay attention, let's work together.
I have some cool stories coming up and some collaborations in the pipes.
So, if that sounds cool, I'll see you around on the internets
@AshivakaGilbert, Malungu & I are building deepQuery
It’s a knowledge base system: enterprise level to overcome the challenges of understanding your data as an organization
The Substack post summarizes our situation: how we came together
Today I’ve used Gemini in a Google Colab project and used Copilot for GitHub with Visual Studio Code, to make some small changes to complex projects created by other people. I’m giving myself a Level 1 Vibe Coders Badge (Created for me by Grok) @SpatialTidbits