So the spot players on Binance had big balls
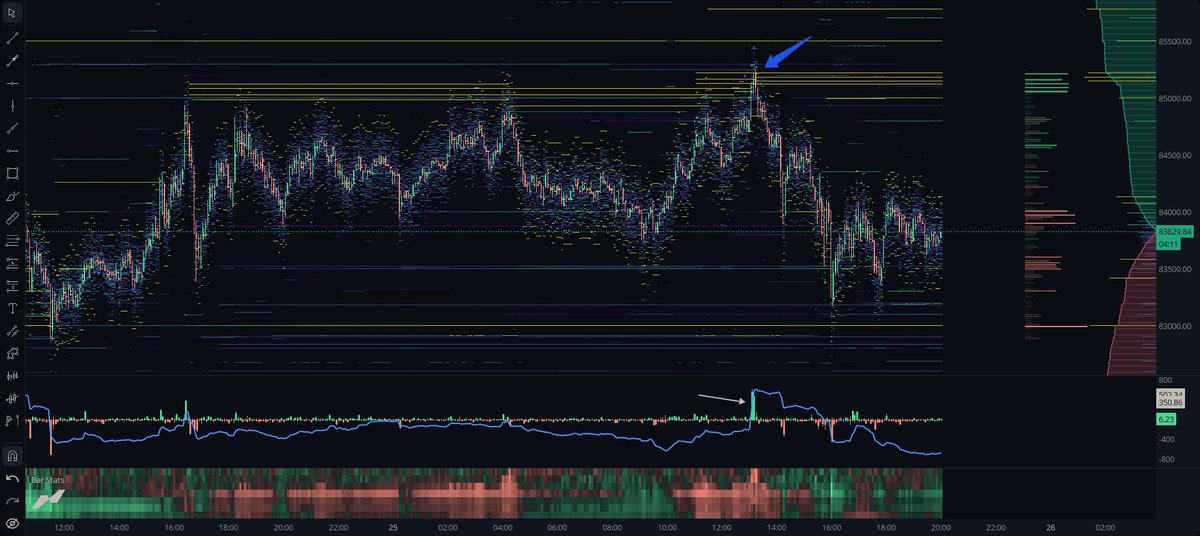
Price tapped the ask limits and got hit with 500+ BTC distribution.
Right after that, another 500+ BTC ask wall showed up.
That tells you someone was ready to keep absorbing buyers if needed.
No surprise price went down after that.
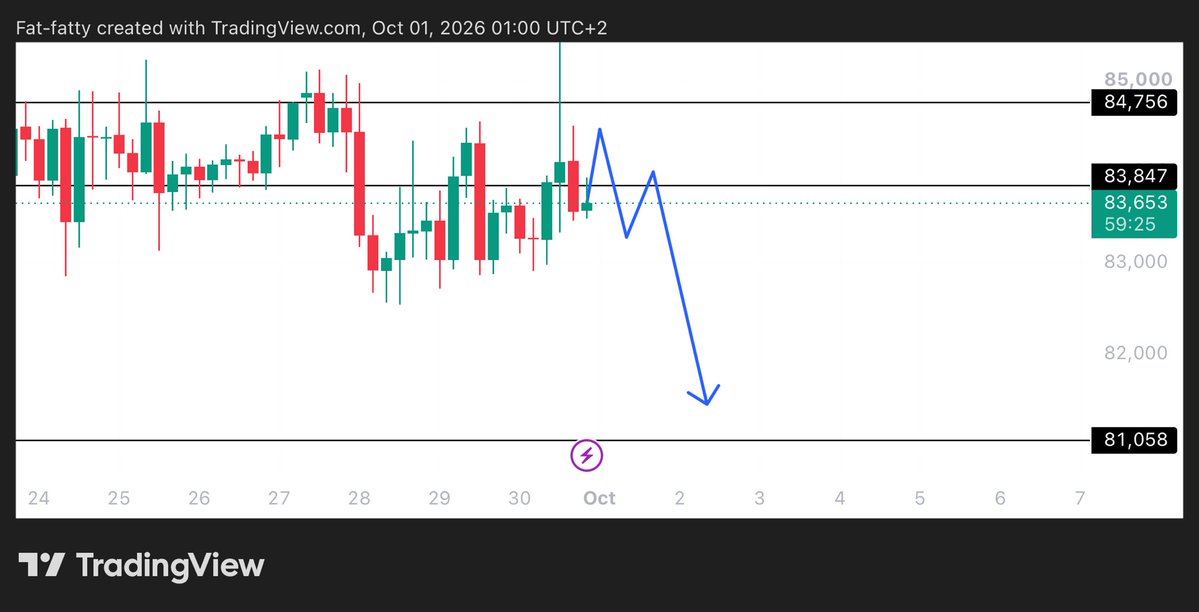
Big seller above.
Weak upside.
Path of least resistance lower.
#BTC
$BTC WEEKLY vs DAILY Profile looks decent here but here are the interesting takeaways.
WEEKLY Chart tells us that the previous Weekly red candle was engulfing and this candle is till now forming a wick both side. (indecision)
This tells us that current weekly candle if closes below previous weekly close then we can expect more downside in Bitcoin otherwise everything is good in the daily timeframe...which brings us to daily analysis
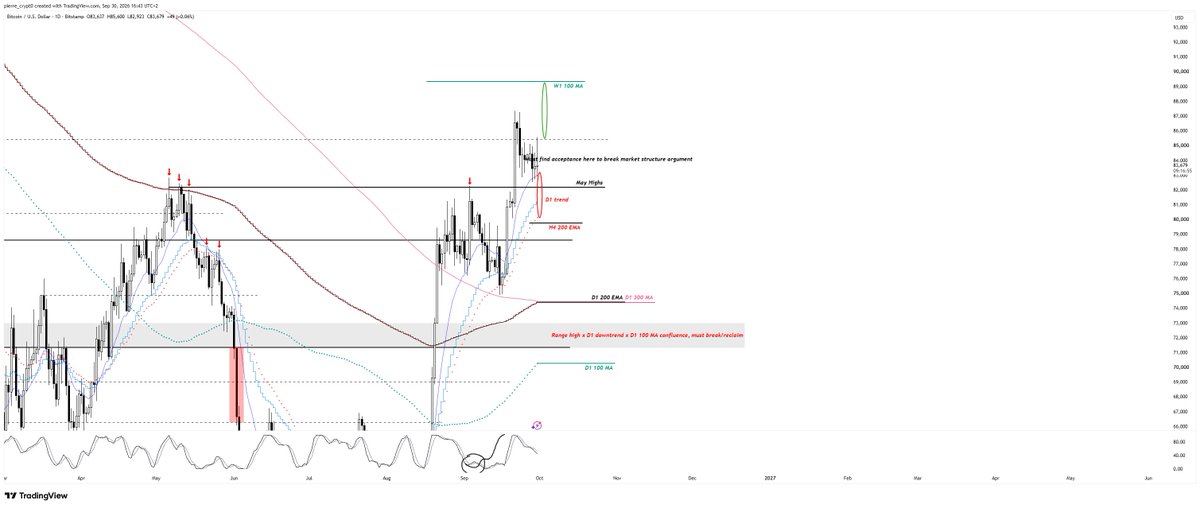
DAILY Chart tells us clearly that we are trading both above previous weekly low and previous day high which is kind of a bullish sign. But there is a catch..
The red line box is a clear cut resistance in $BTC which was previously being held support but now lost.
The line is actually $77k to $77.3k area which I am closely monitoring
In cases like these, a rejection from red box is likely.
Invalidation is simple : close above the red zone is needed for bullish continuation otherwise weekly analysis will prevail over daily analysis.
#Bitcoin #btcusdt #btc
$BTC
Heavy spot selling showing up across Binance BTC spot markets.
I’m watching the charts closely — if I see a clear reversal or buyers stepping back in, I’ll update you. 👀
$SOL looks strong here, but this $104–110 area is where things get interesting.
Break and hold above $104 → I think $110+ is next.
Lose $88–92 → I’d expect a deeper pullback.
For now, I’m just watching the levels and waiting for confirmation. 📈