Auction Context – Market Profile as Your Map
Before you think about placing a trade, you want to know where in the auction cycle the market is.
Market Profile gives you the structure that most traders don’t see when they’re staring at candlesticks.
5 Core Concepts to Track:
1. Value Area High (VAH) / Value Area Low (VAL)
Defines the 70% of the session’s volume where most business was done.
Outside of value = “expensive” or “cheap” to the market participants.
2. Point of Control (POC)
Price with the most activity = a magnet in balance conditions.
3. Main Day Type Recognition (there are others)
3.1 Balanced -> Mean reversion more likely.
3.2Trend Day -> Initiative activity dominates which means profile elongates in one direction.
3.3 Double Distribution → Two distinct value zones; mid-point acts as a pivot.
4. Structural References
Single prints, low-volume nodes (LVNs) and (HVNs), poor highs/lows, unfinished auctions, each can act as magnets or barriers.
5. Why this matters:
Knowing the auction context lets you pre-define where business is likely to occur and where rejections are probable = which stops you from chasing every micro move.
NOW ONTO GAME PLAN:
Auction context feeds into your game plan.
You’re answering the following:
“Am I a buyer, seller, or observer today?”
“Where is my line in the sand?”
Premarket Prep Routine:
- Mark prior session VAH, VAL, POC.
- Mark overnight high/low and see how they relate to prior value.
- Note anomalies (e.g., single prints) that could be filled.
Decide if you’re looking for:
Initiative trades (price driving away from value) ?
Responsive trades (price returning to value) ?
Bias Examples:
Open above VAH + holding → Look for longs if order flow supports continuation.
Open inside prior value → Fade moves to VAH or VAL unless initiative order flow breaks out.
Mindset:
You should be able to write your bias in one sentence before the open. If you can’t, you’re not ready to trade.
Anyway just my 1 cent whilst Im watching a trade develop - cheers
Time to get out the old chestnut. IF (!) my interpretation is right, we are now in a position where we see a move up, partly due to late shorts covering. Could it be accumulation? Sure. I just don't think it is.
Fibonacci Is a Probability Tool — Not Magic:
1.Fibonacci
2.Breakout
3.Reversal
4.Elliott Wave
5.Failure Value Gap
6.Candlesticks
7.Heikin Ash
8.Moon Phases
9.Renko
10.Harmonic Patterns
https://t.co/QmKMfNTgG4 and resistance
12.Dynamic S&R
13.Trend lines
14.Gann Angels
15.Momentum
@TraderMagus If you haven't yet, you are now thinking about it, so in the future you can. With your position, you can do something out of reach of others.
Some people contribute a little regularly, while others more less frequently .
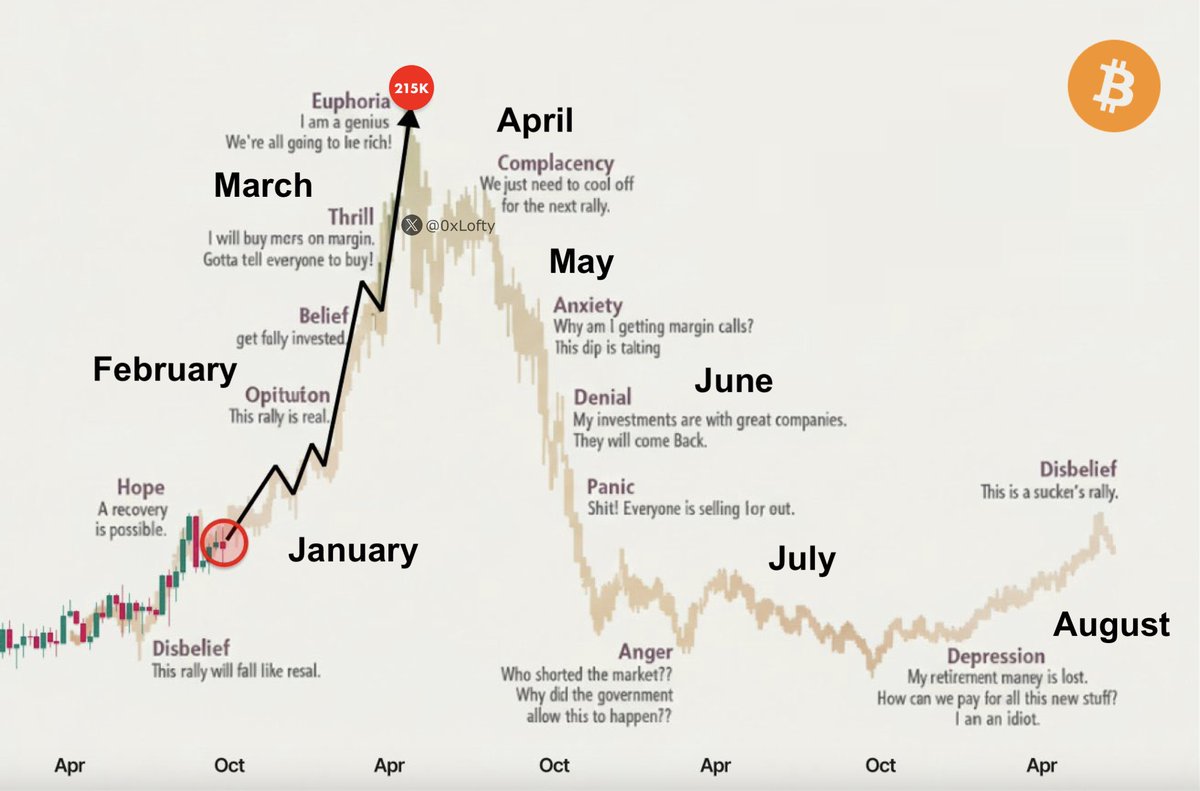
1/ I've had enough of seeing images of this that the big accounts are sharing and liking on here.
All they're doing is sharing hopium that $BTC is going to go to 50k and above any time soon.
It's time for a thread explaining why this is not the pattern you're looking for. 🧵