@Mariusz_Invest "UnitedHealth sells ownership interest in Florida Optum WellMed clinics to TPG in partnership intended to accelerate growth in that market"
via FinViz
Trying to play like @Mariusz_Invest
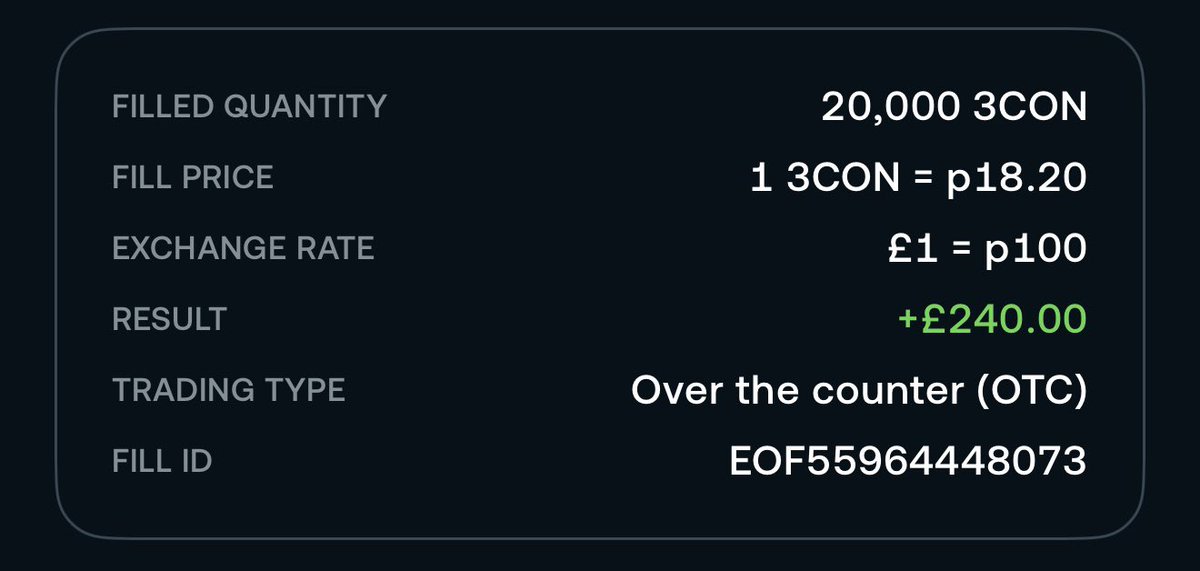
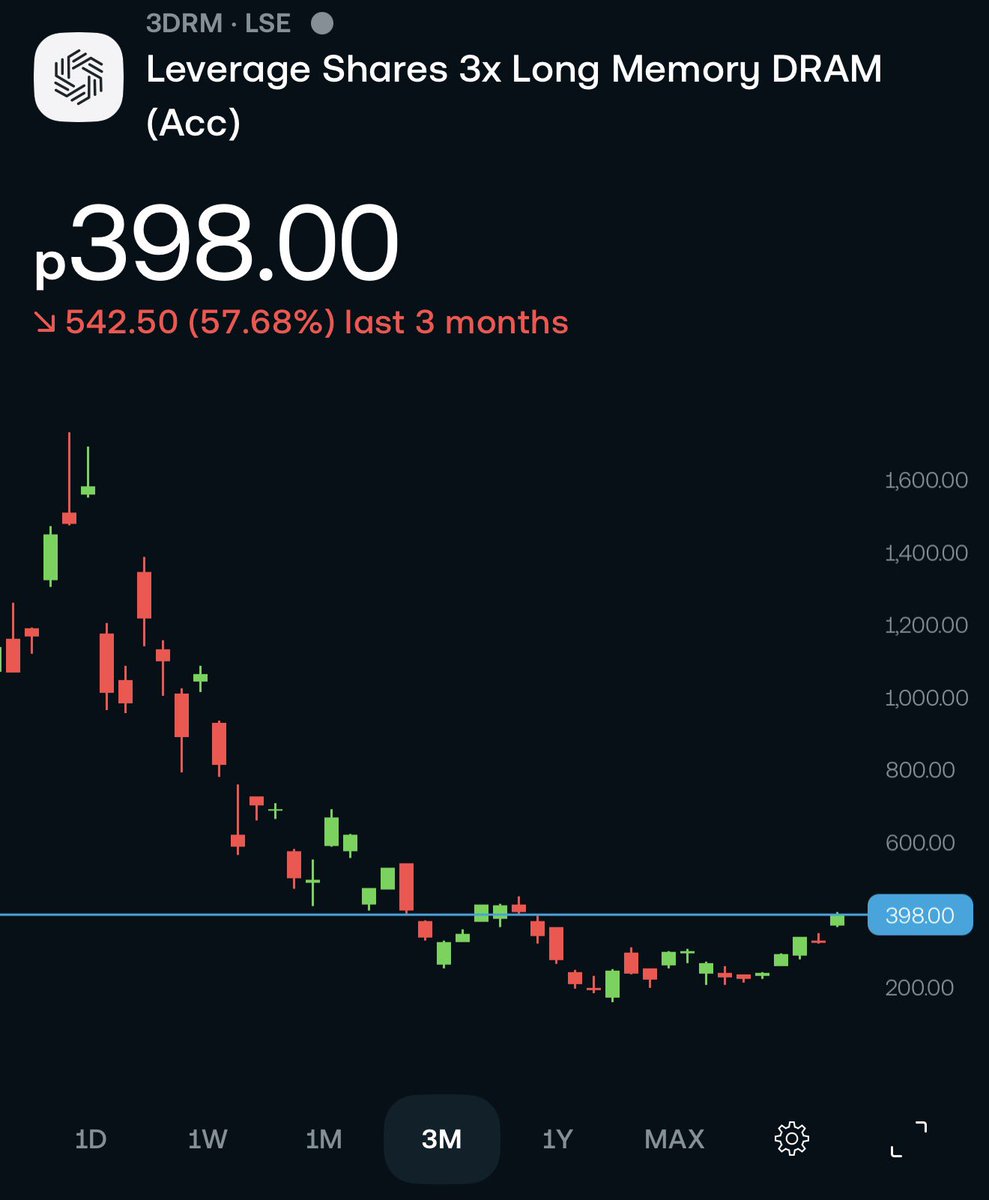
£240 for a 3x Leverage Coinbase trade this morning.
1 hours work.
Crypto is pumping, so are the exchanges.
$COIN $HOOD $BULL
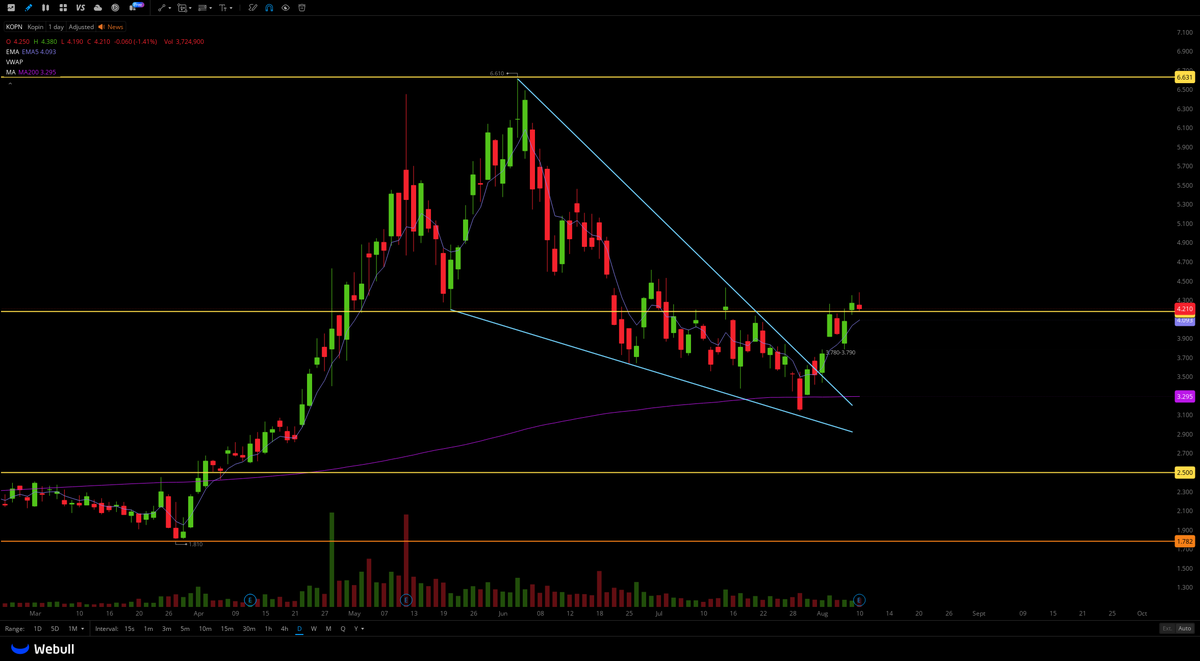
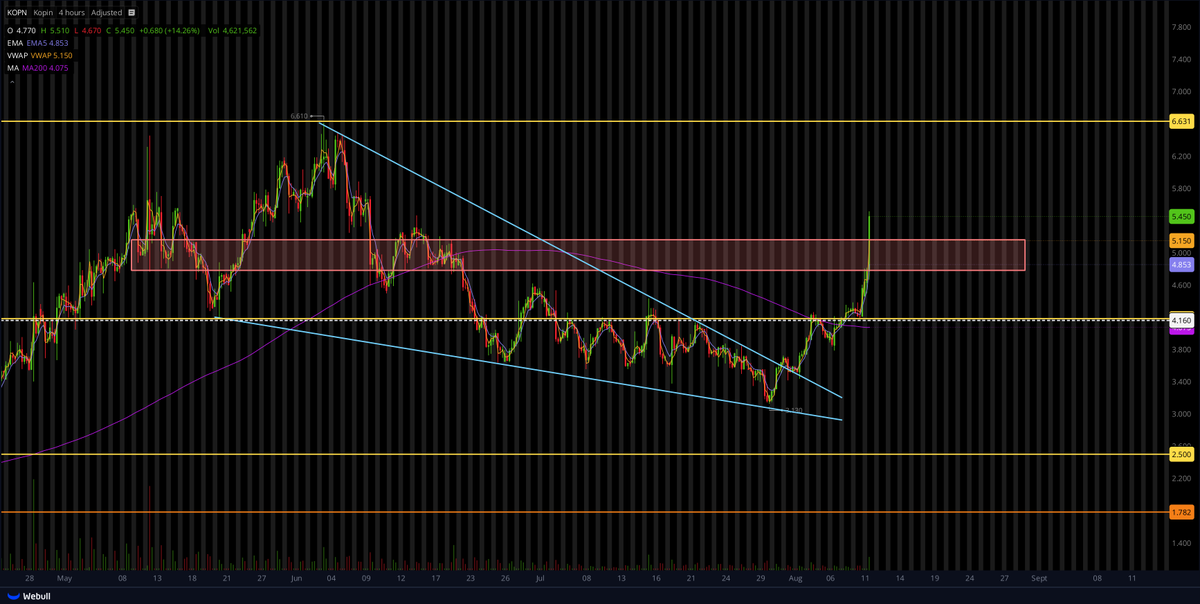
$KOPN - Kopin Corp with a 30% gain today off the back of a positive earnings report & drone/MicroLED orders.
Now in the serious resistance zone, so I expect some choppy price action here, but staying put and holding this one.
Entry @ $4.16 (white dashed line)
NFA
$KOPN - Kopin has staged an impressive breakout from its falling wedge pattern, surging roughly 30% off the $3.50 retest area.
As shown in the images, the stock briefly ran into resistance at $4.20 before consolidating and flipping that exact pivot line into a firm structural support base around $4.18–$4.21.
This bullish momentum coincides directly with Q2 financial results, which beat expectations with total revenues surging 51% YoY to $12.7M alongside an unexpected turn to net profitability.
With the 200-day moving average trailing below and the lower horizon cleared, bulls now face temporary resistance around the $4.75 and $5.20 psychological zones; clearing these key friction points will open the door for an extended run toward the primary $5.50 target.
NFA
$KOPN - Kopin has staged an impressive breakout from its falling wedge pattern, surging roughly 30% off the $3.50 retest area.
As shown in the images, the stock briefly ran into resistance at $4.20 before consolidating and flipping that exact pivot line into a firm structural support base around $4.18–$4.21.
This bullish momentum coincides directly with Q2 financial results, which beat expectations with total revenues surging 51% YoY to $12.7M alongside an unexpected turn to net profitability.
With the 200-day moving average trailing below and the lower horizon cleared, bulls now face temporary resistance around the $4.75 and $5.20 psychological zones; clearing these key friction points will open the door for an extended run toward the primary $5.50 target.
NFA
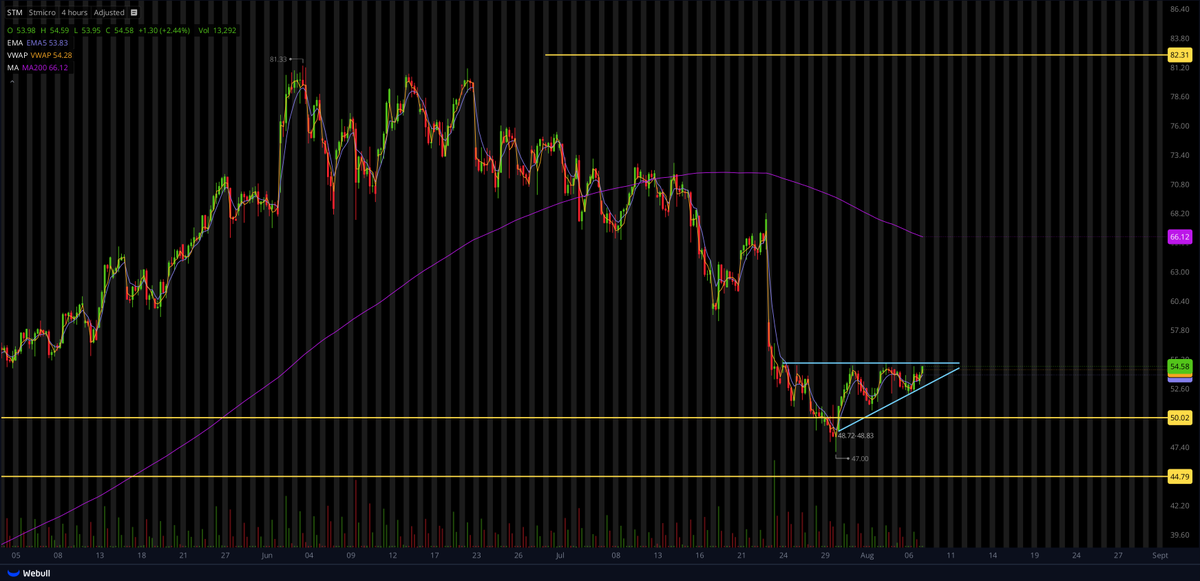
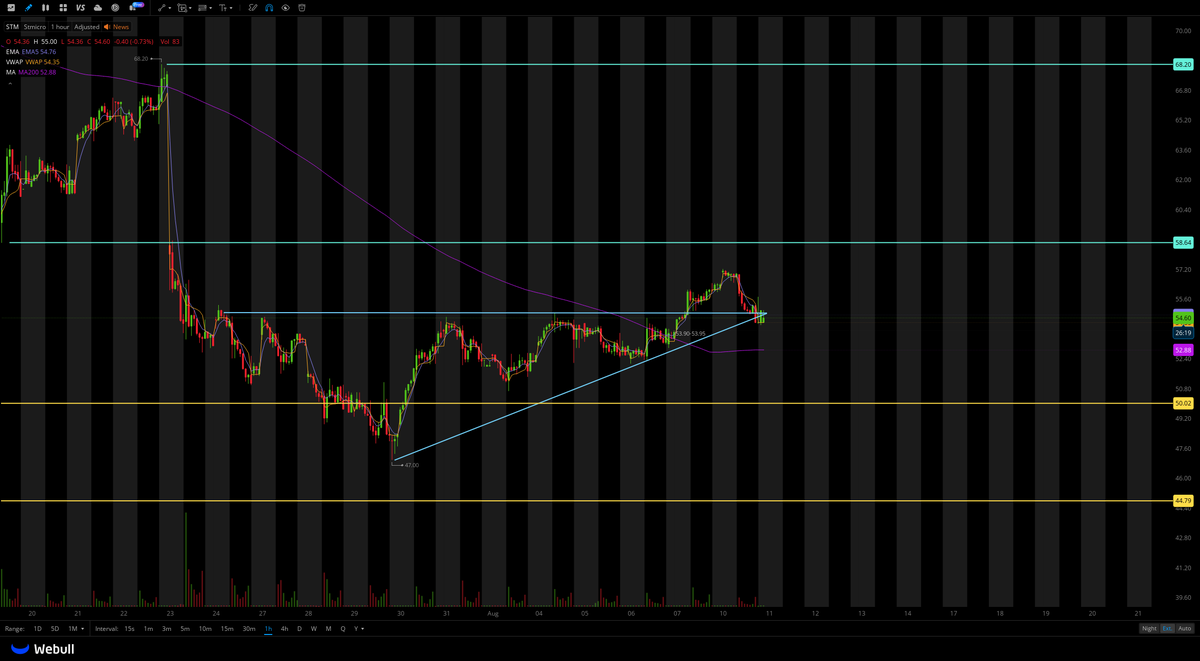
$STM - STMicroelectronics is playing out exactly as expected with a clean breakout from the wedge, followed by a textbook retest of the $54.95 support level today.
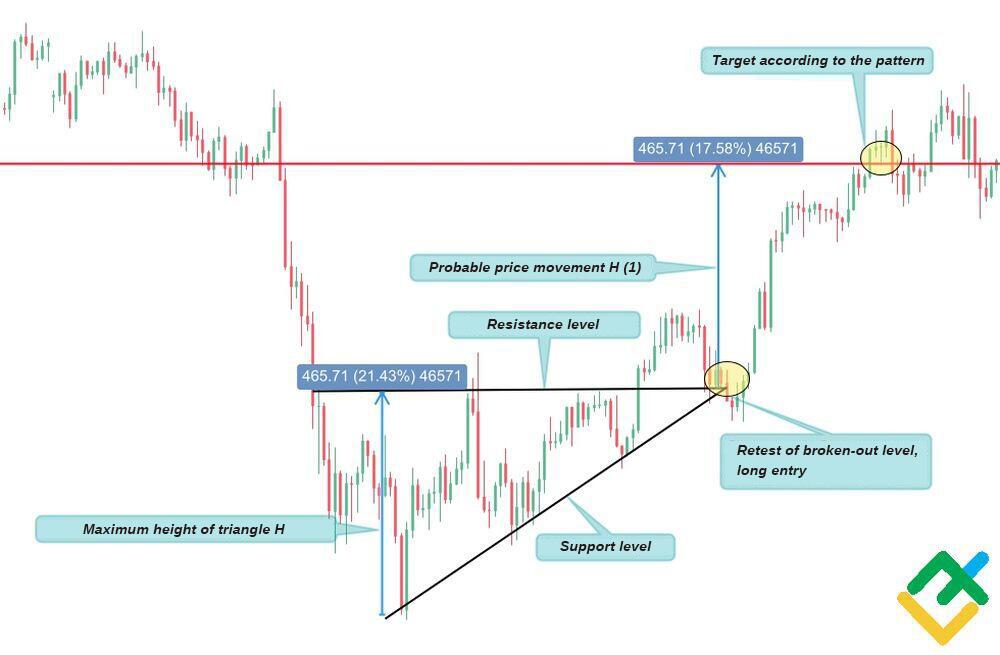
Looking back at the reference chart from my last post, the price action is virtually identical, right down to today's retest of support.
The next few sessions will be crucial to confirm whether this continuation has real momentum, and I am actively considering opening a position here as the risk-to-reward ratio turns very favourable.
NFA
$STM - STMicroelectronics is squeezing nicely into this bullish wedge. Not much to say here, but if we break above the blue resistance line ($54.95) and then retest it for support, it's a no-brainer entry.
Text book ascending triangle from a downtrend here, looks identical to the reference image.
Keeping a close eye on this!
NFA
$STM - STMicroelectronics is squeezing nicely into this bullish wedge. Not much to say here, but if we break above the blue resistance line ($54.95) and then retest it for support, it's a no-brainer entry.
Text book ascending triangle from a downtrend here, looks identical to the reference image.
Keeping a close eye on this!
NFA
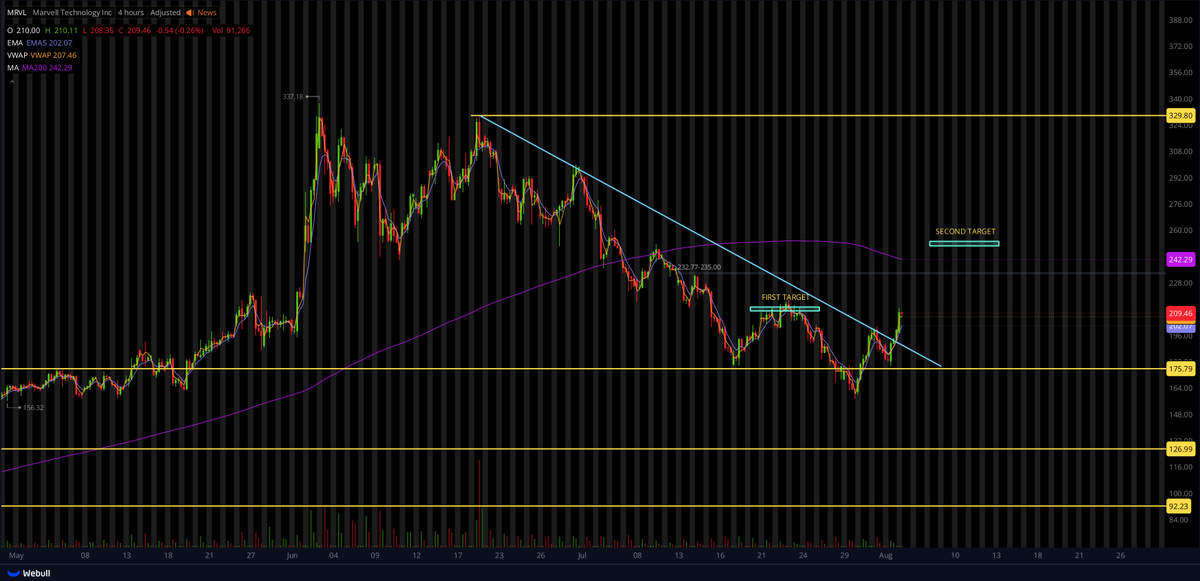
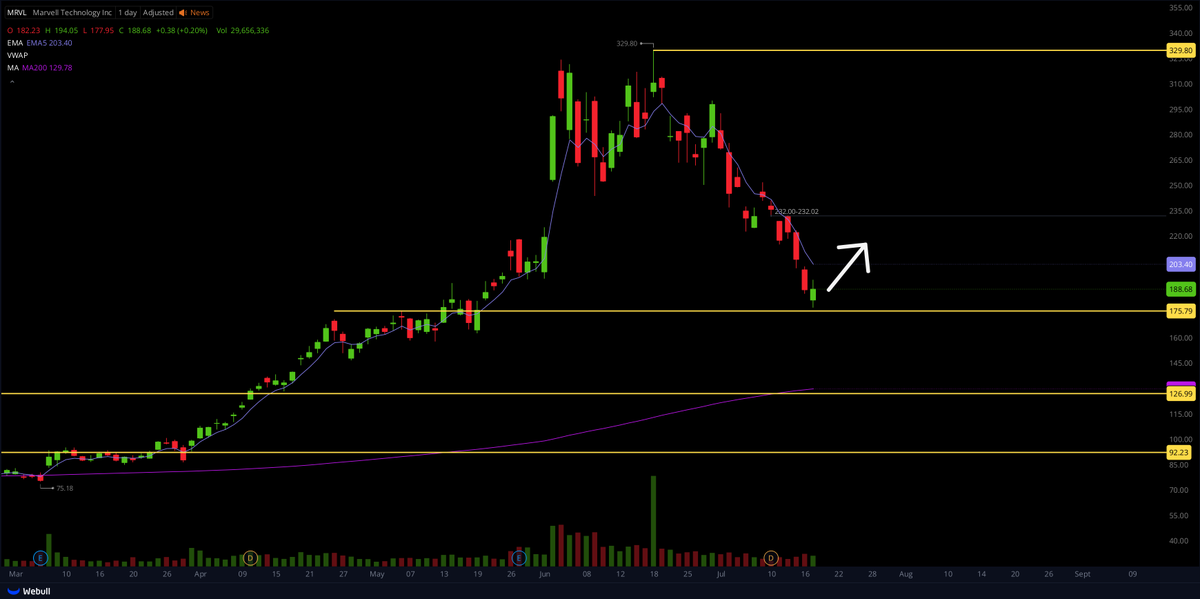
$MRVL - Marvell Technology appears to be breaking out of its multi-week downtrend line after hitting our first price target perfectly around $210, followed by a clean retest and hold of the primary $175 support level.
With the downtrend line now behind us, the path towards our second target at $250 – $255 (converging near the 200MA) is wide open. If this relief rally maintains momentum, we could see that target tested sooner rather than later.
Marvell officially announced it will report its Q2 earnings on Thursday, August 27th.
NFA
$MRVL - Marvell Technology is starting to look quite attractive at these levels. After a sharp -40% correction from its recent all-time highs near $330, the stock has found major buyers and is trading near the critical $175 support level. This is the exact key level it originally broke out of back in May, making it a highly significant structural floor.
Looking closely at the 1-hour chart, the diagonal blue trendline is finally beginning to break to the upside. We have witnessed a couple of fakeouts during this multi-week downtrend, so it is vital to stay cautious and keep a tight stop-loss intact so you don't get burned.
The initial setup looks highly promising. I suspect we see a short-term relief movement up toward the $210 area to hit our first target. If the price encounters a slight pullback there and manages to form a higher low, it will officially confirm that the macro bearish trend has broken and the next major leg up is underway.
NFA
$MRVL #MRVL
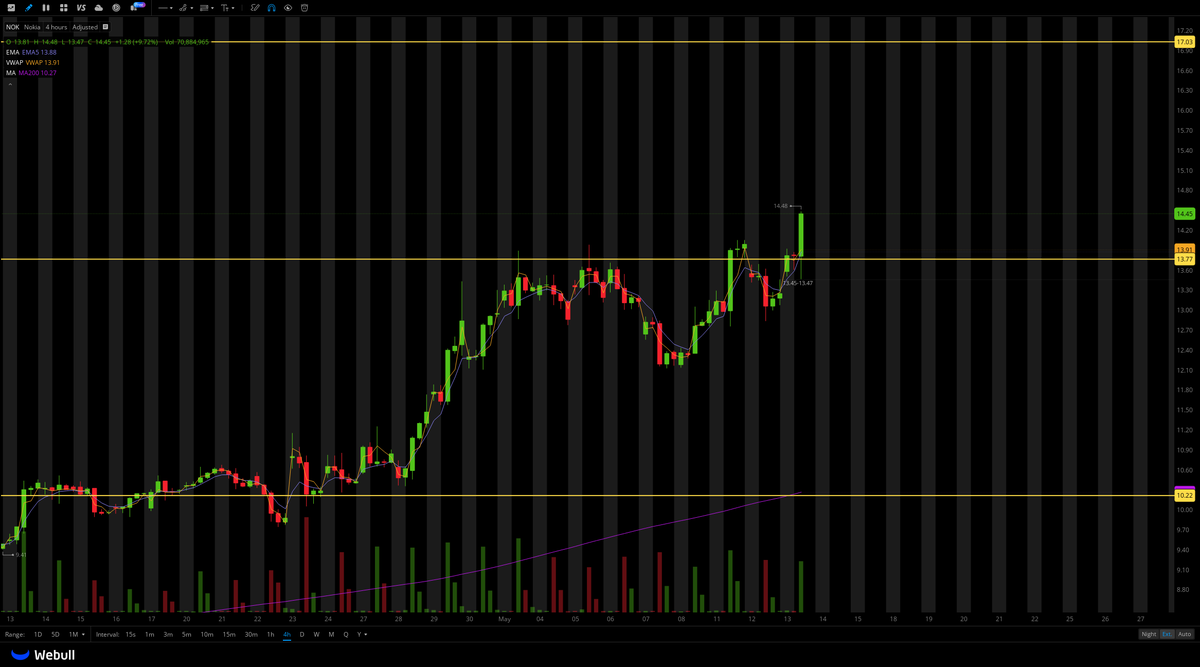
$NOK - Nokia has experienced a massive drawdown from its 52-week highs near $17. The stock is currently holding support remarkably well right at the critical $10 level. While we should prepare for some short-term turbulence around this area, a vital technical floor is clearly established.
The structural setup looks appealing for anyone waiting to build a position in this name. As highlighted in the image, the price action is wedging tightly inside the white box right above the horizontal support line. This correction has brought the asset back down to an attractive discount relative to the heavy insider buys that were previously announced around the $15 level.
The ultimate catalyst is right ahead of us. Nokia is scheduled to release its Q2 financial results pre-market this week on Thursday, July 23.
If this major $10 support level holds firm through the upcoming report, it could serve as the ultimate launching pad for a macro reversal.