@consult_ant @ninjavizlouis Cheers!
There's a chart with blank shapes that floats over the reset button (1-100 on both axis). Every point is populated, so when it's clicked the X and Y co-ordinates are multiplied and passed to a "seed" parameter to generate a pseudo-random number...
@consult_ant
You might like this Ant.
It's my first steps in making a quiz game. Hitting the reset button randomly changes the questions displayed. Well, pseudo-randomly anyway!
I'm probably gonna call it "Our Survey Says..." 😵💫
https://t.co/VJla7skUf0
#datafam
Don't forget the Tableau Newbies User Group later today! Dynamic measure formatting and some Tableau Prep as an extra bonus too.
The last 15 minutes are scheduled for "fun time" which definitely sounds interesting! 😁
https://t.co/9DA3fUaFoc
@consult_ant Thanks Ant!
My next idea is to create a RPG in Tableau. Working title of "Ug the Barbarian". You can interact with the inhabitants of the land or just whack them with your club. Check out stats before combat, an inventory screen etc.
It'll be a jaw-droppingly pointless folly. 😁
#datafam
I've just put my final submission in for The Data School - yay! 🙂
It has a nifty little toggle switch to change between "story" and "analysis" mode. I can see a few potential uses for it…
Link is below and any feedback is much appreciated.
https://t.co/5aq4TEAx2X
@consult_ant Nice to see you too Ant - and I have to say your daughter has some great keyboard skills! 😁
There's a slim chance (about 100%) that I may have sprayed coffee over my keyboard when my name came up..
Thanks to everyone at the Tableau Public User Group for a fun and fascinating meeting. That was my first and I've RSVPed for the next one already! 👏
Oh, and I'm still in shock that I won a gift certificate! 😁
#publicTUG#datafam
@sarahlovesdata@datavizfairy@consult_ant Thanks Sarah!
I've been lucky to have a dataset that rewards delving deep into the data. Seeing the impact of major historic events and the realisation that each row refers to something that may have had a profound effect on people... data can be a bit humbling sometimes. 🙂
Yesterday's Financial Services Tableau User Group was fantastic and I learnt so much!
Thanks to the following for organising and speaking at a great night: 🙂👍
Simon Rowe @mrroweuk
Danny Lambert
@DiegoTParker
Louise Le @FeedMeData_@NickBowskill
@datavizfairy I did Shreya! The speakers were awesome and I'm surprised more non-finance people haven't got wind of how good this TUG is. 👏
It was fantastic meeting you too, and as a bonus I also met Lydia @lydiaaa_wren and Ant @consult_ant
as well. Three of my Tableau faves in one night! 🤩
As always, beautiful design and data that can be instantly understood! I'm convinced Shreya sprinkles each dashboard with her magical data-viz-fairy dust. 🙂
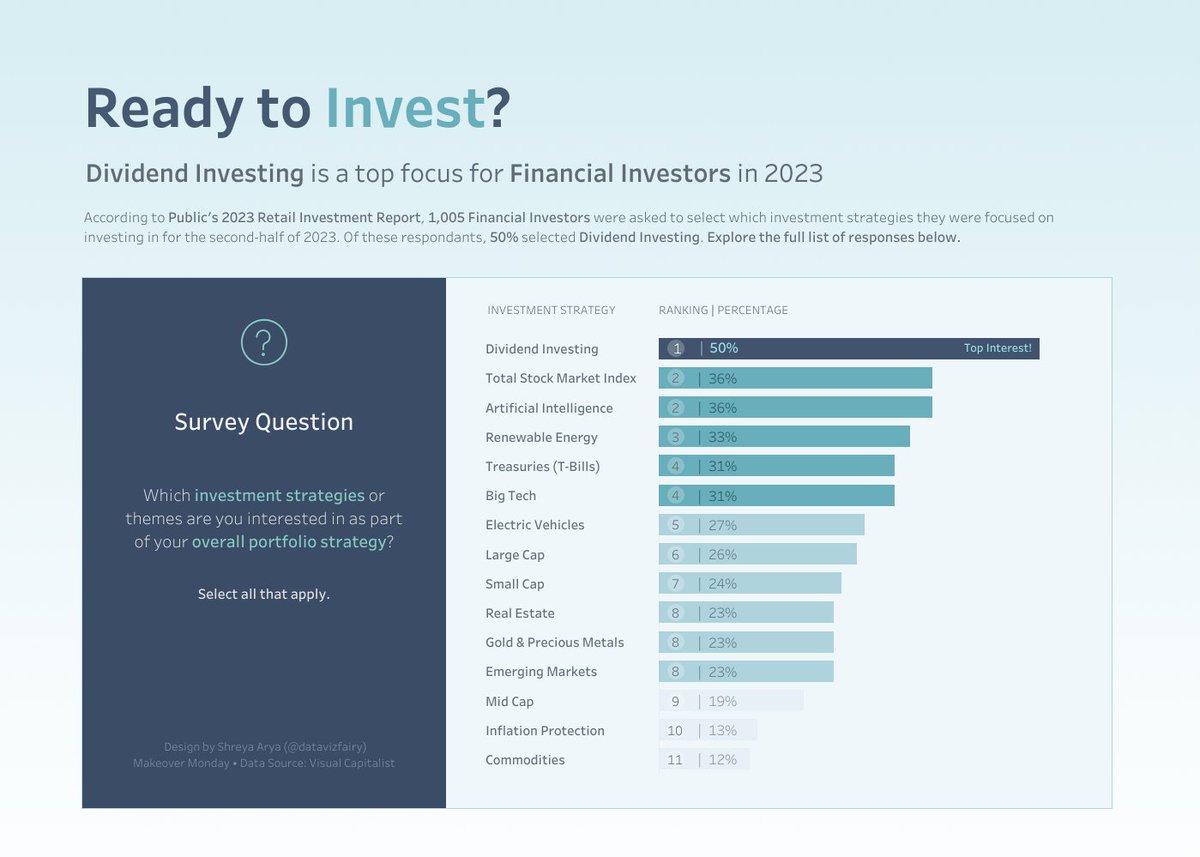
Makeover Monday (Week 41, 2023)
Ready To Invest? 💸
Dividend Investing is a top focus for Financial Investors in 2023, explore the full list in the viz below...
Viz: https://t.co/Q2GyDIB5lQ
Thanks @VizWizBI#makeovermonday#datafam
@SerenaPurslow@tableaupublic@figma I love your "Regional Changes in Average Temperature" dashboard!
It almost seems like the data wanted to get in on the aesthetics and made itself as pretty as possible. 🙂
Bitwise Extraction in Tableau with Examples and Explanation
#datafam
Something I found fun to do when playing with this week's #makeovermonday data. It involves taking a measure and breaking it down into its binary components (e.g. 50 = 32 + 16 + 2).
https://t.co/mEKEr4lcFM
I forgot to tag @RodyZakovich and @LukeStanke !
Thanks guys for posting this little challenge. I just want to let you know, people like me are still having fun and learning from it over 5 years after you created it. Your work is really appreciated. 🙂👍
My first ever #WorkoutWednesday Yay! It was one of the #WowEssentials so it broke me in gently (wow2018 wk4). It was actually a lot of fun and it's great that there's so many for me to play with. 🙂
Explanation to follow...
https://t.co/0rXuGegP2P