We're LIVE !!!
https://t.co/lnjDQ817e9
The 30 year Wall Street Tech veteran is giving his latest A.I. update and answering YOUR Q&A with our global audience of 1O,OOO investors... NOW on Stock Talk Live! https://t.co/gKI6RpTIfx
We highlighted $AEHR @ 3, $NVDA @ 40, $MU @ 100, $ARM @ 100, $MRVL @ 70, $KRKNF @ $0.60, $OPTX @ 4.50 (and over 50 other triples) 🚀
More importantly, we showed you how to GET OUT opportunistically. What are the right moves NOW?
Stock Talk Live is LIVE... NOW !!!!! https://t.co/lnjDQ817e9
🔥𝟏𝟓 𝐲𝐞𝐚𝐫𝐬 𝐨𝐟 𝟒𝟎% 𝐚𝐧𝐧𝐮𝐚𝐥 𝐫𝐞𝐭𝐮𝐫𝐧𝐬!!🔥
NO picks closed at a loss since MAY... of 2024 !
What do you expect from the guy who literally...
* Sold picks to Wall St in the '99 bubble
* Was paid by JIM CRAMER'S funds!
* Called the rise/fall of MoviePass (& was in the movie!)
$AAOI, $AEHR, $AVEX, $AVGO, $CLFD, $CRM, $CURI, $CVV, $CXDO, $DELL, $DBOXF, $DRSHF, $EVLV, $GEODF, $GKPRF, $HIMX, $IDN, $INFU, $IREN, $ITMSF, $IWM, $IZEA, $KRKNF, $KRMD, $MRVL, $MU, $NOW, $NVDA, $OKTA, $OPTX, $RDCM, $SMCI, $SPCX, $TPCS, $TRAK, $TSSI, $TWLO, $VTSI, $WATT
For those looking for it, my "Finding Multibaggers" Spaces (https://t.co/E1TJmbX8Aa) & "Making Millions" video on YouTube (https://t.co/fzyw6Mecxr) are the two most critical episodes for anyone following my work.💰
Gave you $AVEX on the day it IPO'd (40 PT -- achieved!) and again on my weekly show Friday after traders wrongly sold it off after earnings🔥🚀
30 years of Wall Street experience at work. Direct link to my assessment
https://t.co/5infy1DL64
He also picked $AEHR @ 3, $WATT @ 12, $NVDA @ 40, $MU @ 100, $ARM @ 100, $MRVL @ 70 etc 🚀
🔥𝟏𝟓 𝐲𝐞𝐚𝐫𝐬 𝐨𝐟 𝟒𝟎% 𝐚𝐧𝐧𝐮𝐚𝐥 𝐫𝐞𝐭𝐮𝐫𝐧𝐬!!🔥
1O,OOO global followers
NO picks closed at a loss since MAY... of 2024! What do you expect from the guy who literally...
* Sold picks to Wall St in the '99 bubble
* Was paid by JIM CRAMER'S funds!
* Called the rise/fall of MoviePass (& was in the movie!)
* Lived one town from Roaring Kitty 😹
$AEHR, $CTLP, $CURI, $CXDO, $DELL, $DRSHF, $GEODF, $GKPRF, $GLD, $IDN, $INFU, $ITMSF, $IWM, $IZEA, $KRKNF, $MOB, $MU, $NVDA, $OPTX, $SMCI, $TPCS, $TRAK, $TSSI, $TWLO, $VTSI, $WATT
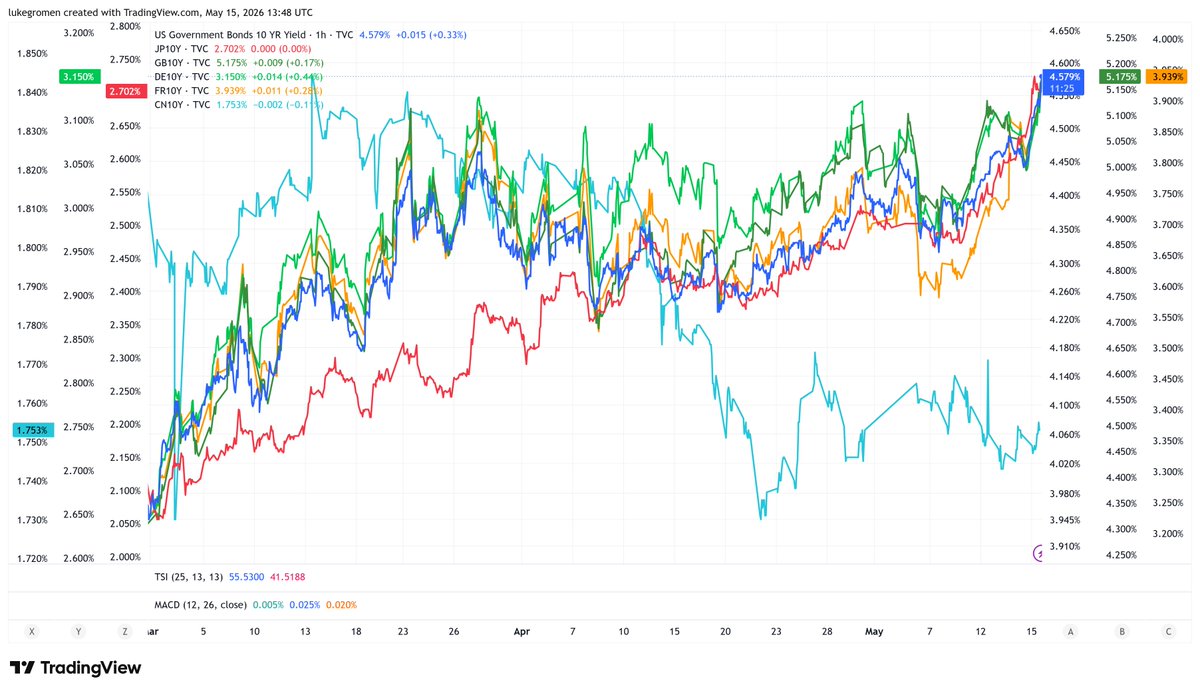
10y government bond yields of US, Japan, UK, Germany, France, and China since the beginning of the Iran war.
China = aquamarine line
If the Iran war strategy was "choking out China's oil supplies", it's time to reconsider the strategy.
People questioned when I exited $IDN at $6.61. Some even laughed when it popped above $9 (which is silly - what do I care?? 😂), but I'm not here to ride momo or capture every dime of profit. I'm here to follow the process I was taught, which pays me millions literally year after year after year.
Those who held on through this morning would love to get $6.61 right about now.
More on Friday's show
https://t.co/lnjDQ817e9
🔥𝟏𝟓 𝐲𝐞𝐚𝐫𝐬 𝐨𝐟 𝟒𝟎% 𝐚𝐧𝐧𝐮𝐚𝐥 𝐫𝐞𝐭𝐮𝐫𝐧𝐬!!🔥
NO picks closed at a loss since MAY... of 2024 !
What do you expect from the guy who literally...
* Sold picks to Wall St in the '99 bubble
* Was paid by JIM CRAMER'S funds!
* Called the rise/fall of MoviePass (& was in the movie!)
* Nailed $DWAC before it was $DJT
* Lived one town from Roaring Kitty 😹
$AEHR, $CTLP, $CURI, $CXDO, $DELL, $DRSHF, $GEODF, $GKPRF, $GLD, $IDN, $INFU, $ITMSF, $IWM, $IZEA, $KRKNF, $MOB, $MU, $NVDA, $OPTX, $SMCI, $TPCS, $TRAK, $TSSI, $TWLO, $VTSI, $WATT
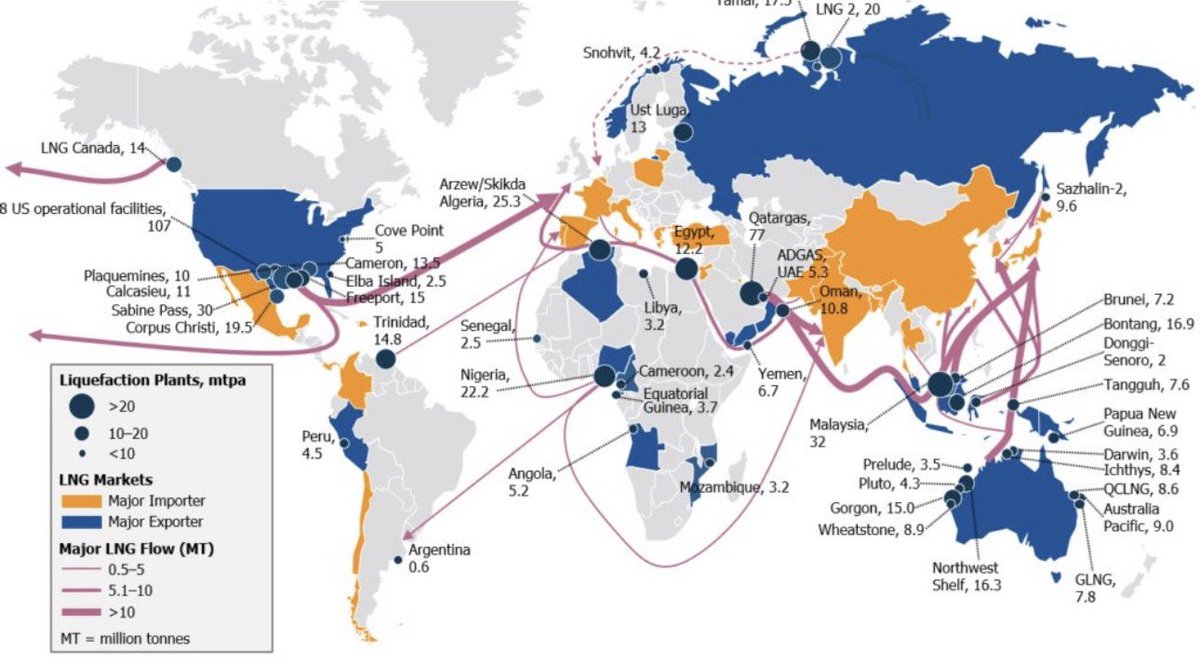
Qatar declared force majeure on Europe.
This map shows exactly why that's a catastrophe.
Look at the LNG flows hitting Asia those thick pink arrows.
Qatargas alone: 77 mtpa. The biggest single LNG facility on earth.
Now it's partially offline.
The damage ripples everywhere:
🇯🇵 Japan almost entirely dependent on Qatar + Gulf LNG
🇰🇷 South Korea same
🇨🇳 China 5.2 mb/d oil AND massive LNG imports from the Gulf
🇪🇺 Europe already scrambling, now Qatar contracts cancelled overnight
And the replacement options?
🇺🇸 US 8 facilities, 107 mtpa. Fully operational. Prices surging.
🇦🇺 Australia Northwest Shelf, Gorgon, Wheatstone. Long way from Europe.
🇷🇺 Russia sanctioned. Not an option for the West.
Every thick pink arrow on this map that used to flow from the Gulf?
Needs a new source.
Right now.
There's only one country with the capacity, the infrastructure, and the political will to fill it.
subscribe to my newsletter link in bio
Le marché envoie parfois des signaux qu’il ne comprend pas lui-même et ce graphique en fait partie.
Il est très intéressant de voir à quel point les producteurs de métaux précieux affichent aujourd’hui des niveaux de rentabilité rarement observés dans leur histoire, avec des ROE qui n’ont rien à envier à certains segments de la tech ou des biens de consommation à forte marge. Pourtant, on peut voir qu’ils continuent d’être valorisés avec une décote structurelle et une forme de méfiance, comme si le marché avait la certitude que ces profits n’étaient que transitoires, fragiles ou non reproductibles du fait de la hausse récente des coûts énergétiques.
Un décalage de cette ampleur n’est jamais anodin, car il traduit une conviction implicite du marché, celle que nous sommes face à un pic cyclique, et non à un changement de régime.
Or cette lecture pourrait s’avérer fausse ou à minima incomplète, car ce que les modèles traditionnels peinent à intégrer, c’est la nature même du cycle en cours.
En effet, contrairement aux mouvements spéculatif de la fin des années 70 ou de 2011, nous sommes sur un cycle où les contraintes d’offre deviennent structurelles, ou les métaux sont devenus une arme de domination stratégique, où la discipline capitalistique des producteurs s’est renforcée après une décennie de destruction de valeur et où la demande d’actifs réels et tangibles se reconfigure dans un environnement de fragmentation monétaire et de pressions inflationnistes latentes.
Dans ce contexte, la rentabilité actuelle des producteurs pourrait ne pas être une anomalie mais plutôt une nouvelle norme en formation, et si tel est le cas, alors la question n’est plus celle du niveau des prix des métaux, mais celle du multiple que le marché est prêt à accorder à ces flux de trésorerie.
En d’autres termes, il ne s’agit pas simplement d’un mouvement directionnel sur les métaux, mais d’un possible changement de paradigme dans la manière dont le capital valorise les actifs liés aux ressources réelles et aujourd’hui, les producteurs de métaux précieux génèrent déjà ces flux de trésorerie.
Les marchés peuvent ignorer une réalité pendant un temps, mais lorsqu’ils finissent par la reconnaître, l’ajustement n’est jamais linéaire mais se fait violemment.
Or ce que ce graphique montre, c’est que les producteurs de métaux précieux ne sont pas en train de devenir rentables mais qu’ils le sont déjà et que la seule variable encore en retard, c’est le regard que le marché porte sur eux
Thanks @wmiddelkoop for the chart
We continue our policy of issuing a conservative initial outlook, with updates provided as the year progresses. While we maintain strong exposure to the defense markets, ongoing geopolitical tensions lead us to initially project 2026 at a level consistent with 2025 revenues of $51 million and net income of $3.6 million.
Another conservative guidance by $BOSC, which I expect to be raised throughout the year similar to this year. Also, they now have $11.8M in cash, which is well over 30% of the market cap alone.
@IdLibertes il manque la debt/gdp a votre graphe, il manque le FOREX dollar vs other currencies. pourquoi ca serait bonds vs gold, il y a tellement d autres classes d assets dans lesquels la liquidité peut se deverser (et se retirer aussi)
Gatekeeper Systems has been named to the 2026 TSX Venture 50™ list. The TSX Venture 50 ranks the 50 top-performing companies on the TSX Venture Exchange over the past year.
Thank you to our shareholders, customers, and team. This recognition reflects the momentum we’ve built together.
#Venture50 @TSX_TSXV $GSI.V $GKPRF
JAPAN JUST BROKE THE GLOBAL FINANCIAL SYSTEM AND YOU HAVE 30 DAYS
November 18th, 2025. Japan’s 20-year bond yield hit 2.75%. Highest in recorded history. This single number just ended the 30-year era that made your retirement possible.
The math is simple and fatal.
Japan has 263% debt to GDP. $10.2 trillion total. They survived because rates were zero. At 2.75%, debt service explodes from $162 billion to $280 billion over ten years. That’s 38% of total government revenue consumed by interest alone.
No nation in history has sustained this without default or hyperinflation.
But here’s what kills your portfolio first.
Japan holds $3.2 trillion in foreign assets. $1.13 trillion in US Treasuries alone. They bought everything foreign because Japanese bonds paid nothing. Now Japanese bonds pay 2.75%.
After hedging costs, holding US Treasuries loses money for Japanese investors. Repatriation is not optional. It’s mathematical necessity. $500 billion exits global markets in 18 months.
The yen carry trade holds $1.2 trillion in borrowed yen funding global assets. Stocks. Crypto. Emerging markets. Everything. As Japanese rates rise and the yen strengthens, every position goes underwater. Forced liquidation has already begun.
Three certainties nobody can deny.
The rate gap between US and Japanese bonds collapsed from 3.5% to 2.4% in six months. When it hits 2%, Japanese money floods home. US borrowing costs spike 30 to 50 basis points regardless of Fed policy.
December 18th the Bank of Japan meets. 50% probability they hike again. If they do, the yen surges. Every carry trade loses another 6% instantly. Margin calls cascade globally.
Japan cannot print money to escape. Inflation already exceeds target. More printing collapses the yen and imports inflation. They’re trapped between currency crisis and debt crisis.
The anchor holding global rates down for 30 years just broke. Every portfolio built since 1995 assumed Japanese yields stayed near zero forever. That assumption died today.
Position for chaos or become collateral damage. There is no middle ground.
Full Deep Dive Article - https://t.co/J14xVslTlR
Subscribe for daily premium data driven newsletter.