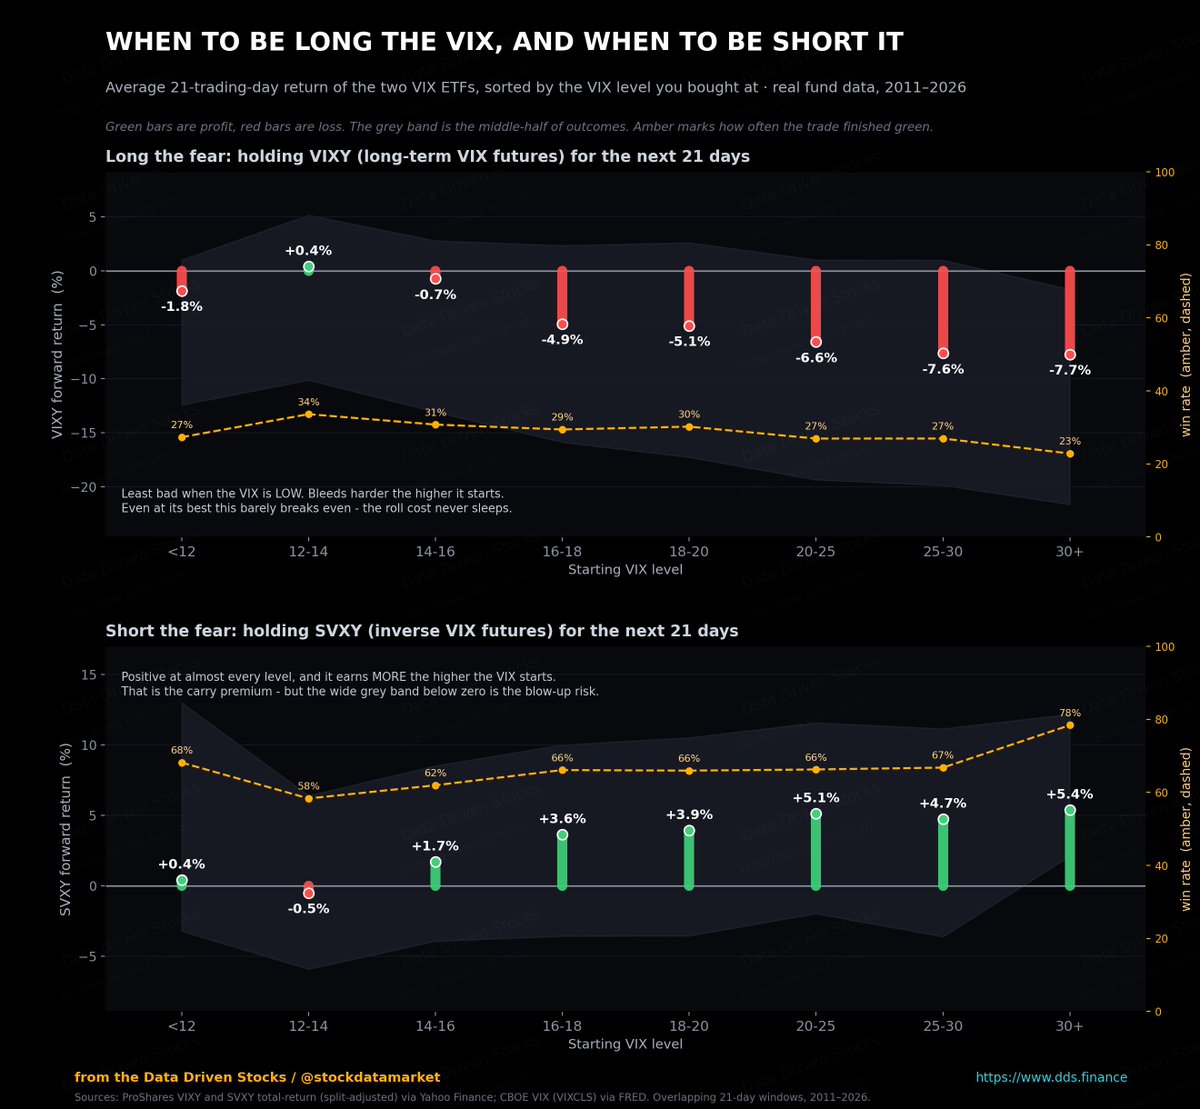
The VIX sits at 15 while everyone is fully invested. Now look at the seasonal map: volatility bottoms in July, then climbs relentlessly into an October peak. Twenty years of data, same rhythm.
Cheap insurance and a calendar that says the storm season starts now.
Nobody buys umbrellas in the sunshine. That's why they're cheap.
H/t @Mr_Derivatives
Have a nice weekend, everyone!
Just kidding, check this out first.
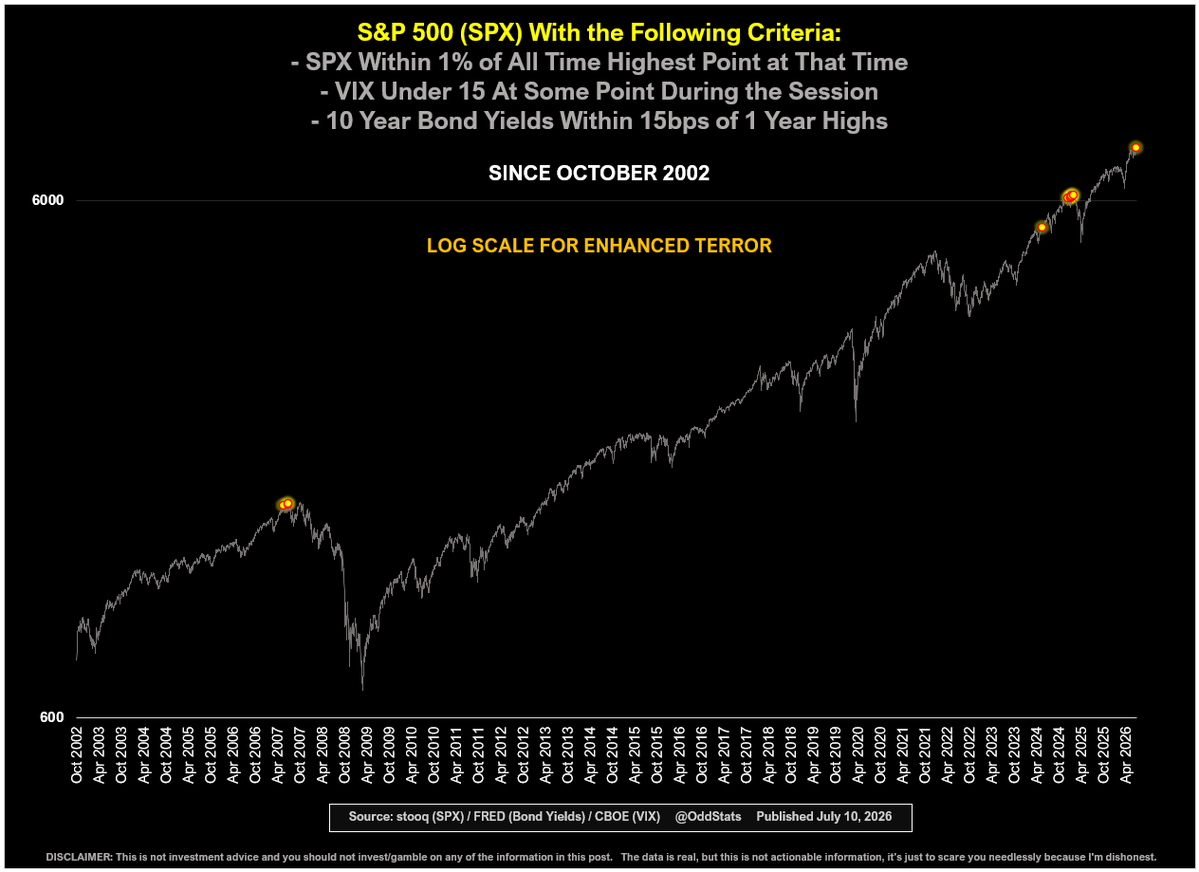
▪ SPX closed within 1% of its all time highest point
▪ VIX was under 15 mid day
▪ 10y yields are within 15bps of one-year highs
And when else has that happened, since 2002?
That last dot is today.
What the VIX did today... The last time it moved like this was June 4, 2026. So either we just witnessed the first regime change in 156 weeks, or next week brings something nobody sees coming. As always
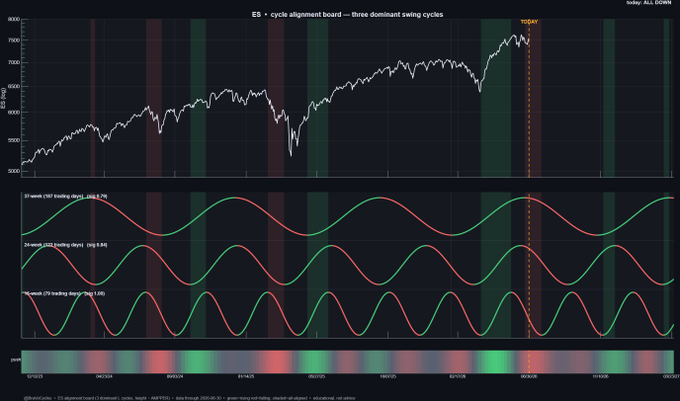
@ThierryBorgeat Did my best to line these up. SPX top pane. Put/Call Skew i bottom pane.
Red verticals are the beginning of each year.
Yellow verticals are P/C Skew collapses.
Green verticals are P/C Skew spikes.
Spikes are associated with bottoms.
Collapses are associated with tops.
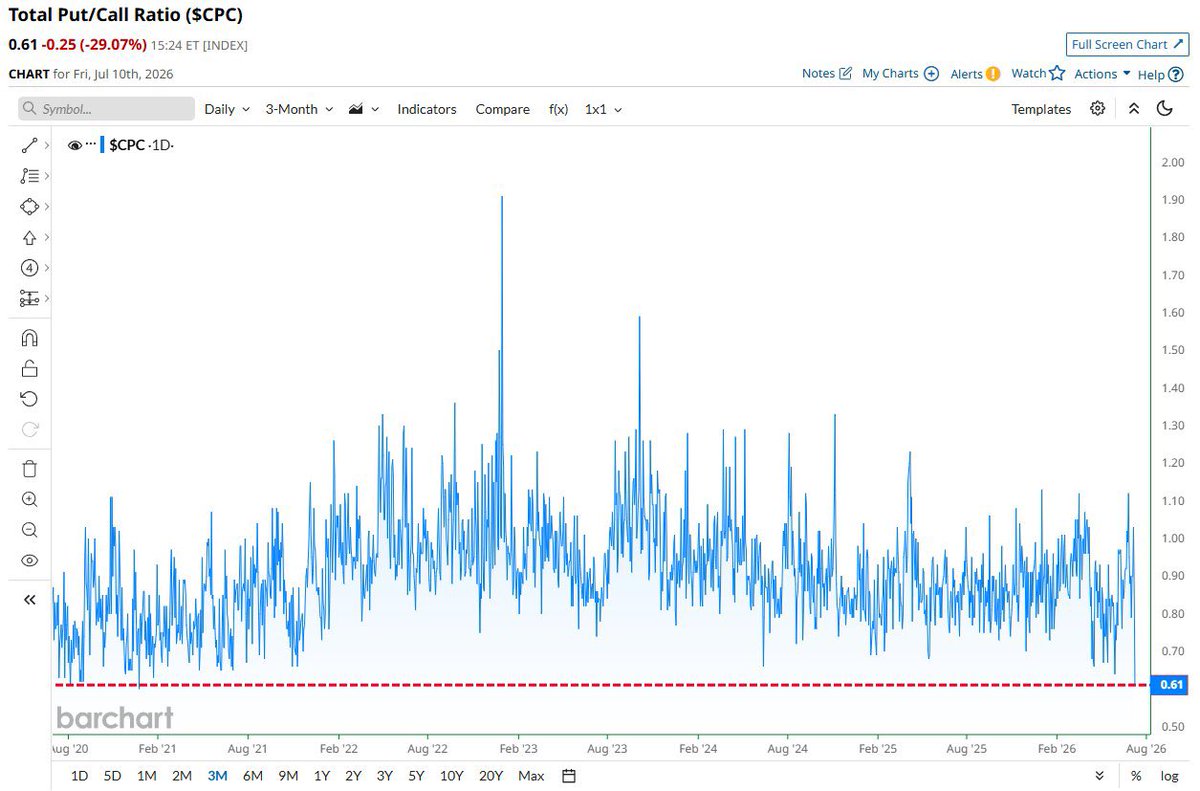
The S&P put/call skew just collapsed to 0.71. Not a low. The lowest reading on record.
The 10-year average is 12. The 2020 panic peaked at 34. We're at 0.71.
What this measures: how much investors pay to protect against a crash versus betting on a rally. At 0.71, crash protection is essentially free. Nobody wants it.
Think about what that means. After two years of gains, at record concentration, with households at record equity exposure, the options market has priced hedging like insurance on a house that cannot burn.
History's lesson is consistent: markets don't crash when everyone fears a crash. Fear is the hedge. This chart says the hedge is gone.
Nobody buys insurance at the top.
That's what makes it the top?
There is no seasonality in the stock market. On average, these moves can be either positive or negative. However, the range can sometimes be enormous. For example, in October, returns have ranged from -20.5% to +11.6%, making small average biases of 0.5% or 1% statistically meaningless.
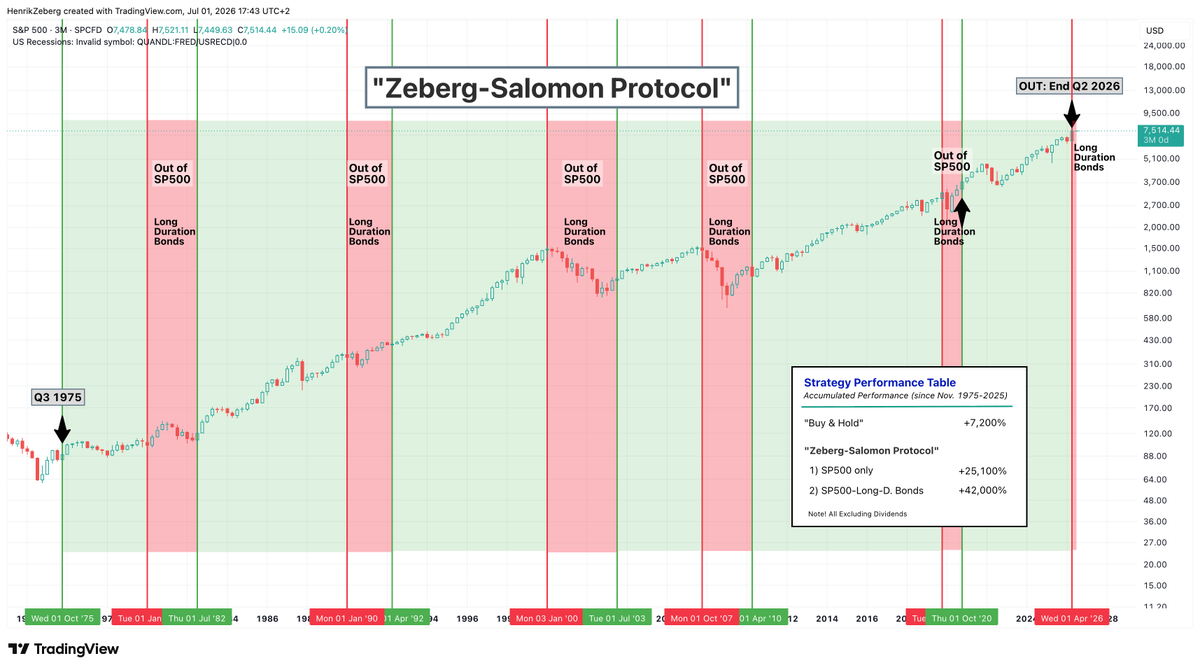
According to the "Zeberg-Salomon Protocol" - today is the day you rotate out of SP500 and into Long-duration US Government Bonds.
Not saying this is the TOP (it is not!) in SP500 - but rates are about to come down - and hence Bonds to rally.
Following the Protocol since 1975 would have out-performed the SP500 by 6X.
Stay tuned!
Yes, the main trend remains bullish for equities, but this chart is a friendly reminder that we are also in one of the most overvalued markets in history.
Retail mania is back to extreme speculative mode!
The financial volume spread between **high beta sectors** 3x leverage etfs (3x long etfs - 3x inverse etfs) is back to "all in" mode.
** Semis, Nasdaq 100 and Tech sector