Excited to start my journey into football analytics 🏈📊
Former D1 offensive lineman learning data from scratch — starting with R and league-wide trends.
Follow along as I break down the NFL through numbers + film insights 💻🔥
#NFLAnalytics#SportsData
It’s no secret why the Bears are the 1 seed in the NFC right now. Ben Johnson has unlocked Caleb Williams, and the bears invested heavily in their OL in the offseason. Seems to me like it’s paying off so far.
"The OL can't block!!"
Well, who’s really to blame for QB pressure?
X = QB Time-to-Throw | Y = Pressure Proxy (1 – PBWR)
Above the trend line + QBs facing more pressure than their O-Line suggests (Hurts OL)
Below the trend line = QBs taking pressure off their line (Helps OL)
@DanSchneierNFL 2 high vs 12p. Also no interior DL getting hands on guards just allowing free releases to the LBs, all tied together with terrible tackling effort
@PFF_Moo I promise this isn’t an Andrew Thomas Fan Page but my oh my. It has been a couple of weeks since you posted this earlier and Andrew Thomas has barely moved from his spot on the graph.
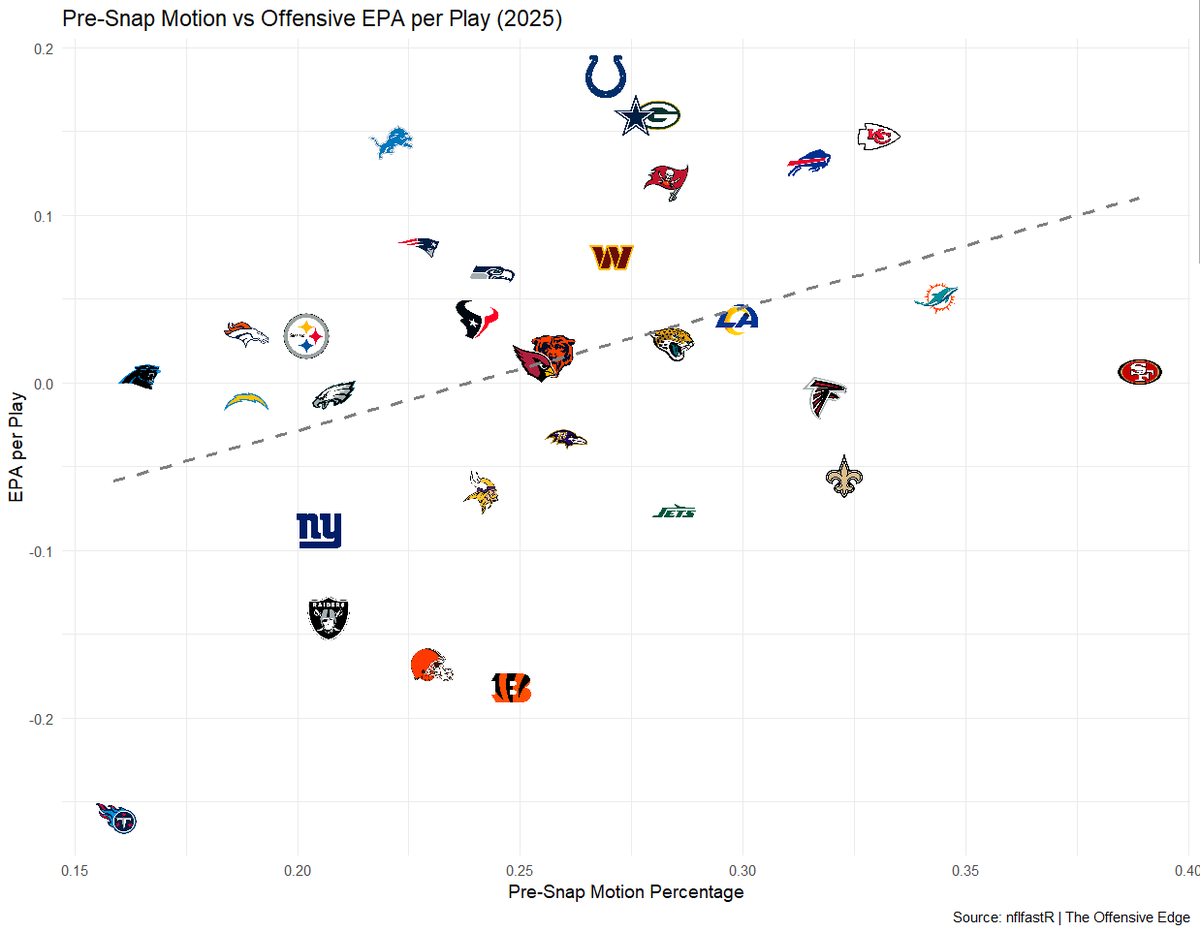
I was always a firm believer/strong advocator for more pre snap motioning- Make the defense show their hand. In my first case study, I wanted to test the correlation between pre-snap motion and offensive efficiency(EPA/play). I'm looking forward to keeping up with this #Data#NFL
Andrew Thomas is one of the best in the game. The numbers support it, and the film shows it. Check out my first YouTube video, where I break down a couple of plays from this past weekend's @allforgod_55 matchup with the 49ers.
https://t.co/YA8ltbWS3K
Midseason! Bringing back a favorite stat:
SCRACK EPA (Scramble EPA + Sack EPA).
Identifying how much a QB helps or hurts his team on called pass plays when he doesn't throw the ball.
Josh Allen still the king, but Bo Nix moving his way up!
Data from @NextGenStats
Some food for thought...
Patrick Mahomes/Chiefs: High OL PBWR + Quick Time-to-throw = High EPA (Below Trend line = Helping OL)
Spencer Rattler/Saints Low OL PBWR + Quick Time-to-throw = Low EPA (Above trend line = Hurting OL)
"The OL can't block!!"
Well, who’s really to blame for QB pressure?
X = QB Time-to-Throw | Y = Pressure Proxy (1 – PBWR)
Above the trend line + QBs facing more pressure than their O-Line suggests (Hurts OL)
Below the trend line = QBs taking pressure off their line (Helps OL)
Elite protection doesn’t always equal elite offense 👀
This chart shows how each NFL team’s average block win rate stacks up against their total EPA.
Colts and Chiefs are cooking with efficiency — but some strong O-lines (Titans, Falcons) aren’t cashing in.
@seattlerams_nfl@gregolsen88@SumerSports 13 Personnel
Usage: 67 plays
EPA/Play: 0.195
Only 67 plays in 13P so far. Still positive EPA. McVay always has a gameplan that puts his offense in the best situation to be successful!
I’d also imagine Puka down the last couple games could be a reason not in 11p (72%) as much
Elite protection doesn’t always equal elite offense 👀
This chart shows how each NFL team’s average block win rate stacks up against their total EPA.
Colts and Chiefs are cooking with efficiency — but some strong O-lines (Titans, Falcons) aren’t cashing in.
Stay Tuned for my next post, where I will be seeing why teams like the Titans and Falcons are "underperformers." For example, who really is to blame for QB pressure (a total play killer), the OL or the QB?