All major corrections in Gold during secular bull markets follow a clear pattern.
Gold just completed its 5th significant drawdown (you could also count 2020 & 2021).
With one exception, they cluster tightly in both time and magnitude:
1973: 28% in 5 months
1975: 45% in 20 months (outlier)
2006: 23% in 5 months
2008: 30% in 7 months
2020: 20% in 7 months
2022: 22% in 6.5 months
Current: 27% in 5 months
The typical correction: 23%–30% over 5–7 months.
1975–1976 is the only true outlier and today looks nothing like that period.
The worst is over.
This chart, illustrating how central bank direct holdings of gold now exceed those of U.S. Treasuries for the first time in some thirty years, is attracting significant attention.
#gold#centralbanks#markets#bonds
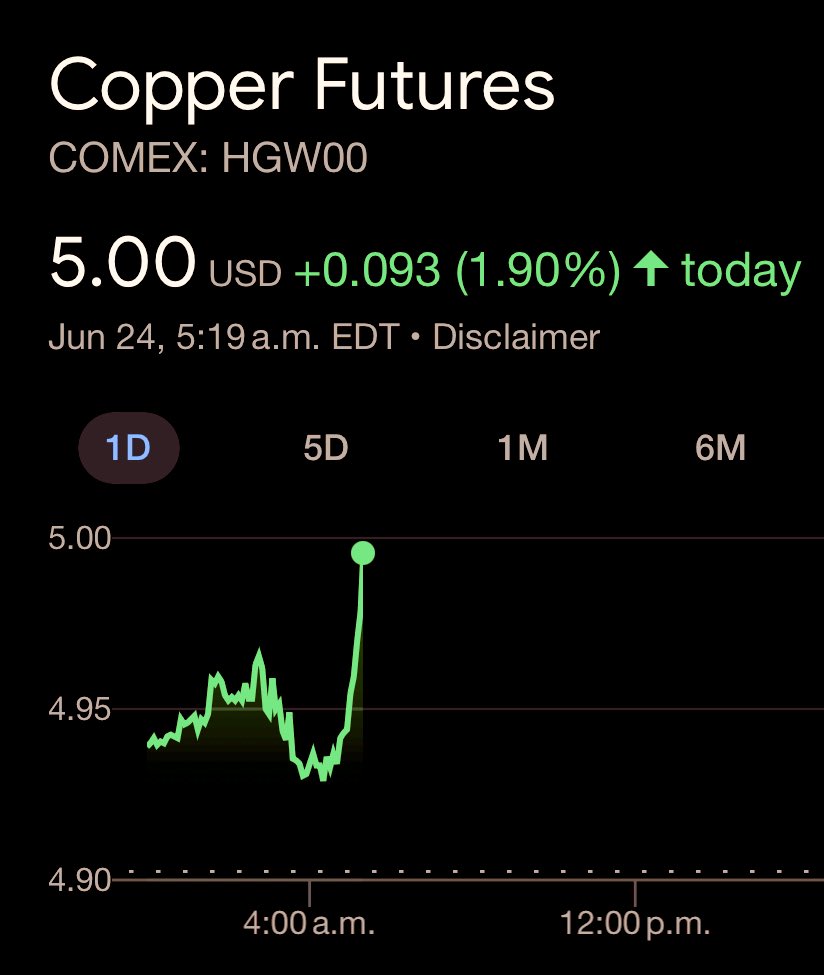
Copper Supply: Chile’s state-owned copper giant Codelco, the world's largest copper miner (beside BHP), is warning that national production could stagnate at about 5.5 million tons per year as the industry faces mounting challenges ⚠️⛏️
This is 1,300 litres per second of water, as part of the Stage 2 dewatering of the Kakula Mine. Pumping rate to double from mid-September to 2,600 litres per second
Goldman Sachs on copper: The ongoing US Section 232 copper investigation continues to drive an unusually wide gap between COMEX (US) and LME (UK) prices, resulting in the US over-importing ~400kt of copper so far this year. US inventory has risen to over 100 days worth of consumption, up from just 33 days at the beginning of the year.
We upgrade our 2H 2025 LME copper price forecast to an average of $9,890, up from $9,140 previously. We expect the copper price to rise to a peak for the year of $10,050 in August due to the tariff-driven reduction in ex-US stocks, and (2) China sentiment and activity remaining relatively resilient.
@WHLeavitt I was just in Washington for EXIM conference. I would welcome the chance to come back and have my picture taken with the chief Executive.! MAGA!