Hace un rato una costurera ha comentado en TVE que ha perdido su taller de costura en Paiporta (Valencia) tras la DANA, al rato una costurera de Murcia que se acaba de jubilar ha llamado para donarle su taller.
SORTEO
- 2 Libros de Los Secretos de las Tierras Intermedias firmados
- RT a este post
- Seguir a @nuevebits
- Solo ES. Ganadores el 14/06
Muchas gracias por todo el cariño que le dais y le habéis dado a este libro :)
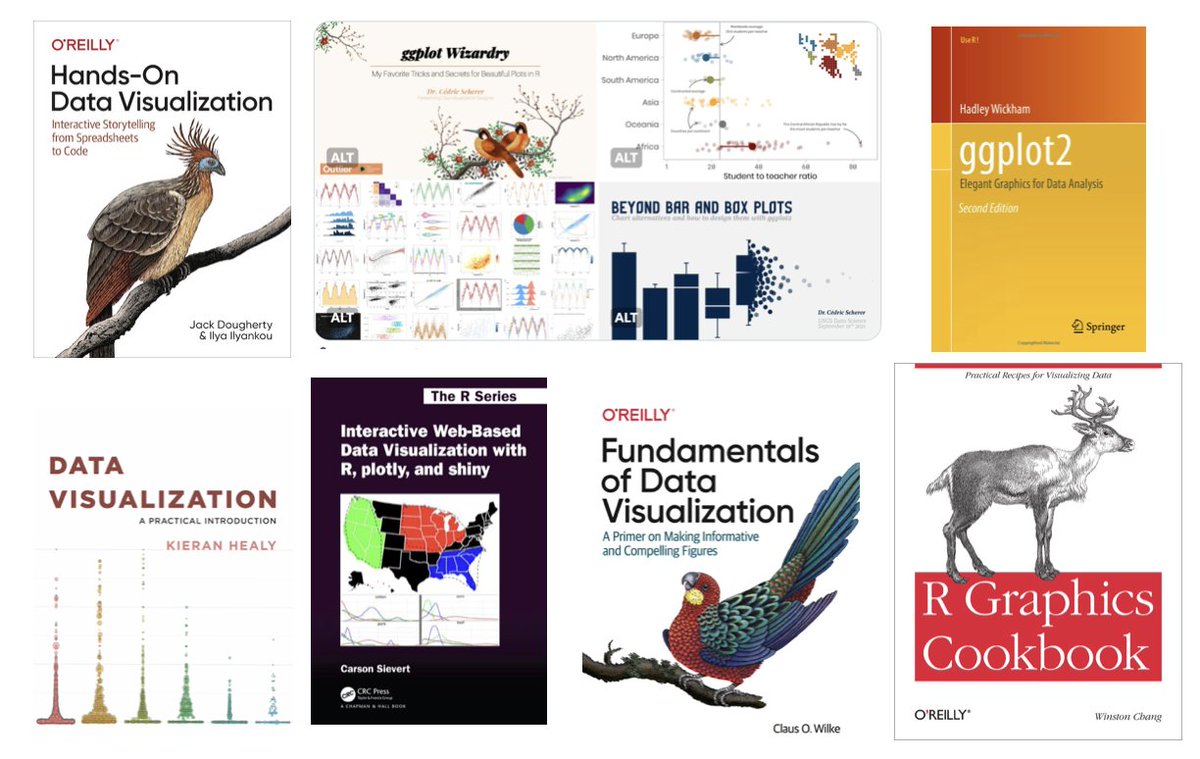
📚Mis recomendaciones para dominar el arte del #DataViz con libros/recursos online y gratuitos.📊💡
✨Crear visualizaciones efectivas es clave para comunicar datos de manera impactante y comprensible.
📖¿Cuál es tu libro favorito sobre el tema? ¡Compártelo! #DataScience#Rstats
Excel for Data Science Complete Study Plan 🚀
The timeline of 30 days and you have to dedicate at least 1 hour a day.
Week 1: Basics of Excel
Day 1-2: Excel Basics
https://t.co/ecWfpJw9dl
Day 3-4: Understanding Formulas, Functions and Formatting
https://t.co/LfcuAQ1ZDX
Day 5-7: Practice Basic Operations
Practice: Start by working on simple datasets, performing basic arithmetic operations, and using functions.
Datasets: https://t.co/p8NHqsiW1k
Week 2: Data Manipulation
Day 8-10: Sorting, Filtering, and Data Validation
Sorting and Filtering: https://t.co/ThWE4m5WfF
Data Validation: https://t.co/HkbEebW8kI
Day 11-12: PivotTables
Resource: https://t.co/PymxBY2xYp
Day 13-14: Practice Data Manipulation
Practice: Work with moderately complex datasets, practice sorting, filtering, and creating PivotTables.
Example: https://t.co/RwLbSwNHnq
Week 3: Advanced Functions and Analysis
Day 15-20: Advanced Functions
Resource: https://t.co/uRiRZH0auj
Day 21-22: Statistical Functions and Analysis
Resource: https://t.co/wfksZfWvBV
Week 4: Visualization and Presentation
Day 23-25: Charts and Graphs
https://t.co/ARX3xFfx9a
Day 26-28: Advanced Visualizationhttps://www.youtube.com/watch?v=HrqgBhZDWUg&list=PLDO6p2ilGI3EkDJZtQqi3VUdnIhW6lQUu
Day 29-30: Final Projects and RecapPractice: Apply learned skills to create comprehensive visual presentations using Excel.
Example Project: https://t.co/g9EX4w92gI
Datasets: https://t.co/p8NHqsiW1k
Throughout the Month:
Review and Practice: Regularly revisit previous topics, practice, and work on sample datasets to reinforce your learning.
👀Si te perdiste (como yo) las Charlas y Talleres de posit::conf(2023), ya puedes verlas online y aprender de:
👉Pruebas A/B
👉Mantenimiento confiable de modelos de#ML
👉Conformal Inference con Tidymodels
¡Y más!
https://t.co/ZB1Yng1YA2
#RStats#DataScience#stats#analytics
Data warehouse schema designs
In most transactional databases that are used, the data is normalized to reduce duplication.
In a data warehouse, however, the dimension data is generally de-normalized to reduce the number of joins required to query the data.
Often, a data warehouse is organized as a star schema.
The fact table is directly related to the dimension tables, as shown in this example:
The attributes of an entity can be used to aggregate measures in fact tables over multiple hierarchical levels.
For example, to find total sales revenue by country or region, city, postal code, or individual customer.
The attributes for each level can be stored in the same dimension table.
When an entity has a large number of hierarchical attribute levels, or when some attributes can be shared by multiple dimensions.
For example, both customers and stores have a geographical address.
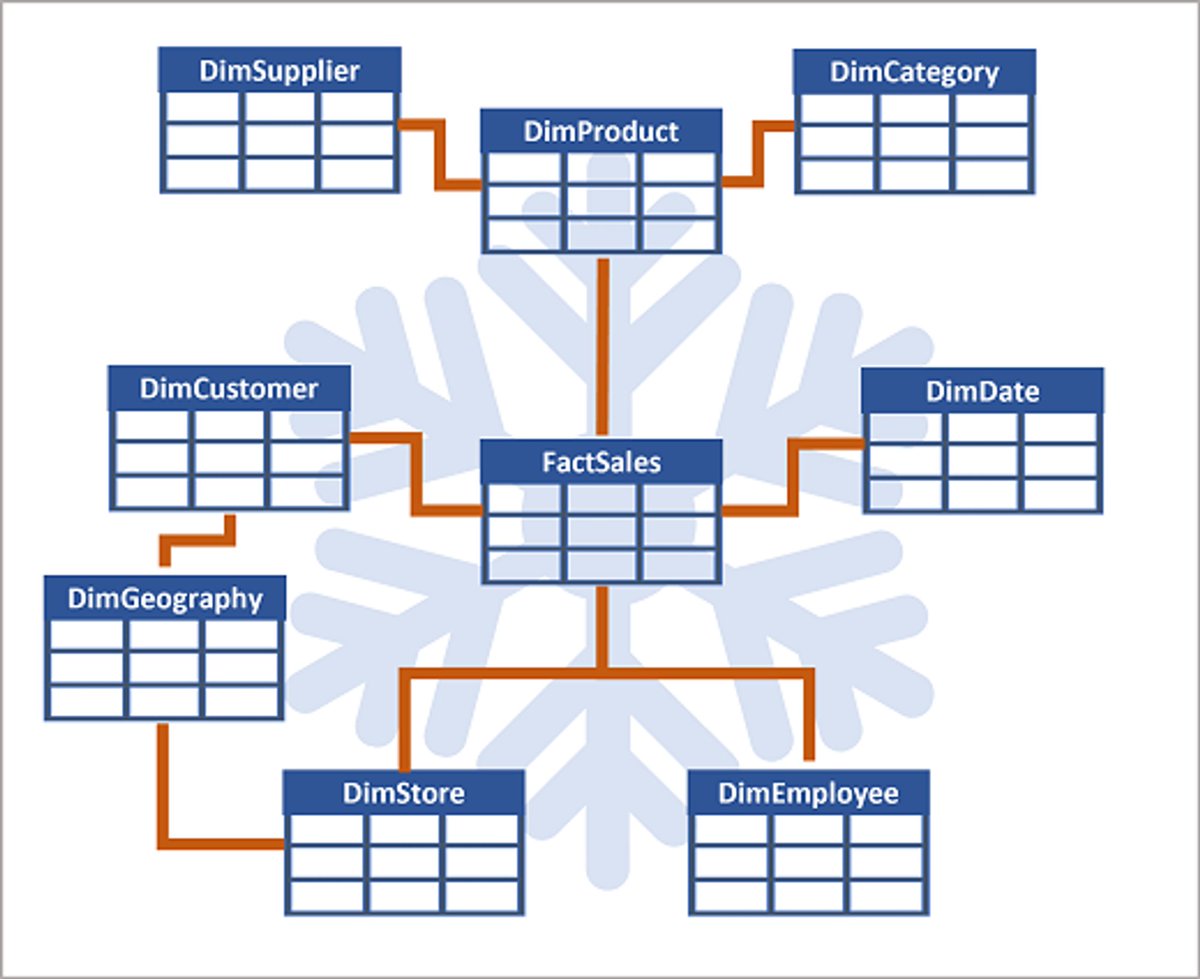
It can make sense to apply some normalization to the dimension tables and create a snowflake schema, as shown in the following example:
In this case, the DimProduct table has been normalized to create separate dimension tables for product categories and suppliers.
A DimGeography table has been added to represent geographical attributes for both customers and stores.
Each row in the DimProduct table contains key values for the corresponding rows in the DimCategory and DimSupplier tables.
Each row in the DimCustomer and DimStore tables contains a key value for the corresponding row in the DimGeography table.
---
That's it!
Leave a Comment a comment of you think!
"Go out and read some ML papers."
That's the most harmful advice for beginners.
They will understand nothing and fall into depression.
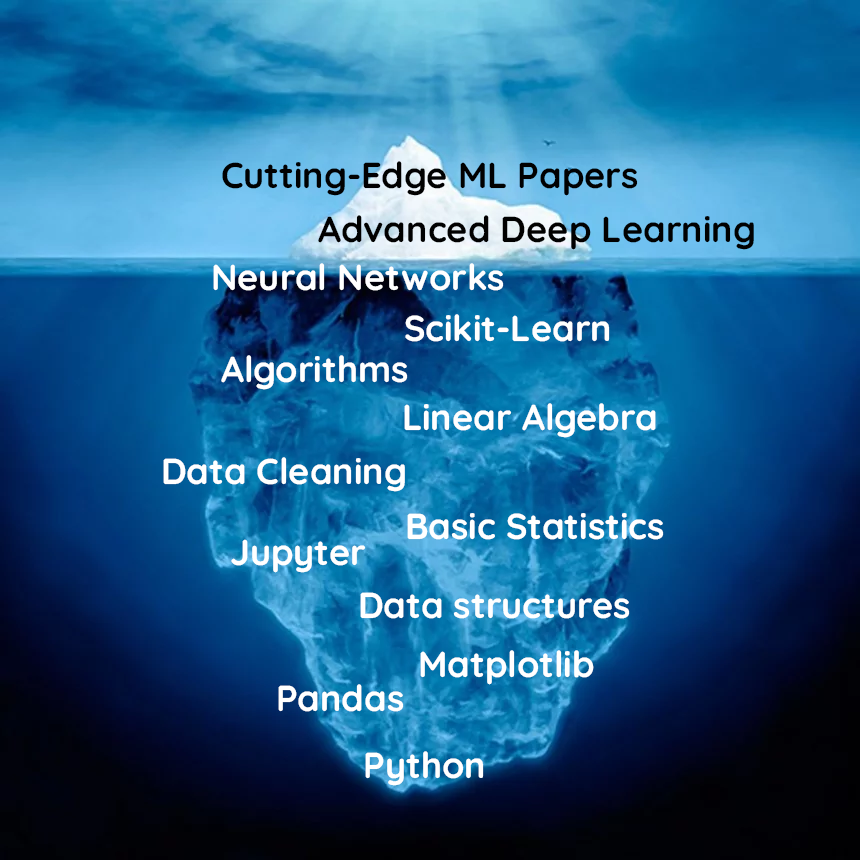
Those papers are the tip of the iceberg.
What they need is deep in the sea.
Start low and build up!