How to read the TidalCore charts I share.
The ribbon is adaptive fair value.
Center line = basis. Outer edges = the band. Setups are considered when price is extended outside the band — not on every touch of the middle.
Color is the regime filter, not a crystal ball:
• Gray = uptrend
• Solid white = strong uptrend (can be set to block new sells)
• Blue = downtrend
• Solid blue = strong downtrend (can be set to block new buys)
Two signal types:
• Normal BUY / SELL - extension beyond the ribbon + filters agree
• Extreme TOP / BOTTOM - priority washout / exhaustion markers. Optional add-on trades, not a guarantee
https://t.co/ExE6SslYWw
The rest + week of 10/12
$NVDA $229 - just above the $228 edge after the Thursday giveback. Edge is support.
$AMD $608 - extended above $558. No add.
$MU $1,029 - structure intact above the $962 basis.
$ANET $217 - still above $201 after the outside trim.
$PLTR $209 - premium intact above $175. That edge is the magnet if it cracks.
$AVGO $362 - still the patience trade, just under the $368 basis. Anthropic/OpenAI buildout guarantees keep the stairstep lean. Needs $368 back.
$GOOG $348 - above the $343 basis. Bias stays constructive as long as that holds.
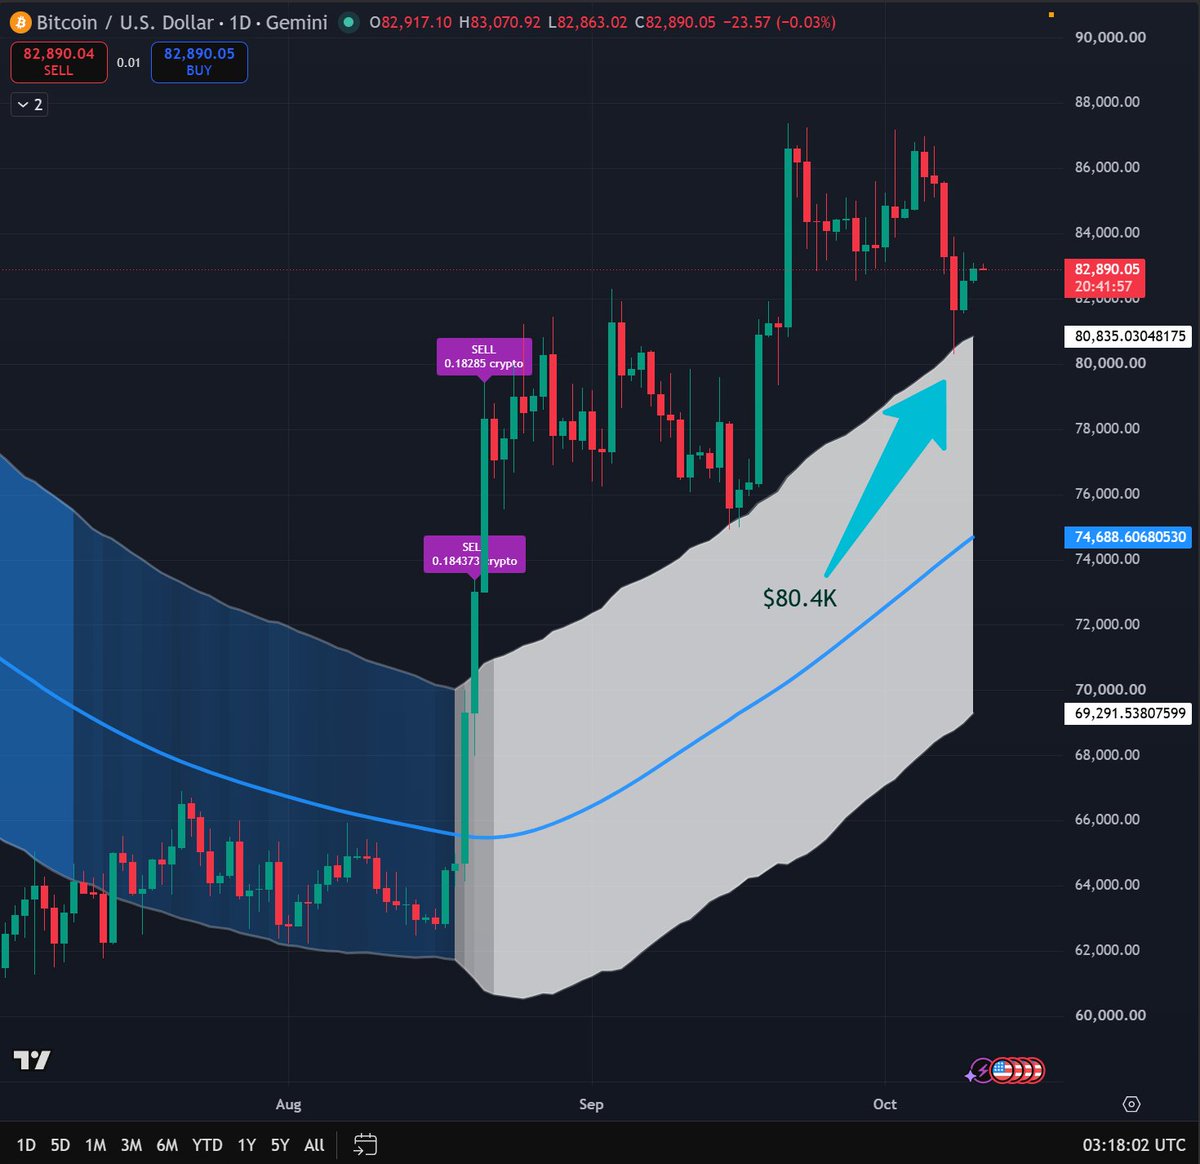
$BTC ~$82.6k - bouncing right off the upper edge at $80.8k. Structure held the scare. That edge is the line on any sharp pullback.
$SPCX - spectrum deal hit the carriers. Stock itself firm. Watching for opportunities sub $145.
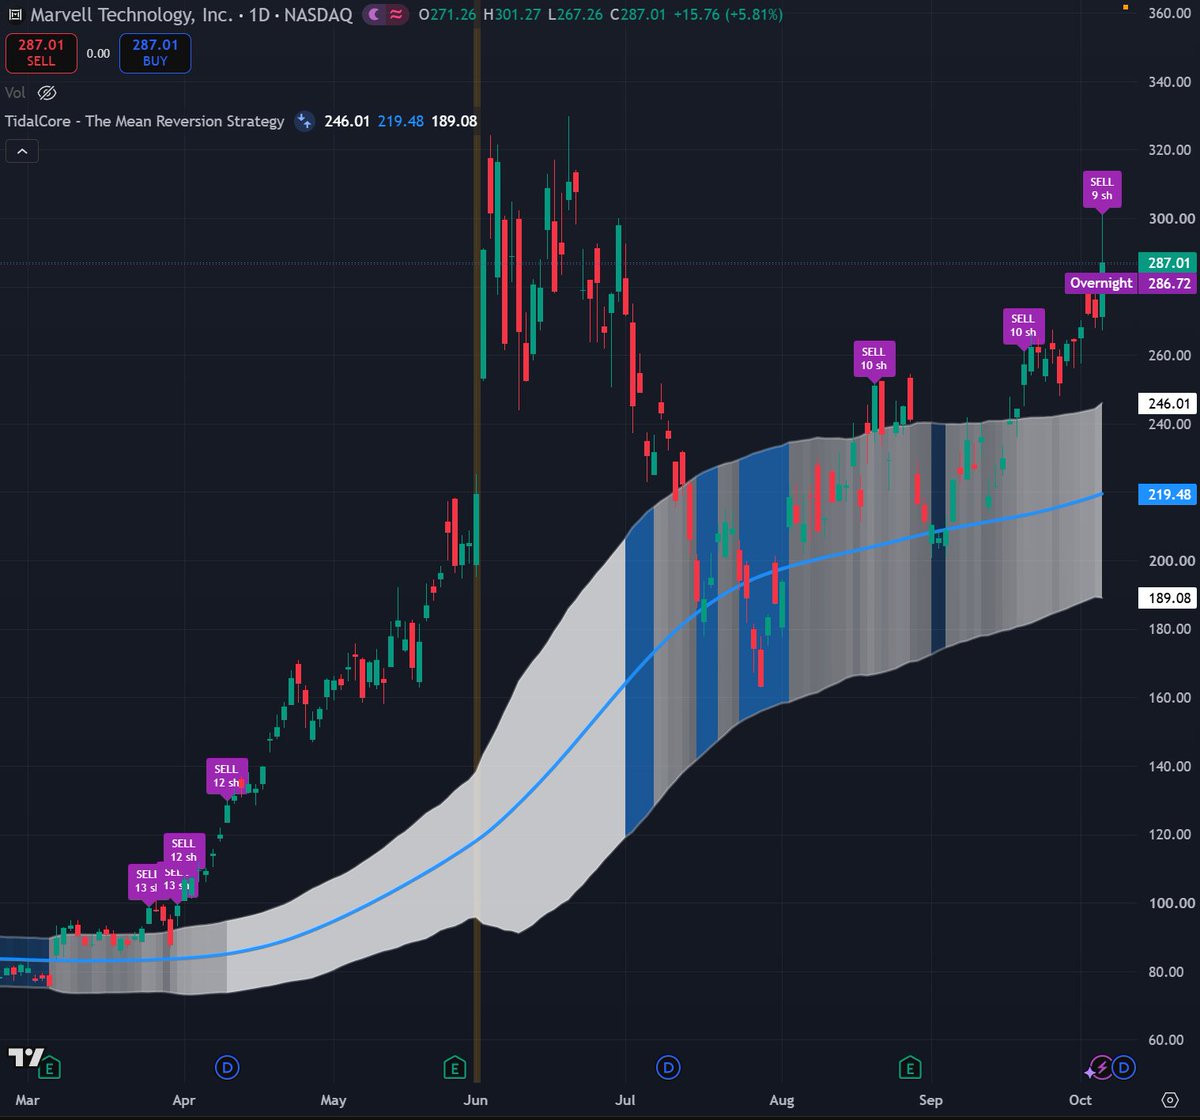
$MRVL - outside trim above $249. No re-buy of the rip.
Watching into 10/12
IREN reclaim of $38 vs. another dip under the fill
UMAC hold under $22.85 - accumulation or breakdown
ALAB $312 basis - holds or the trim was early
AVGO $368 - reclaim or it stays the patience trade
BTC $80.8k upper edge - bounce continues or fails
Model actions this week:
sold ALAB $390, bought IREN ~$35.72. Outside trims on ALAB / ANET / MRVL. Cash still a position.
Understand the Waves. Trade with Edge.
1/2 — what changed
$IREN — The model bought the wash. Dropped ~7.7% Thursday, filled 83 shares at ~$35.72 (50% of the IREN sleeve) under the $38 lower edge. Closed $35.19. Expectation remains a bounce toward the $43 basis. $38 is the reclaim. DCA until then. (Chart)
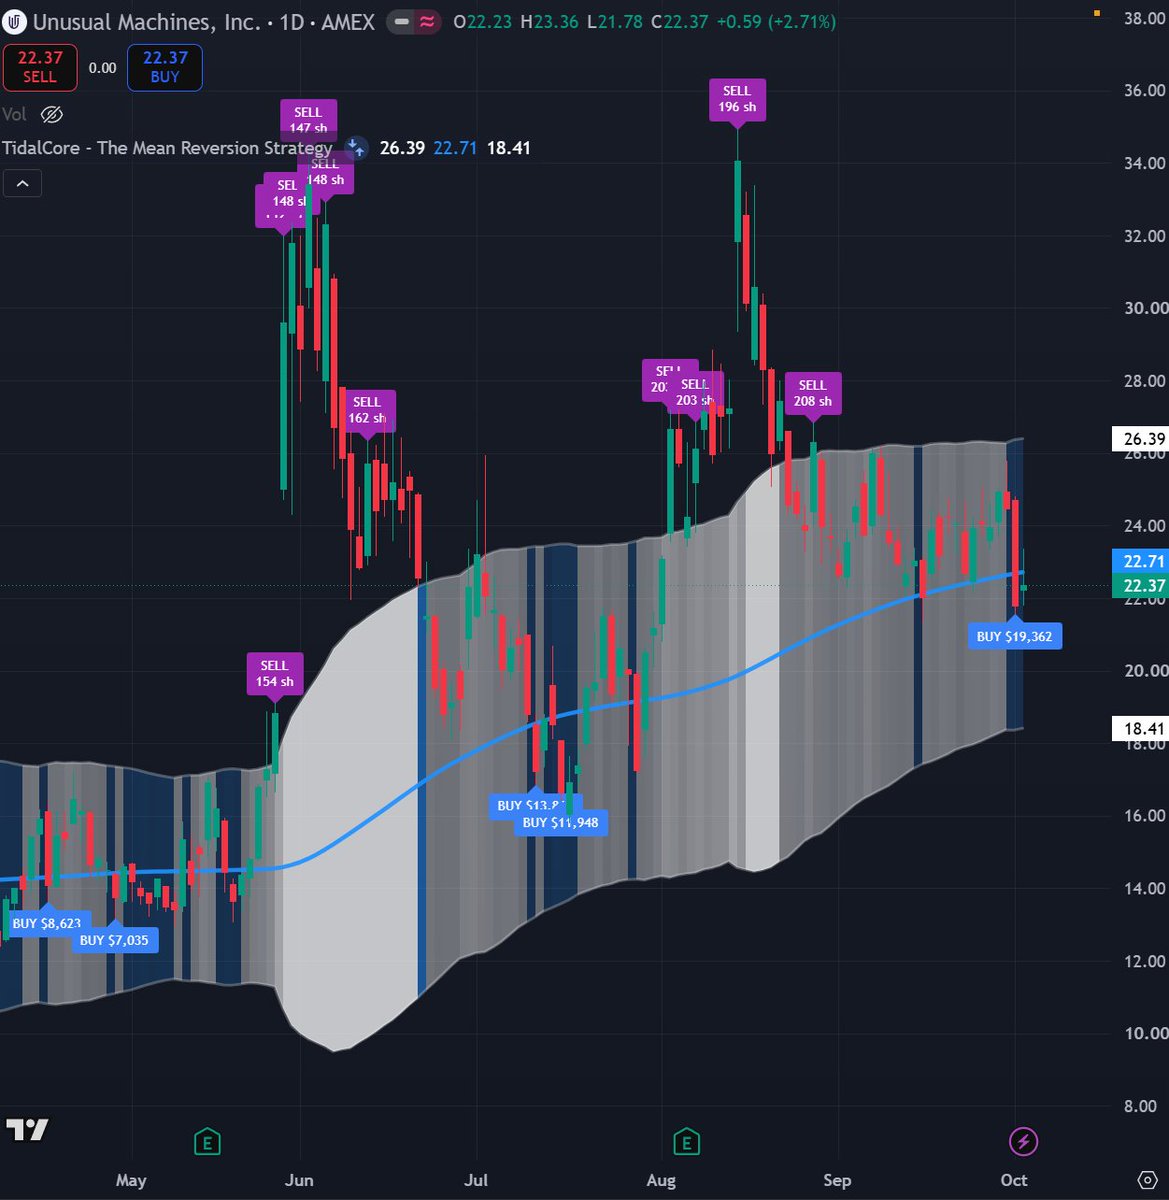
$UMAC — Back in the accumulation zone. Closed $20.83, under the $22.85 basis. Prior add was ~$21.79. Dips under $22.85 remain the lean. $26.33 is the upper edge if it turns. (Chart)
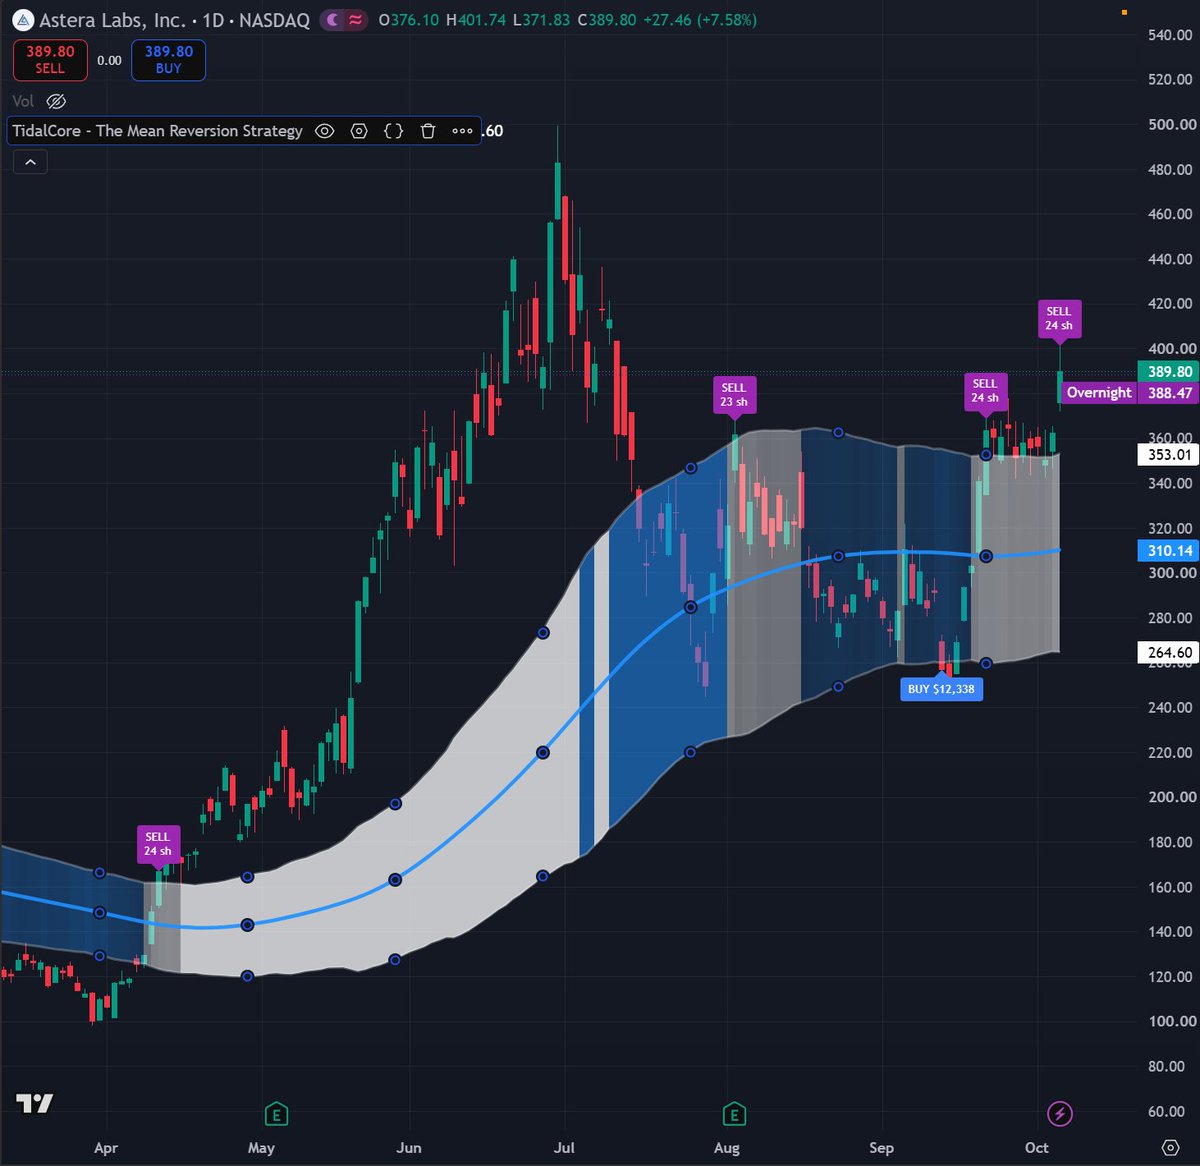
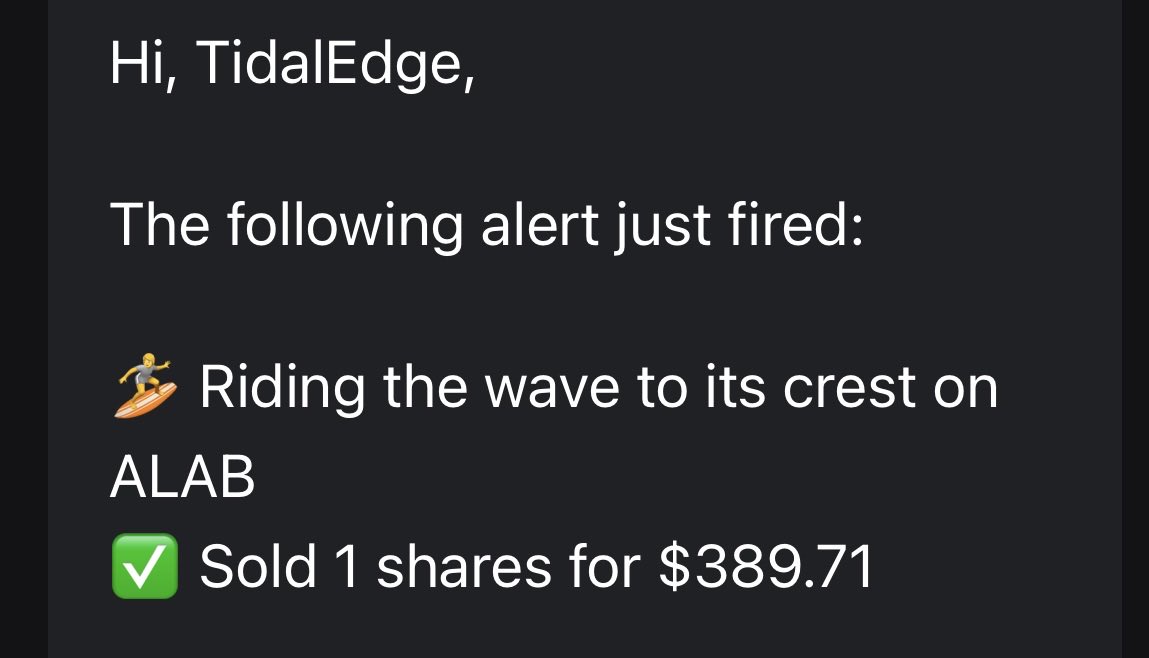
$ALAB — Trimmed, then gave it back. Model sold 5% of the sleeve at $389.71 with price extended. Closed $342, still above the $312 basis. Chart says patience. $357 is resistance on any bounce; $312 is the line that has to hold.
$TSLA — The add held. Closed $383, still above the $362 basis. Momentum uptrend from last week is intact.
For those watching bitcoin:native and fearing another dip before the Bull market really kicks off...
sure it could happen...
but it's amazing how it's bouncing right off the upper edge of fair value.
(Sample Chart)
Model Portfolio Trade Alert 🚨:
The model portfolio took one trade today. Buying 83 $IREN shares for $2964.76 (50% of the IREN strategy value).
IREN dropped ~7.68% today and is below the fair value lower edge at $38.
Trading Edge of the week:
$UMAC - revisiting the accumulation zone under the fair value basis of $22.80. Expecting a run back towards the upper edge at $26.33.
$IREN - Just tapped the lower edge today at $38. I expect a bounce back towards the $43.16 basis.
Sample Charts Below
Outside the model portfolio, I trimmed some gainers.
$ALAB , $ANET , and $MRVL all had strong sessions and are trading above the fair value edge.
$ALAB +7.6% - upper edge $353
$ANET +4.1% - upper edge $199
$MRVL +5.8% - upper edge $246
Don’t let the tide take all the gains. Stockpile cash for the next wave.
Sample charts attached.
Model Portfolio Trade Alert 🚨:
The model portfolio took one trade today. Selling 1 $ALAB share for $389.71 (Small trim. 5% of the ALAB strategy value).
ALAB gained ~7.58% today and is above the fair value edge at $353.
Bank of America named Nvidia, Intel, Marvell, Micron, and Lam Research as its top semiconductor picks for Q4 and lifted its AI data-center systems forecast to $2.2 trillion by 2030, from $1.8 trillion.
The $MU case rests on AI memory demand plus buybacks starting December 9, after a blowout print and above-consensus guidance. MU is up roughly 277% year to date.
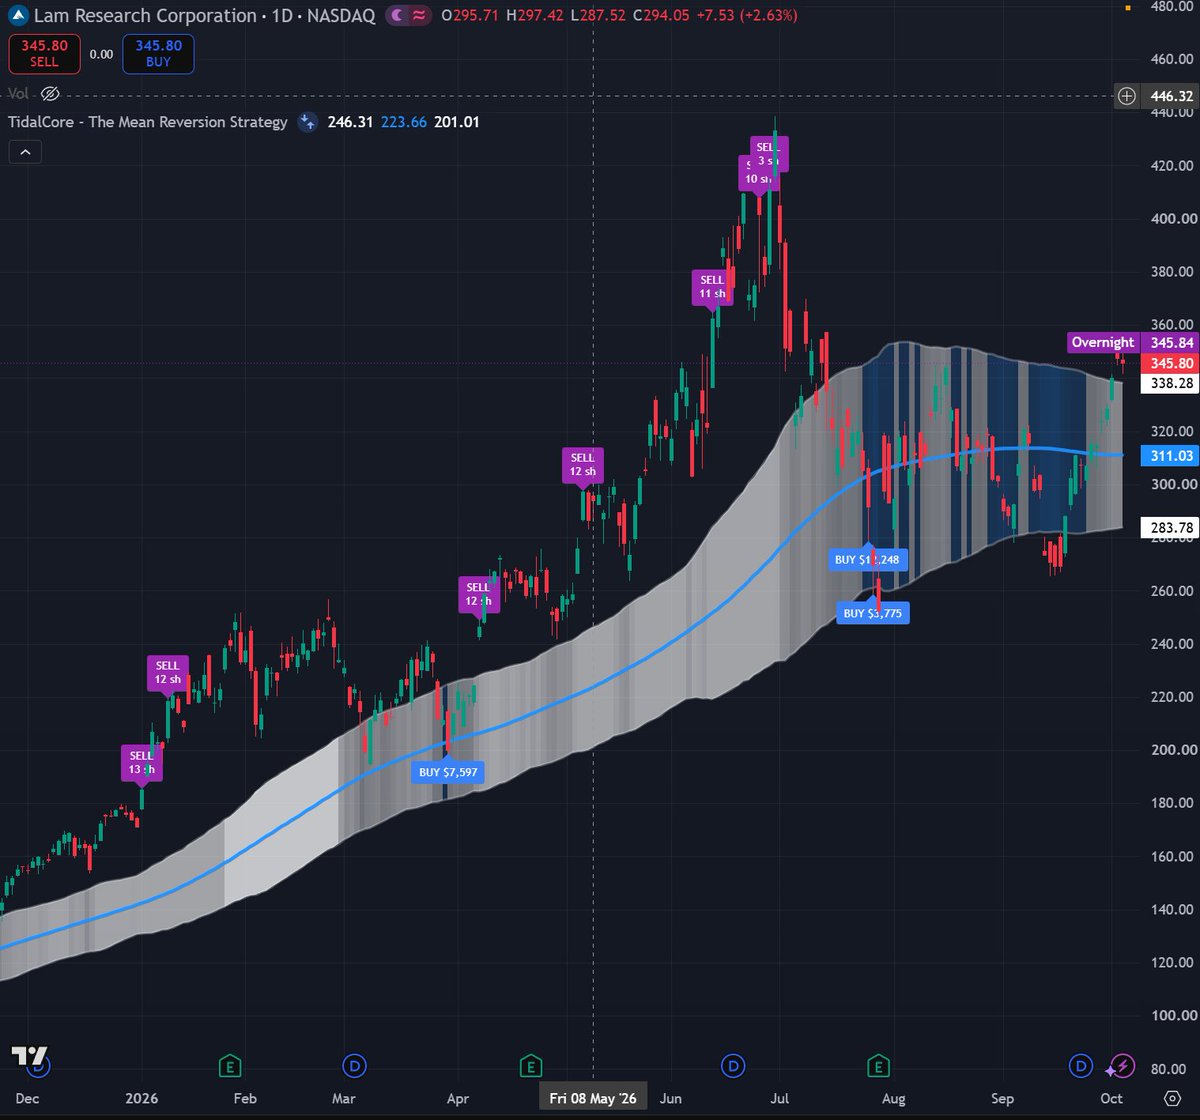
Lam Research ($LRCX ) is one I'm keeping a close eye on. Noting but uptrend on the chart and entries are few and far between. Keep an eye on another chance at $311. (Sample Chart)
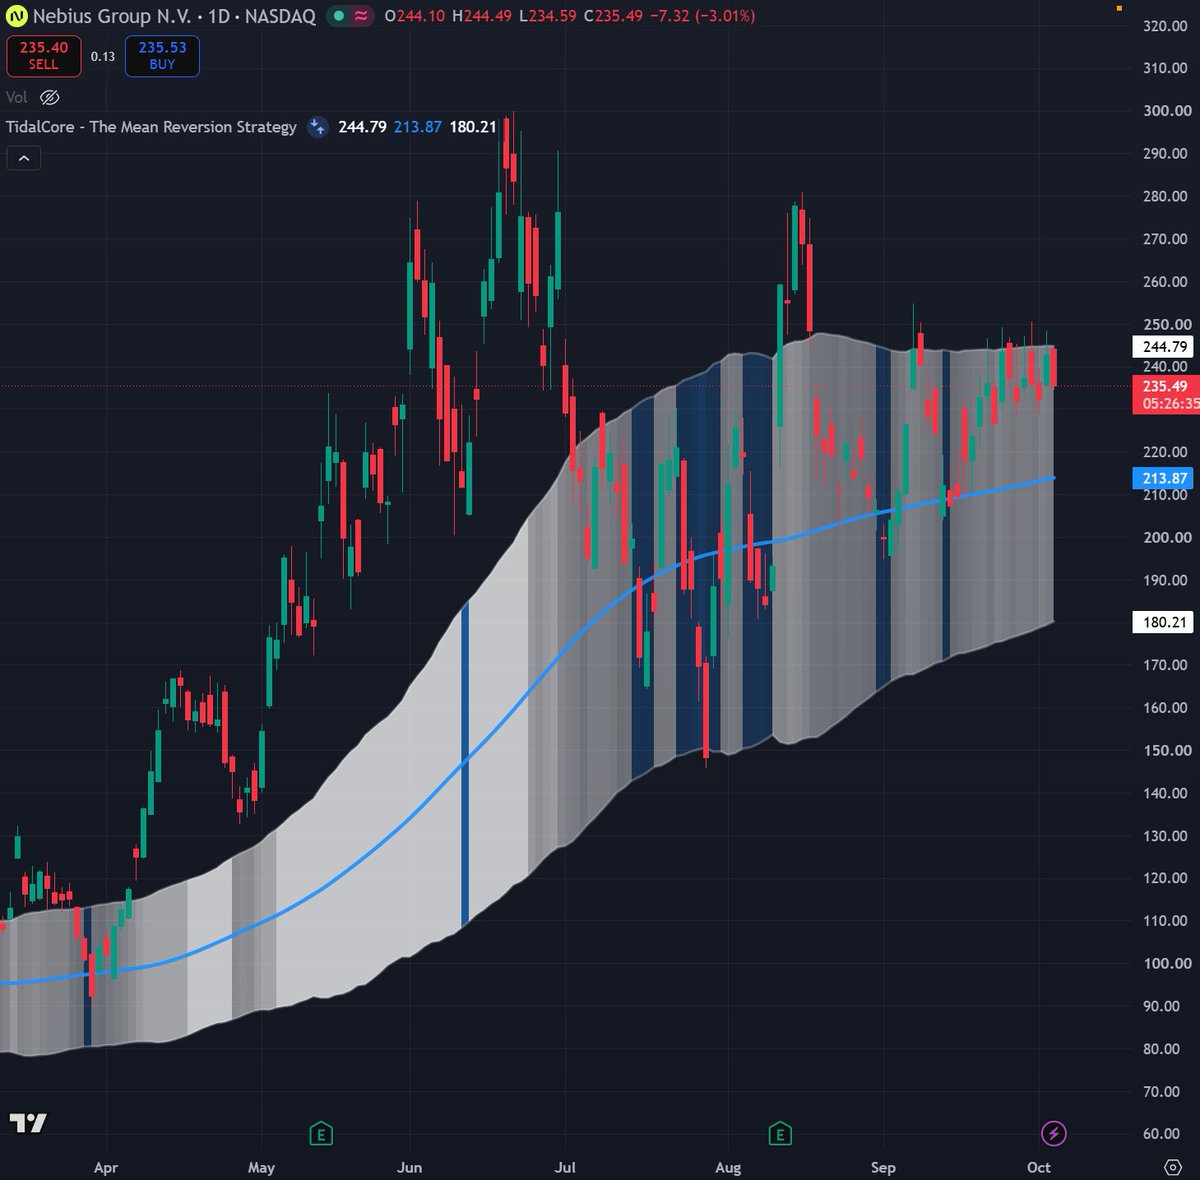
$NBIS is one to watch this week.
Bounced cleanly off the $244 upper edge of fair value.
If it breaks above > potential ATH run
Slow breakdown > $213 is support
@Mr_Derivatives Always nice to get some recognition from those that paved the way ahead.
The struggle may be real, but we’ll keep showing up and adding value. 🤝
3/3 — the rest + week of 10/5
$NVDA $234 - through $226. Edge is support until it isn’t.
$AMD $634 - still extended above $546 after the $615 trim. No add.
$ALAB - trimmed $363 above the $351 edge. $309 remains support. No re-buy of the rip.
$ANET - still above $198 upper edge.
$PLTR $189 - premium intact. $167 is the magnet if it cracks.
$GOOG $340 - still under $344. Same patience call as AVGO. Needs the basis.
$IREN $42 - slipped under $44. Runner only. No add yet.
$SPCX $159 - firm. $135 is pullback support.
bitcoin:native ~$85k - tagged ~$87k, faded. Solid-white structure intact. $77k is the breakdown line.
$VST $140 - sitting on the old $137–$141 lower edge.
Watching into 10/5
UMAC hold of $22.71 vs. another dip under it TSLA $364 - the new add lives or dies there AVGO / GOOG - patience, not a chase NBIS $244 - rejection or a break toward the highs CPI Friday 10/9. Hike odds already repriced.
Model actions this week:
bought UMAC ~$21.79, bought TSLA ~$370.68. AMD and ALAB trims from last week still stand. Cash is still a position.
Understand the Waves. Trade with Edge.
2/3 - what changed
$UMAC - The add the model has been waiting on. Dropped ~11% Thursday, filled 87 shares at ~$21.79 (32% of the UMAC sleeve) under the $22.71 basis. Closed $22.37. Sub $22.71 is now the add zone. $26.30 is resistance. Don’t chase the snapback. (Sample Chart)
$TSLA - $366 basis held, then the model added. Bought 2 shares at ~$370.68 (10% of the TSLA sleeve) on the +4.6% day and a new momentum uptrend. Q3 deliveries 486,532 vs ~463k. $366 is now the line. Lose it and the add was early. (Sample Chart)
$AVGO - Still the patience trade. Closed $355, bottom of the fair-value range, well under the $371 basis. Filled $338 weeks ago. Q4 mean-reversion toward the upper edge is the lean, not a chase through $371. The expected mean reversion can take weeks.
$MU - Blowout held the structure. Closed $1,075 after the post-print fade, still above $1006. Almost no large US name has printed this kind of growth at this size. $1006 is the line. No add up here.
@CGInvesting10 I feel $AVGO has underperformed in recent months but it’s clearly sitting at the bottom range of fair value.
Q4 I would be surprised not see some significant mean reversion upwards.