Here’s my view on the market in a higher-rate environment.
Stock picking is much harder today and I think it will stay that way for quite some time. But that doesn’t mean there are no opportunities.
Higher rates have raised the bar for equities. In the low-rate era, stocks offered a clear relative advantage over Treasuries. Today, with 5- and 10-year Treasury yields around 5%, their P/E-equivalent is roughly 18–20x, close to the S&P 500’s ~19x forward P/E.
That changes the equation.
When investors can earn about 5% in relatively low-risk assets, stocks need stronger earnings growth, cash flow and business resilience to justify the added risk.
That puts smaller and mid-sized companies with weaker financials, less pricing power and narrower moats at a disadvantage. Both earnings and valuations face greater pressure.
If rates stay higher for longer while earnings growth remains concentrated in a handful of sectors, weak market breadth could persist.
That helps explain the widening gap between IWM and QQQ/SPY.
It has also shaped how I’m trading this market.
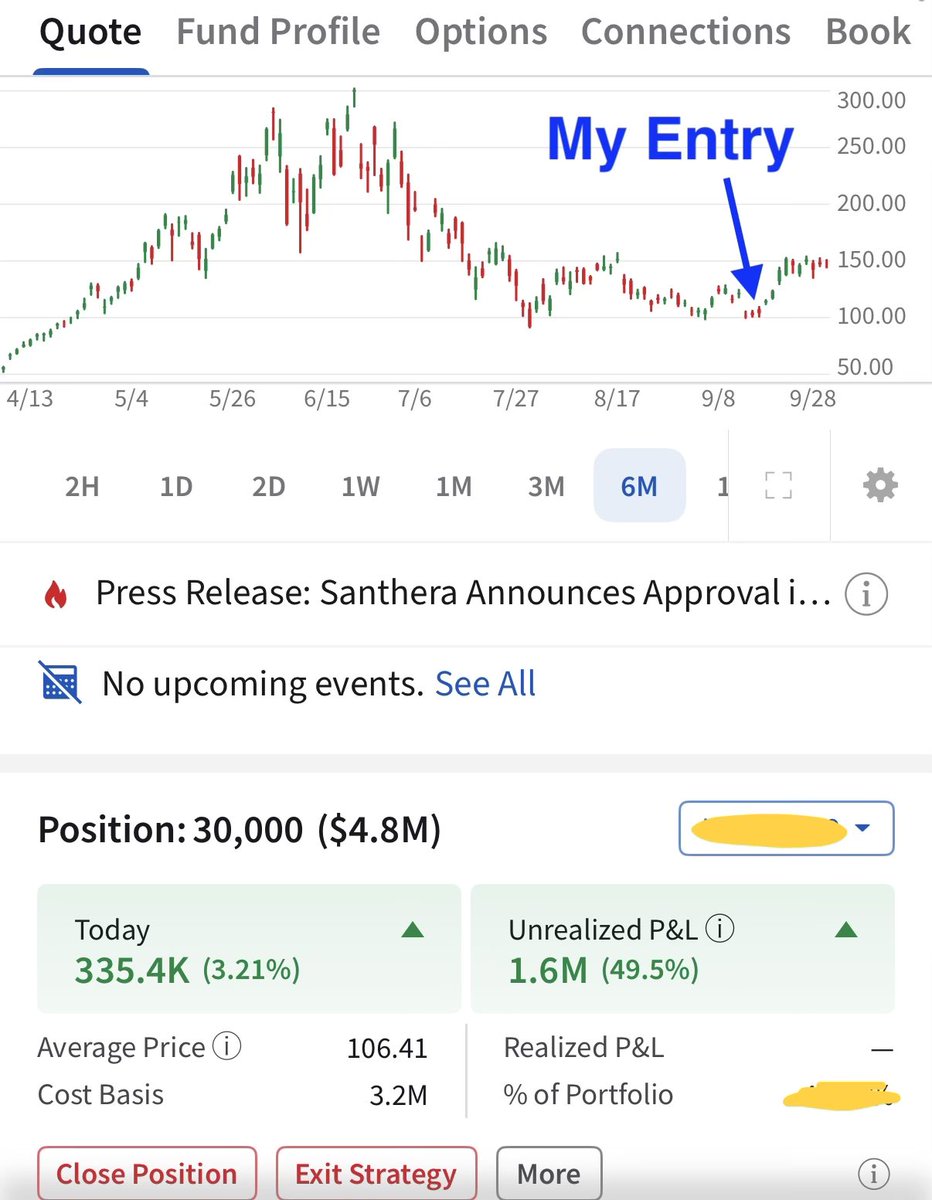
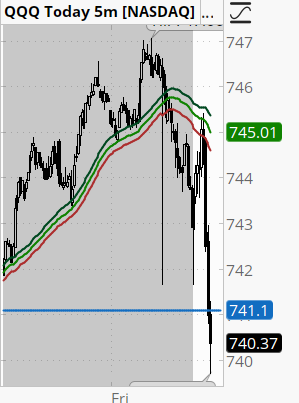
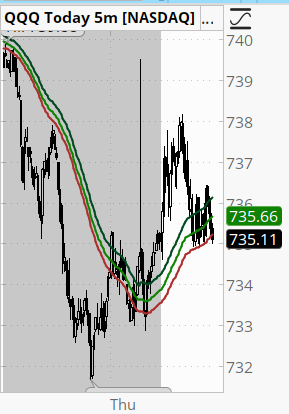
I caught the Sept. 16 market bottom, but my largest position wasn’t an individual stock. It was $SOXL.
The position reached about $1.6 million in unrealized gains over the next two weeks.
My second-largest position was $TQQQ, which also contributed meaningfully to P&L.
I still own individual stocks, but I’ve become much more selective and kept those positions smaller than my ETF exposure.
So why ETFs? And why stay bullish despite higher yields and weak breadth?
More in the comments.
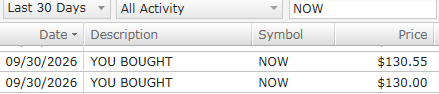
(I’ll also share my Sept. 16 market analysis and trade records below.)
Introducing the official Unity plugin for Grok Build - bringing our engineering guidance directly to your terminal in our continued effort to meet you where you work.
Unlock 30+ Unity skills covering UI Toolkit, Shader Graph, multiplayer, physics, and more with nothing to configure by hand.
One install, no manual setup, built by Unity.
🔗 Get started: https://t.co/u1DHKS3ASY
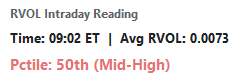
3000k stock universe average RVOL 30 minutes after the PCE release shows a complete lack of participation. Meaningless gap up on light volume, and this is the reason 👇👇
The market will heavily discount today's PCE inflation data.
Why? Because the US just changed the way PCE inflation is calculated:
Beginning with today’s release, the US changed the methodology for 3 key PCE inflation categories and revised data back to 2021:
1. Portfolio management/investment advice
2. Computer software/accessories
3. Legal services
The biggest change is in portfolio management fees. Under the old methodology, rising asset values could show up partly as higher "prices" for portfolio management services.
For example, if an adviser charged 1% of assets and the portfolio rose 20%, the dollar fee would rise 20% even though the adviser did not raise the 1% fee.
The new methodology uses an employment-based measure to estimate the quantity of services, reducing the amount of the increase that is classified as inflation.
For software, the US now uses a broader composite. For legal services, an unpublished CPI series is being replaced because it had become "unusually volatile."
We estimate the methodology alone could reduce Core PCE inflation by up to 20 basis points.
In the PCE inflation data released just now, both headline and Core PCE inflation were revised down by 30 basis points for July.
We do not interpret the entire 30 basis point drop as disinflation.
Part of it is literally a measurement change.
Mental frame issues - beliefs, trading values, interpretations - all affect decision-making and actions. Everything else (discipline, errors, intelligence) is a byproduct.
Example: If you believe in and value trading education, proper development, and building a process before execution, you will not lack intelligence for long. But you have to believe.
@SteveDJacobs I'm stealing from you and building my own dashboard. Will have to buy you lunch one day. 🙏🙏🙏And next time you do a stream, change your wallpaper to a photo of you in a Lambo. It will immediately boost engagement and following 😃😆
Big Tech dominated earnings season:
The S&P 500's total market cap has surged +$1.75 trillion since Q2 earnings season began on July 13th.
The Technology sector alone accounts for +$1.39 trillion of that gain, or ~79% of the total.
Within tech, Microsoft, $MSFT, and Nvidia, $NVDA, added a combined +$1.42 trillion in market cap over this period.
By contrast, the other 71 stocks in the sector lost a combined -$22.3 billion.
Health Care added +$345.2 billion in value, followed by Financials at +$192.7 billion and Energy at +$174.7 billion.
On the other hand, Communication Services lost -$299.6 billion, followed by Utilities at -$88.5 billion and Industrials at -$67.3 billion.
Big Tech has never been bigger.
I'll be happy to read an article about it. But yeah, can't agree more that these things help. I personally implemented a diet, workout, and brain-rewiring techniques in my life, and I have changed so much from the impulsive trader I was before. But as you said, I took a lot of pain (punches) before I realized I was the problem, not the charts.