Activist: "Your cows are putting carbon into the atmosphere."
Farmer: "Where did they get it?"
Activist: "What?"
Farmer: "The carbon. Where did the cow get it before it put it anywhere."
Activist: "From... eating?"
Farmer: "From eating grass. And where did the grass get it."
Activist: "The soil?"
Farmer: "The air. The grass pulled it out of the air last spring. The cow ate the grass. The cow breathed some of it back out. It went back into the air it came from."
Activist: "But it's still going into the atmosphere."
Farmer: "It's going back. There's a difference between a thing going somewhere and a thing going back. You've described a circle and you're frightened of it."
Activist: "Then just don't have the cow."
Farmer: "The grass still dies in autumn. It rots where it falls. The carbon goes back into the air either way, just without anyone getting fed in the middle."
Activist: "It's not that simple."
Farmer: "It's grass, cow, breath, grass. Or it's grass, rot, air, grass. Same circle, fewer dinners. If that's complicated for you I'd stay away from the water cycle. That one's got clouds in it."
1.7 MILLION cars were repossessed in 2009 during the GFC.
3 MILLION cars were repossessed in 2025.
The average new car is $748/month.
78% of Americans commute using their cars.
Subprime delinquency rates are 6.9%
Subprime makes up ~14% of all auto loans.
The crisis is here
BREAKING: The 60+ day delinquency rate on US subprime auto loans is up to a record 6.9%.
Serious delinquency rates have more than DOUBLED since 2021.
This exceeds the 1996 peak by 0.9 percentage points.
For context, the 2008 Financial Crisis high was 5.0%.
Meanwhile, total auto debt is up +$312 billion over the last 5 years, to a record $1.67 trillion, driven by surging vehicle prices.
Subprime financing makes up ~14%, or $234 billion, of all auto loans.
Americans are falling behind on their car debt at a record pace.
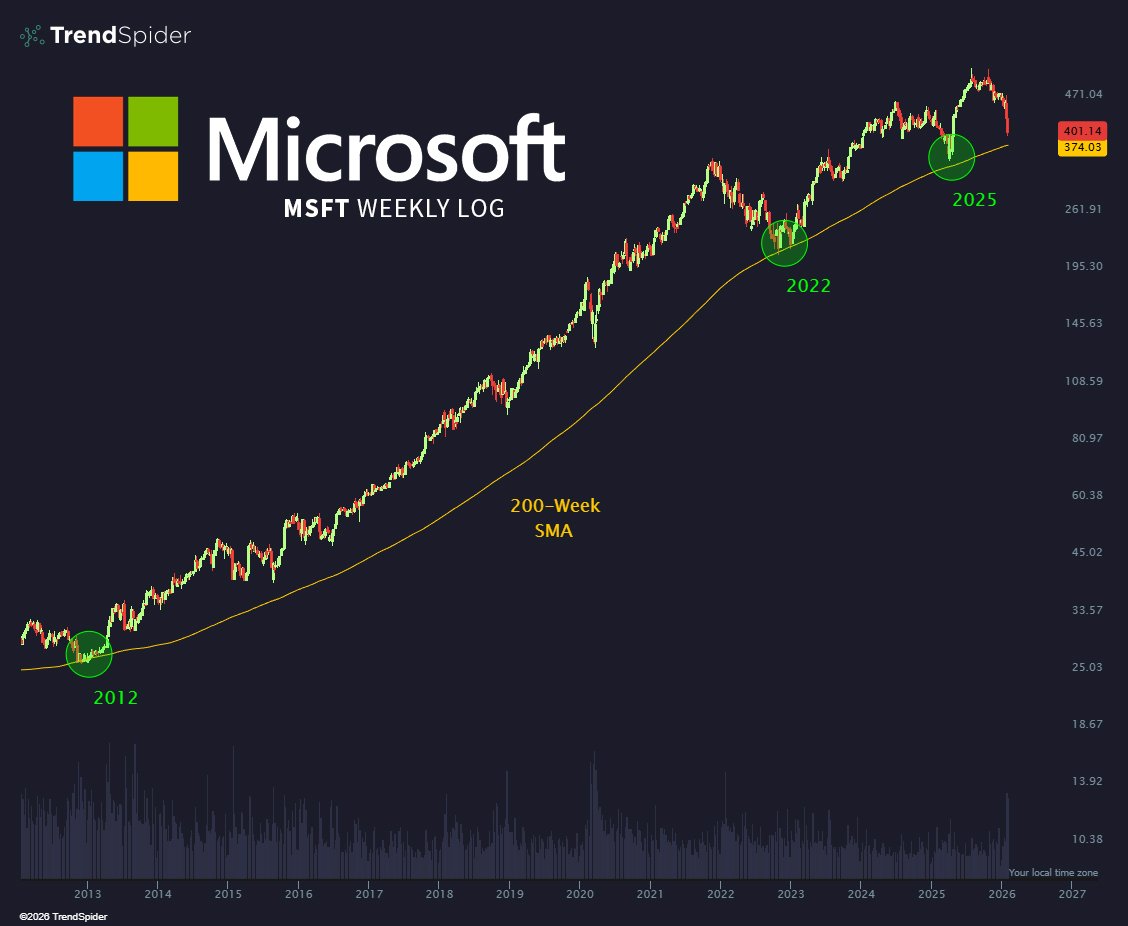
Charlie Munger decia:
"If all you ever did was buy high-quality stocks on the 200-week moving average, you would beat the S&P 500 by a large margin over time. The problem is, few human beings have that kind of discipline."
$MSFT
@MasterBJones Roll into 1 to 3 month treasuries every 2 weeks with portions of your account.
Limits you from overtrading while leaving you some money to invest now and a steady influx down the road
This is a year to date accumulation of announced layoffs. By the end of 2025, companies had flagged just over 1.2 million job cuts, which puts the year in rare territory outside of crisis moments. That’s why the 2025 line sits up near the Great Financial Crisis years. It reflects a broad shift in behavior..protect margins, cut headcount, slow hiring and conserve cash.
What makes this different from a normal tech cycle reset is how wide it spread. Government cuts hit early and hard, tech followed, but then you see retail, warehousing, and services join in. At the same time, planned hiring quietly fell to levels we usually only see after growth has already cracked. That’s the part markets often miss..layoffs matter, but the absence of new hiring matters more.
Excluding COVID, What Does History Say Comes Next?
If you strip out 2020 and look at prior years that hit this kind of annual layoff scale 2001, 2002–03, 2008–09 the economy was either in recession or stuck in a post recession labor slump. There aren’t many clean counterexamples where layoffs ran this hot and the economy just shrugged it off.
Put simply…
• Historically, there’s about a 60% chance this level of layoffs coincides with an official recession.
• If you widen the lens to include recessionary conditions..weak growth, soft labor demand, rising slack..the odds climb closer to 75–80%.
That doesn’t mean collapse is guaranteed. It does mean the labor market is no longer a buffer and it’s becoming a transmission channel.
My View
This chart is signaling late cycle behavior with a strong track record. Companies don’t announce layoffs at this scale because they’re feeling confident about demand 6 months out. They do it because uncertainty is rising and flexibility matters more than expansion.
When layoffs stack up and hiring dries up, history says the economy usually bends next. Whether it snaps or just sags depends on what breaks first..credit, consumers, or confidence.
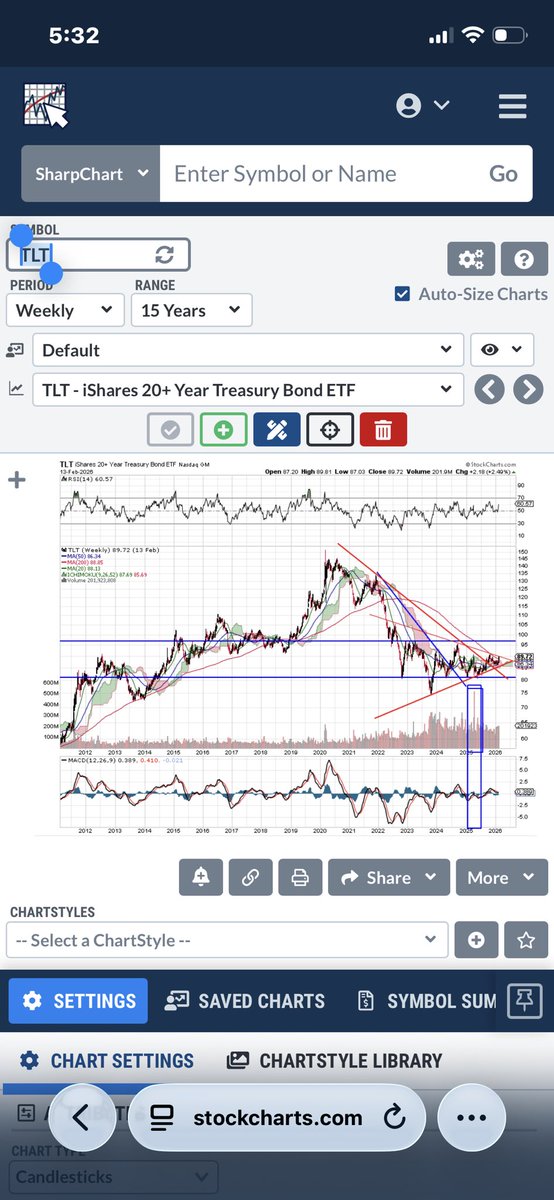
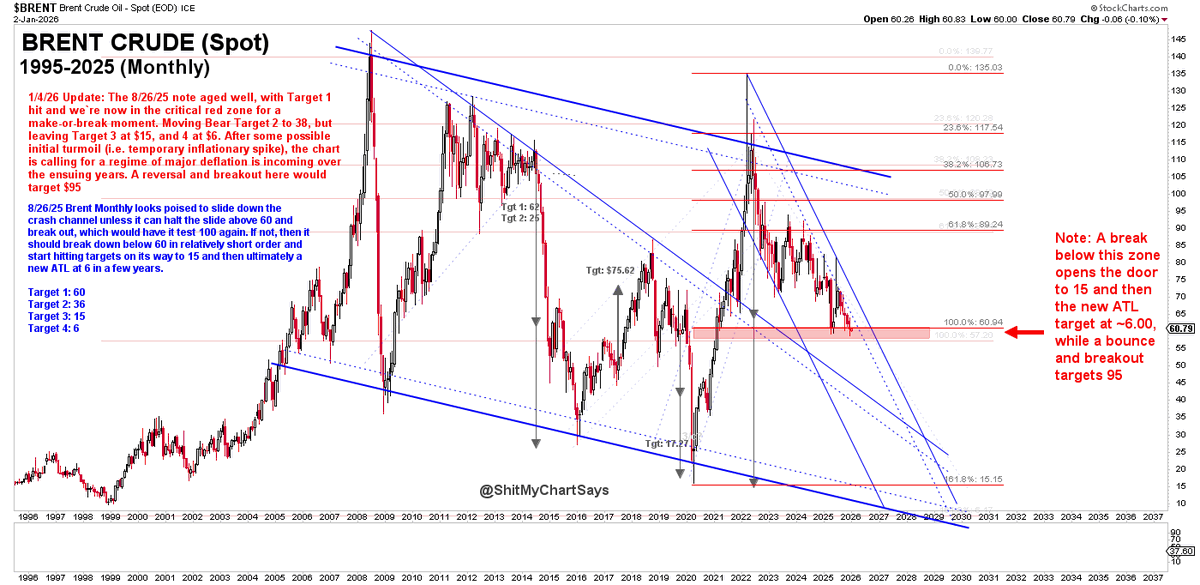
1/4/26 $BRENT Update: The 8/26 note aged well, with Target 1 hit and we're now in the critical red zone for a make-or-break moment. After some possible initial turmoil (i.e. temporary inflationary spike), the chart is calling for a regime of major deflation over the ensuing years, contrary to popular punditry. If they're right, we break out of the down-channel for a reversal and breakout that would target $95.
US truck demand is collapsing:
US heavy truck sales have plunged -47% over the last 3 months compared to the prior 3 months, to an annualized rate of 363,000, the lowest since the 2020 pandemic.
Truck sales have now declined in 4 out of the last 5 months.
In the past, such a rapid drop has only been seen during recessions.
This comes as business demand for freight, construction, and industrial activity has significantly weakened.
As a result, truck sales are set to become a substantial headwind for US GDP growth in the second half of 2025.
The AI trade is in its own world.
THE $1 TRILLION TIME BOMB JUST STARTED TICKING
Twenty years of free money just reversed in 72 hours.
Japan’s bond yield hit 1.73% yesterday. The gap between US and Japanese rates collapsed to 2.4%. The most crowded trade in financial history is now underwater and unwinding at algorithmic speed.
Here’s what’s actually happening while you sleep:
The yen carry trade is $1 trillion of borrowed Japanese money at zero percent flooding into everything. US stocks. Emerging market bonds. Crypto. Real estate. Commodities. For two decades, this invisible river of capital inflated every asset you own.
November 10th the river reversed direction.
The math is brutally simple:
Borrow yen at 0.5%. Invest in US Treasuries at 4.14%. Pocket 3.64% risk free. Leverage it 10 times. Make 36% annually doing nothing.
That trade just became: Borrow at 0.5%. Invest at 4.14%. But now the yen is strengthening 5% against the dollar. Your 3.64% profit becomes a 25% loss when you have to pay back stronger yen. At 10x leverage, you’re bankrupt.
The unwind is already accelerating. Japanese institutions are pulling $200 billion out of foreign markets in the next 90 days. Not because they want to. Because they have to. The mathematics force liquidation.
Three places this detonates:
Emerging markets get destroyed first. Thirty percent of capital inflows into developing economies came from yen carry trades. Indonesia, Brazil, South Africa, Turkey just lost their largest buyer. Currencies will collapse 15% in weeks. Their central banks can’t stop it.
Crypto gets cut in half. Twenty percent of all crypto buying was funded with borrowed yen. As carry trades unwind, forced selling hits Bitcoin, Ethereum, everything. No bid appears until leverage clears. That means 40% to 60% drawdowns from current levels.
US equities enter a violent deleveraging spiral. The VIX already spiked from 12 to 18 in 48 hours. Hedge funds used yen borrowing to run leveraged equity strategies. Margin calls trigger systematic selling regardless of fundamentals. The S&P 500 drops 8% before anyone realizes why.
Here’s what nobody is connecting:
Japan is pumping $110 billion stimulus into their economy while simultaneously raising rates. This creates maximum chaos. More government bonds hit the market exactly when Japanese buyers are pulling money home. Yields spike further. The yen strengthens more. The unwind accelerates.
This is a positive feedback loop with no natural brake until something breaks.
The Bank of Japan meets December 18th. Markets are pricing 50% odds they hike again to 0.75%. If they do, the yen jumps to 145 per dollar overnight. Every carry trade still open loses another 6% instantly. Forced liquidations cascade globally.
The 2008 parallel nobody wants to discuss:
Last time yen carry trades unwound violently was October 2008. The yen appreciated 20% in eight weeks. Global equities fell 35%. Credit markets froze. The financial system nearly collapsed.
Difference now: The position is twice as large. Leverage is higher. And it’s unwinding into a world where central banks have no ammunition left. The Fed can’t cut rates to zero. The ECB is already underwater on their bond portfolio. Nobody can print their way out because that’s what caused this.
Three scenarios, 90 days out:
Controlled burn: Yen moves to 148 per dollar gradually. Carry trades unwind over six months. Markets chop violently but don’t crash. Global growth slows 0.5%. Probability 30%.
Disorderly unwind: Yen hits 145 by year end. Forced liquidations trigger circuit breakers. Emerging markets see capital flight and currency crises. S&P falls 12%. Credit spreads blow out. Probability 55%.
Full contagion: Yen breaks below 140. Systematic deleveraging becomes self reinforcing. A major hedge fund or bank fails on yen exposure. Counterparty risk spreads. Markets down 20% plus. Financial system stress requires intervention. Probability 15%.
The setup is already in motion.
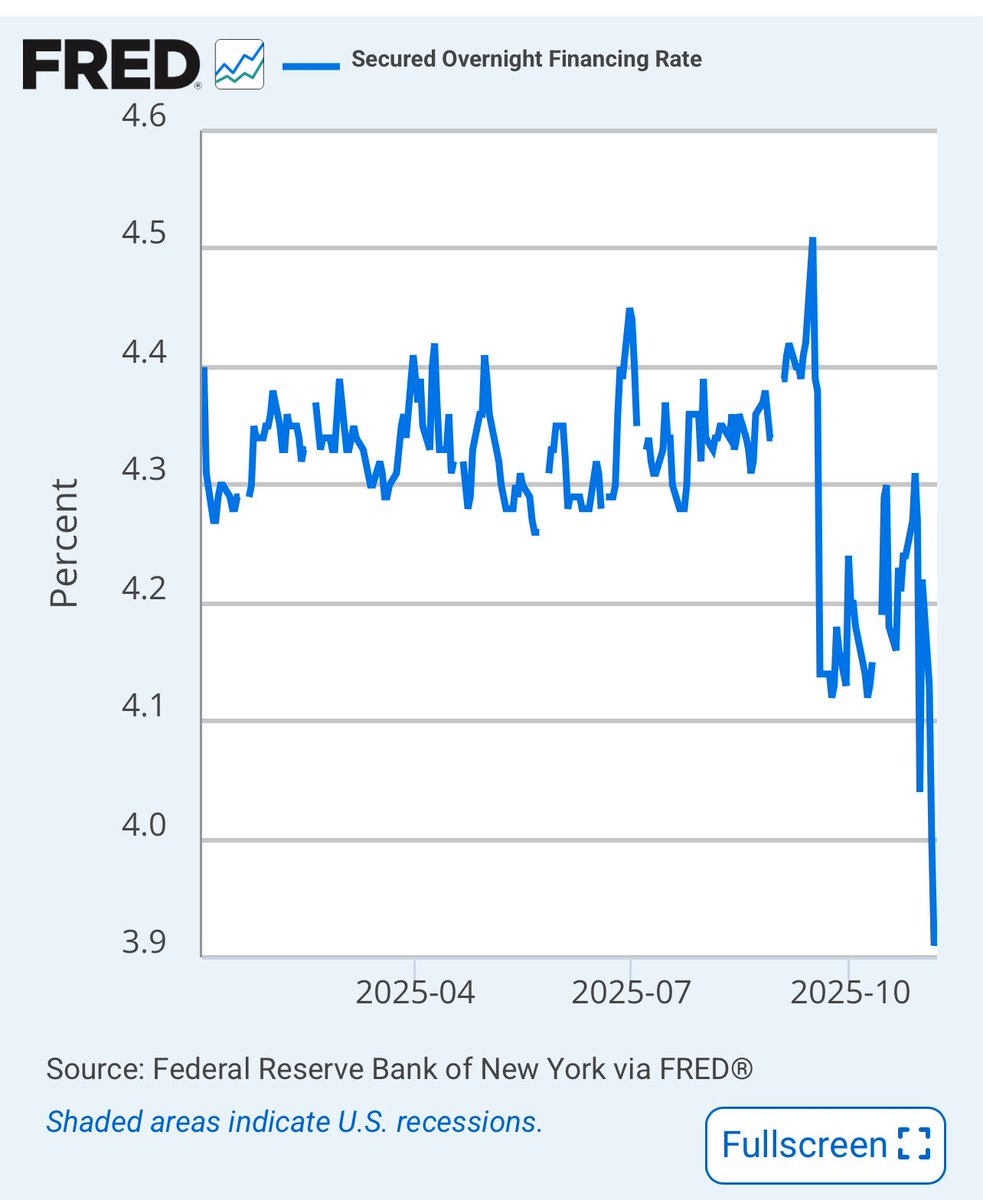
SOFR’s Drop Is The Market Front Running the Fed
That sharp plunge in SOFR is the money markets reacting before the headlines. The system is already adjusting to what’s now effectively policy: the Fed cutting twice this fall, announcing an end to balance sheet runoff on December 1, and redirecting maturing assets toward the short end of the curve. Liquidity is being rerouted. And that change matters.
What’s Actually Happening
SOFR, the rate for borrowing cash overnight against Treasuries, just collapsed because there’s suddenly more cash than collateral. That’s what happens when the Fed stops shrinking its balance sheet and starts reinvesting every maturing security. Reserves rise, collateral gets absorbed, and the cost of short term money drops.
The Fed isn’t expanding its balance sheet, but it’s changing what it holds:
•Treasuries: Every maturing note will now be rolled over, freezing the size of the portfolio and halting QT.
•MBS: Mortgage holdings will be allowed to run off, with proceeds redirected into Treasury bills, the most liquid assets in the world.
•Result: The balance sheet stops shrinking, but its liquidity velocity increases. That’s not QE by name, but it acts like it.
How It Ripples Through the System
Front End (Bills & Repo)
With the Fed buying T bills, collateral scarcity disappears. Dealers find funding easier, repo rates (and SOFR) drop, and short term yields sink toward the floor of the policy range. The one to three month space becomes the new carry trade.
Banks & Funding
Cheaper overnight money eases funding stress and cushions balance sheets. Liquidity ratios look healthier. But easy funding always reignites leverage…basis trades, structured credit, and synthetic duration quietly return.
Credit & Risk Assets
Lower funding costs tighten credit spreads and boost valuations. It’s not a full blown stimulus, but it behaves like one. Corporates refinance, junk issuance rises, and equity multiples expand on the illusion of easier conditions.
Housing & Mortgages
The Fed’s pivot away from MBS means mortgage rates won’t follow the front end down one for one. Refinancing improves slightly, but housing won’t get the same liquidity tailwind. The liquidity flow is going to markets, not Main Street.
Long End of the Curve
The 20 and 30 year yields holding near 4.7% reveal the underlying truth…fiscal supply remains massive, inflation expectations sticky, and global buyers cautious. The short end can ease, but the long end keeps reminding us where the real strain sits.
The Calm Is Manufactured
Dropping repo rates look like stability, but this calm is engineered. The Fed isn’t stimulating demand, it’s suppressing stress. By managing where liquidity goes rather than how much there is, the system stays orderly on the surface while leverage quietly expands beneath it.
Markets love this version of control. Funding gets cheap, volatility fades, and asset prices levitate. But it’s not organic growth, it’s sedation.
What To Expect Next
•An anchored front end around 4%, as T bill demand absorbs new supply.
•Rising hidden leverage,
more carry trades and balance sheet stretching.
•Falling cash yields, the 5% era for money market funds is ending.
•A softer dollar. cheaper U.S. funding trims its global carry premium.
The Bottom Line
SOFR’s drop is the first tremor of a familiar pattern: re-liquifying the system without saying it out loud. It stabilizes markets, props up valuations, and stretches the cycle but it doesn’t fix the imbalance beneath it.
Liquidity always feels like safety on the way in. But underneath, it’s still leverage waiting for a spark.
THE WORLD’S MOST IMPORTANT NUMBER JUST COLLAPSED
November 6, 2025: SOFR crashed to 3.92%. The lowest level in two years. The benchmark that controls $397 trillion in global contracts just signaled something catastrophic.
This is not a rate cut. This is a liquidity flood.
THE NUMBER THAT MOVES EVERYTHING:
SOFR replaced LIBOR in 2023 as the foundation beneath derivatives, corporate loans, adjustable mortgages, and securities worth more than 15 times global GDP. When SOFR moves, $397 trillion in financial contracts reprice simultaneously.
It just fell from 4.22% on October 31 to 3.92% in six days. A 30 basis point nosedive that saves borrowers $50 billion annually but screams one word: panic!!
WHAT THE FED IS NOT SAYING:
The Federal Reserve cut rates 150 basis points year to date. Excess reserves are flooding repo markets. Overnight borrowing costs for the entire financial system collapsed to levels not seen since September 2023, when recession fears first surfaced.
Translation: The Fed sees something breaking and is throwing liquidity at it before the fractures become visible.
THE MECHANISM OF CONTAGION:
Lower SOFR slashes bank funding costs by 10 to 30 basis points immediately. Corporate loan rates drop 15 basis points. Adjustable rate mortgages reset 20 basis points lower, cutting monthly payments by $200 average.
Credit expands 2 to 5 percent. Lending accelerates. Asset prices inflate.
But here is what they are not telling you: sub-4% SOFR has preceded every major asset bubble since 2008. Cheap money does not fix broken growth. It masks it.
THE GLOBAL SPILLOVER:
Cheaper dollar funding triggers $10 billion plus in emerging market carry trade inflows. Currency volatility spikes. Foreign central banks hoard dollars. The cycle that destroyed Argentina, Turkey, and Sri Lanka restarts.
WHAT HAPPENS NEXT:
If Q4 GDP misses expectations or inflation spikes above 3.5%, SOFR reverses violently. Repo market seizures return. The 2019 overnight funding crisis replays at scale.
If the Fed holds course, credit bubbles inflate until something pops. Corporate debt. Commercial real estate. Equity multiples at 25x earnings.
THE TRUTH BURIED IN THE DATA:
SOFR is not just a rate. It is the early warning system for systemic stress. When the world’s most important number collapses this fast, it means central banks are terrified.
They are easing into a recession they cannot admit is coming.
Hold duration. Hedge via SOFR futures. Watch repo volumes like a seismograph.
The tremors started. The quake is next.