$NDX The Nasdaq 100 is now roughly 6x above its 2000 peak, matching the inverse of the dot com collapse.
Price adjusted volume spiked into the March 2000 all time high, and 2026 is starting to rhyme with that behavior. The current bar is tracking to clear the recent PAV spike by roughly 20%.
I couldn't look past it once I saw it.
bitcoin:native CME monthly.
Tough tape for longs.
This still reads like a Wyckoff distribution campaign to me.
The upper range showed supply at the right places:
• Composite Man disposing of longs near the first high
• Distribution to late entrants on the second push
• Heavy volume and wicks near the highs
• Breakdown from the range
• Weak rally back into the broken shelf
Now BTC is rising into the $81.8k to $82.8k resistance area.
Price is proof, but the quality of the advance still looks labored: narrow spread, light volume, and slow progress into overhead supply.
That is why I labeled it “Rising in agony into resistance.”
A rejection here keeps $61.5k in play as the next major test.
$TSLA monthly, mid month check.
This is a long Wyckoff trading range, and the tape is giving me more distribution type themes right now.
The most bullish signal on the chart, to me, is the Test of Supply near the support zone.
That dragonfly style monthly candle probed lower, did so on low volume, and recovered. In Wyckoff terms, that suggests supply may have dried up at the lows. That matters.
But as this humble tape reader sees it, the broader weight of evidence is still cautious.
Price keeps pressing into the same overhead area where the Composite Man likely began disposing of longs. Each attempt to advance has been met with supply:
• Long upper wick at the first testing of supply
• Another long upper wick during the later “Testing Supply, Effort vs Reward” arc
• Heavy volume near resistance with limited upside reward
That is where the tape gets nuanced.
The low volume Test of Supply is bullish evidence.
The repeated rejection near overhead supply is distribution evidence.
Right now, the distribution evidence carries more weight for me.
Because of that, I added September put spreads, looking for a potential pullback toward the $300 area, specifically the $299.09 level marked on the chart.
My rationale:
• $488 remains the major supply test
• $413 is the near term battleground
• $299.09 is the logical demand test below
• The monthly candle is still mid month and unconfirmed
• Supply has not been fully absorbed yet
If TSLA pulls back toward $300 on narrowing spread, lighter volume, and poor downside progress, the bullish case may improve.
If price loses structure and rallies back weakly, the distribution map becomes cleaner:
Upthrust. Test. Last Point of Supply. Sign of Weakness.
For now, I’m positioned for the next demand test.
$QQQ NDX
Primary Point & Figure count achieved:
27,807
The only remaining count is the aggressive cycle extension:
49,937
Either way, the measured move has already done its job.
$SMH Semis (via SOX) have joined the list.
The major Point & Figure count has been achieved:
11,165
Current price is already above target.
Measured move complete. Everything after this is extension.
@WyckoffAnalysis The market is not moved by your hopes, needs, or opinions.
Read the tape, act only at the proper point, and when the market says you are wrong, obey at once.
Still time left in the day, but CME bitcoin:native futures are presently shaping up as a doji at dual resistance, with a wick off the prior heavy volume support in Nov. '25. Sizing up puts in anticipation.
Still time left in the day, but CME bitcoin:native futures are presently shaping up as a doji at dual resistance, with a wick off the prior heavy volume support in Nov. '25. Sizing up puts in anticipation.
$NVDA Last week wicked above the prior bearish engulfing high, then reversed into another bearish engulfing candle with a firm close near the lows.
That is failed acceptance at resistance, not healthy action.
Bulls need a quick reclaim, or the double top / exhaustion risk stays live.
CME bitcoin:native futures has only printed 3 prior rapid recovery exhaustion matches since 2018.
All 3 made lower lows afterward, with follow through drawdowns of 23% to 50%.
The current 2026 wick rejection is the 4th match and remains pending.
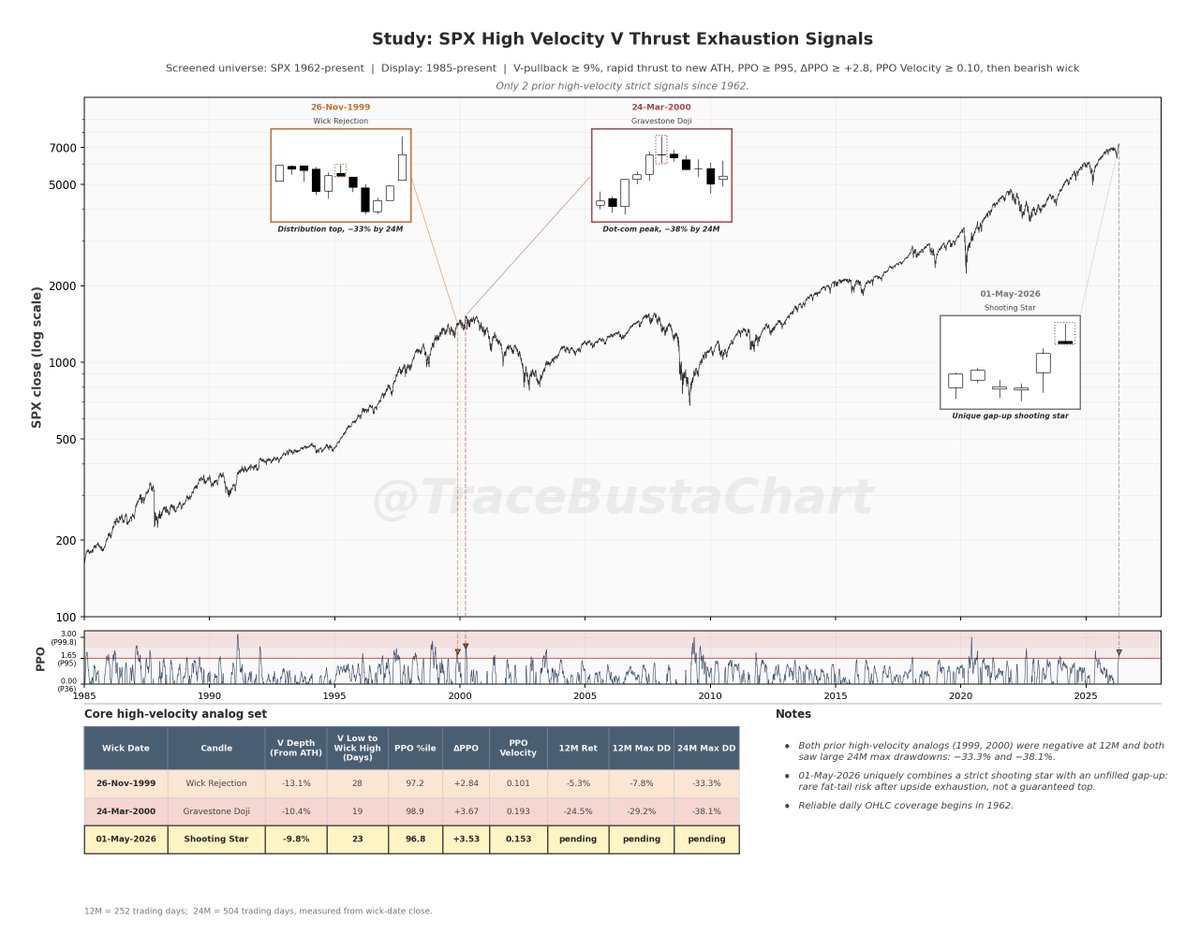
@jasongoepfert Mar 2000 is in your sample and mine. I ran a totally different screen (high-velocity V thrust + bearish wick) and got Nov '99 and Mar '00. Different lens, same week flagged. The current tape clears both. n=2/2 either way, but the overlap is what got my attention.
SPX cash index study for $SPY traders:
The S&P 500 has completed a high velocity V thrust back to new highs.
The setup:
• >9% pullback from ATH
• Rapid recovery to fresh highs
• Daily PPO above P95
• PPO velocity above 0.10
• Gap up shooting star at ATH
• PnF upside counts appear met
Since 1962, only two prior signals cleared the same high velocity screen:
• Nov 1999
• Mar 2000
Both were lower 12M later.
Both saw large 24M drawdowns.
This does not prove a top.
But it does argue the easy part of the V rally may be behind us, and the left tail just got fatter.
Key question: exhaustion after a completed V thrust, or consolidation before the next impulse higher?
$BTC 1hr. PPO compressing at zero line for 2+ weeks. sustained base building while price chops 66-68k. volume drying up in range, sellers exhausting. coiling for direction.
taking a short term long here. markup target 71-73k if resistance absorbs.
4hr and daily breakdown coming. the bigger picture tells a different story. ;-)
@Muhammad_alazab@WyckoffAnalysis I used a price adjusted volume (to normalize) and the divided by M2Real to further normalize. This is to help give better apples to apples comp
Nobody knows what will happen next, but the tape never lies. It shows the footprints of campaigns. Each rally shows weak demand. Until proven otherwise, this looks like distribution. This humble tape reader sees the Composite Man lightening his load. #wyckoff@WyckoffAnalysis