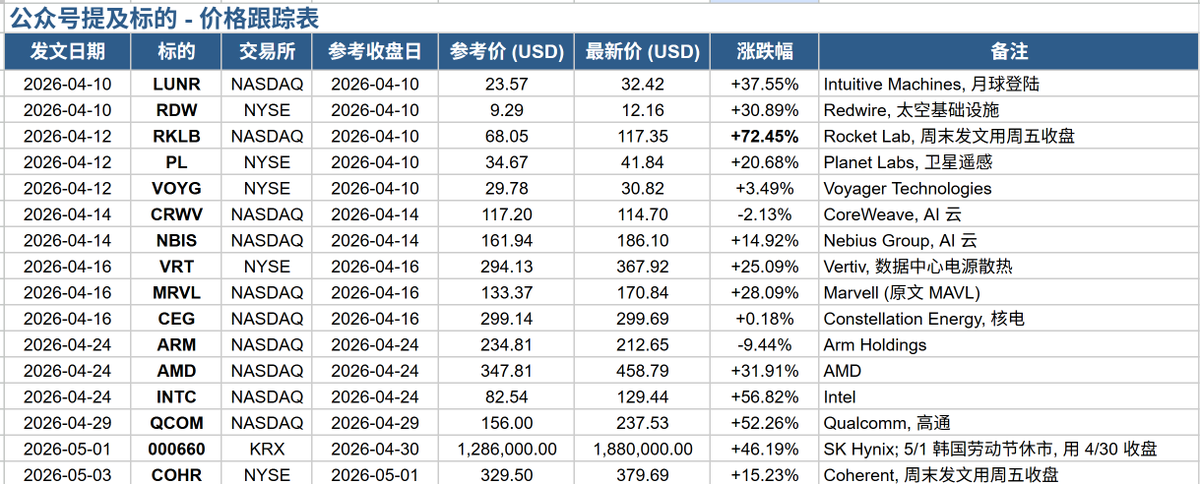
Almost all the information you see on social media reaches you late.
For example, I feel like posts about the security sector and $CRWD have increased lately. This stock already had two or more entry opportunities, and those who entered properly are just waiting for the right time to sell.
Method influencer-type accounts often use is introducing a large number of stocks in advance. Then they quote-post only the ones that went up and highlight them again. Yes, they post nothing about the ones that dropped. Obviously, anyone can do that.
And a few months ago I often saw accounts proudly posting their year-to-date performance, but in the end that's just a good market. Like I said before, those posts mean nothing.
I also don't really like accounts that mostly talk about news and fundamentals. No matter what the news is, it means nothing if the stock doesn't go up, and it means nothing unless I make money.
So never trust anyone, don't let anyone influence you, and believe only in yourself. Value your time and your money.
I'll say it again. Never trust anyone. I only trust myself.
You can see it clearly from the PDF, but the common threads are these three: chart pattern, volume, and accelerating earnings. And most of these stocks build their base during a market correction.
So what we should focus on most is not when the market is rising, but when it's correcting. Not looking at the market just because it's falling is the most foolish thing you can do.
I have no interest in the bottom-picking game. You shouldn't trade stocks that are below the 50SMA. For me, these kinds of stocks can't be risk-controlled, and they're just gambling.
It is one of the great paradoxes of the stock market that what seems too high usually goes higher and what seems too low usually goes lower. - William O'Neil
Let's patiently wait until a good setup forms.
IBD AmericaGreatestOpportunity
If you want to study O'Neil's charts, this PDF is useful. I've saved it and committed it to memory. Not all of it, of course😅
https://t.co/ArQwuzb19G
Also, my app stores charts of the top 20 biggest gainers each year going back 20 years, so I can look at them anytime.
On the database page, I display the earnings details along with index charts on the same screen so I can check the market environment at the same time.
Of course, I save all of my trade history as charts too.
If you're building an app, I'd recommend building a database like this as a place to learn.
As we leave the historically weakest week of the year behind us today, we now enter the 12-Day Midyear Rally: the last three trading days of June and the first nine trading days of July.
Since 1985, the Nasdaq has returned an average of +2.5% during this period and has finished higher 78% of the time.
Earlier, I got a comment that my trading method using the 21EMA structure was difficult to follow, so I'd been thinking about whether I could offer a simpler, more straightforward approach. So I'm going to share my method using the LL-HL structure.
First, I've published an indicator on TV that automatically draws this structure.
https://t.co/CCYbrjGFiA
https://t.co/aZDcm7Uz1t
This time I've released an improved version on the site below, so I'll explain using that indicator. For details, check the posts below.
https://t.co/Lqa3nqVuNt
https://t.co/gwOzsyHw9r
Let's start with the prerequisites🙌
First is RS. I've published the RS indicator below.
https://t.co/lLdJNHTysT
https://t.co/uW2sorplLH
I like stocks with RS21 above 70 and RS63 above 80.
Next, a market cap above 1B and a 50-day average volume above 1M. For volume, it's preferable to have a day within the last 10 sessions that posted the highest volume in 10 days along with a green candle. I call this a PP.
Finally, stocks with ATR% from 50SMA below 5, ideally below 4. Occasionally there are stocks that keep climbing even above 7, but most of them tend to go through a pullback at some point.
https://t.co/twPoMeQbiu
That covers the prerequisites. From here I'll share how to use the indicator. And everything from this point on is determined by the closing price.
First, once the LL-HL structure completes, it's drawn on the chart, and I take a half position at the 1st Pivot. The stop here is the 21EMA Low. Next, the price needs to reach the 2nd Pivot within 5 sessions at the latest, ideally within 3. This is a characteristic of strong stocks. For example, even if the price is still above the 21EMA Low after 10 sessions, if it hasn't reached the 2nd Pivot, I close the position.
Next, after reaching the 2nd Pivot, I add to the position. At that point, the indicator moves the Stop to the 1st Pivot. The 2nd Pivot is an important price line and can act as resistance, so this is to minimize losses in case it drops afterward. It's also most preferable to have a PP occur on the day it reaches the 2nd Pivot.
And once the LL-HL structure is complete, the target points are already drawn automatically as well. These target points tend to act as resistance, so I take partial profits gradually in two stages as the price rises. However, depending on the chart structure, there may not be much room for profit, so my selling method is as follows.
I prioritize taking profit when the gain reaches 25% or more. Otherwise, I place my risk at the 21EMA Low at entry, and when the risk-reward hits 3 or the ATR% from 50SMA reaches 7 or above, I take partial profit on 33% of the position. For the remaining position, I do a final exit when it closes below the 21EMA Low.
One more important point: I prefer clean charts that are properly finding support at the moving averages, like the 10SMA, 20SMA, or 21EMA.
I share the stocks that meet these criteria every day as the Today's Watchlist, where I post stocks that reached the 1st Pivot or 2nd Pivot the previous day, as well as stocks where a PP occurred. I'd be happy if you find it useful.
And if you have any questions, feel free to comment😉
Stop letting volatility scare you, learn to profit from it.
10 years of trading, this is what I know:
• VIX under 20 → sell puts normally
• VIX above 20 → sell puts aggressively
• VIX above 30 → buy LEAPs
• VIX above 40 → go all in
• VIX above 50 → generational opportunity
Fear is just premium waiting to be collected.
If you are not making money during this run:
You are likely trading the WRONG stocks..
For the last few weeks, all I've done was:
-Focus on strong themes (Semis, space, memory)
-Buy these names on pullbacks into the EMA's
-Hold these winners & don't sell too early
Once these start building bigger bases, now you are going to look for rotation into emerging themes.
How to know where to look?
1. Start With Relative Strength
Emerging themes always leave footprints.
You’ll notice:
-Certain groups stop selling off during weak markets
-They recover faster than indexes
-Multiple stocks in the same niche begin moving together
-Volume starts increasing across the sector
For example:
$IGV was making new highs while $QQQ was still below the previous all time highs
This showed relative strength in the ETF, and software stocks began to emerge with strong setups
2. Scan Weekly Charts First
You will start noticing that when almost every stock in a sector is setup on the weekly timeframe.. and explosive move follows.
Emerging themes usually appear first on:
-Weekly bases
-Weekly breakouts
-Multi-month consolidations
For example data centers recently.. all had a massive weekly base
3. Follow Volume Closely
Volume is one of the clearest signs of institutional participation.
You will start noticing:
-Highest volume EVER print
-Accumulation volume patterns
-Low volume sell offs
-A breakout with expanding volume often signals real demand
This tells you that institutions are piling into the trade
4. Watch for “Character Changes”
One of the earliest clues is a change in behavior.
Examples:
-Stocks stop failing on breakout attempts
-Pullbacks become shallow
-Names begin closing near highs instead of lows
-Weak sectors suddenly start holding moving averages
A new theme usually starts with:
-Better closes
-Better reactions
-Better continuation
before the headlines catch up...
For example $PLTR and $HOOD in the last few days.. starting to act much better and changing their characters.
5. Track News Narratives
Themes are often tied to macro narratives:
-AI spending
-Government backing
-Defense budgets
Follow themes, and stocks that have a REASON to go higher.
For example drone stocks last week, after the news that the government might take a stake...
Now this becomes top watch.
6. Focus on the Leader (Most important)
Every theme usually has:
-a leader
-secondary names
-laggards
The leader is where institutions concentrate first.
Your goal is to find the strongest theme, the strongest sector, and the strongest stock in that sector.
Characteristics of a leader:
-breaks out first
-has the best volume
-holds moving averages best
-reacts strongest after pullbacks
Most importantly... stack probabilities
Theme + Catalyst + Setup + Leading stock = super performance
That’s why you don’t put 100% into one position. And that’s why I personally won’t go above 30% on any single idea.
If I’m completely wrong, truly wrong I think my downside is around 20%. On a 30% position, that’s about a 6% hit to the portfolio, which I can live with on my highest-conviction idea.
But if I’m right, I think the upside could be 200%, which would translate into roughly 60% upside on the portfolio.
At least to me, that risk-reward makes sense.
Go Big or Stay Average
A few days ago I wrote about limiting beliefs. This is the year in my career where I actually become wealthy, where the returns are so insane that even for me, it’s hard to fully accept them. And because of that, I catch myself hedging, selling covered calls, trying to “manage” the upside.
But if there’s one thing you can learn from Leopold, the 24-year-old kid who became a billionaire last year, and something I’m still learning myself, it’s this:
When you have a high-conviction position that you understand better than anyone else, you go all in and you leave it alone.
You let it run.
1% to 3% positions won’t change your life. You don’t put your best ideas at 2%, 3%, or 5% of your portfolio. If your conviction is real, you put at least 10% into it. Otherwise it’s almost a waste of time.
But this only comes after proving to yourself, again and again, that your process works. That the logic you developed, the pattern recognition unique to you, consistently finds winners.
That’s why it has to be your way.
When I buy a stock I deeply understand, I now put 20% into that position, look at $ZIM, $URGN, $AMZN look at $STAA. In a new position I started this week I already put 30% of my portfolio, more on that on Monday. People who copy me put 1%, 2%, maybe 5%. And that’s the difference:
Only when you’ve done the work yourself do you have the conviction to go big.
As long as you genuinely believe your research is exceptional, and you’ve proven to yourself over and over again that you can identify winners better than the crowd, then let the position reach its full potential.
Stop capping it with hedges. Stop selling away the upside with covered calls. Stop doing things that protect you emotionally but limit what the position can ultimately become.
Bottoms are much easier to call than tops. Panic as measured by the $VIX, usually does not last forever. At some point, the pain of the drawdown and the damage caused to society becomes so large that governments, central banks, investors, and companies are forced to change behavior.
But tops are almost impossible to call. Greed is a natural human phenomenon, and unlike panic, greed can last for years. People can stay irrational, euphoric, and overly optimistic much longer than anyone expects.
$QQQ Ratio Spreads - How I See It
Took profit on the $QQQ spread I wrote about last week (opened for ~0, closed at 1.55 - about $27,000 in cash).
The logic: it’s already a large premium to risk if markets don’t pull back.
Replaced it with the spread below, which I opened for approximately $0.10, including a 660 put (higher strike than the previous 655), and sold some calls within the structure.
Max profit occurs if $QQQ falls ~3.5% from here by the end of the week. It’s hard for me to imagine a much bigger drawdown by Friday with how weak the $VIX has been acting.
My risk is if $QQQ moves more than ~2% higher after tech earnings. I’m okay with that -if we squeeze higher, I’d likely give back the ~$27,000 I already made anyway, which I would have lost if I hadn’t closed the previous put spread.
But on the downside, this new structure pays significantly better than the previous one after the recent move up in $QQQ.
$QQQ: Trade Review - Either Way I Win
We’re currently seeing two main forces driving the market.
On one hand, earnings are solid and momentum is very strong as we see a historic run in tech. On the other hand, the situation with Iran doesn’t seem close to being resolved.
At the start of last week, I said a small pullback was likely after markets had gone parabolic. I was clearly wrong on that call-you cant argue with price .
But because of how I structure my trades around my views, I still make money-as long as I’m not wrong about a major correction.
This is exactly why I don’t believe in traditional hedging. The only hedges I find useful are more creative tools like $VIX exposure or ratio spreads.
I use ratio spreads when I see a reasonable probability of a shallow drawdown. I use $VIX when I believe there’s risk the market is not pricing in-when volatility is cheap and asymmetry is attractive.
There’s no straightforward way to hedge a portfolio that is consistently beneficial, in my view. You have to hedge what you believe is actually coming.
So yes, I made the wrong call in terms of timing-I expected a shallow drawdown and suggested a ratio spread.
But since it was opened almost for zero cost, it’s still profitable. And if we do get a pullback this week, it could become VERY profitable.
Either way, I win.