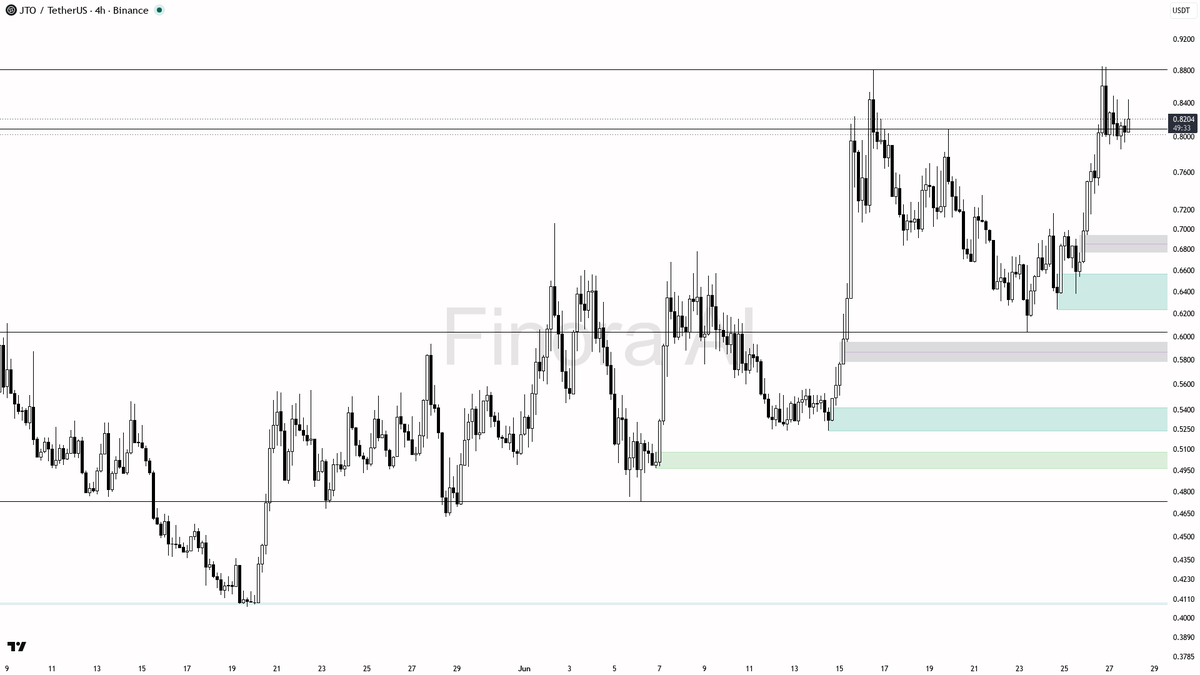
hey! checking out $JTO #JTOUSDT on the 4h for you, let’s see what’s lining up 👀
- expecting price to RISE from current 0.8205, targeting 0.8441 first, then 0.8808 next 🚀
- bias is LONG as long as price holds above the 0.8086 support and the fair value gap at 0.79-0.80
- ideal entry: look for a bullish rejection or reversal pattern above 0.8086 or after a sweep into the 0.79-0.80 fair value gap, with confirmation like a strong bullish engulfing or LTF reversal
- take-profit targets: 0.8441 for partials, 0.8808 for full
- if price closes below 0.8086 and especially under 0.7930, bias flips to SHORT and I’d expect a move down to 0.7361 or even 0.6834
- not investment advice, educational report only
📊 Need more detailed analysis, trade signals?
Try Finora AI Telegram Bot for free - https://t.co/SaG80BFquJ
If $NEAR stands like it does and next week will be green, it's very likely that the following takes place:
- MACD continues to remain bullish.
- It holds a higher timeframe support and is therefore flipping multiple MA's in a bullish manner for the first time since 2024.
Extending the trend by the Fibonacci extension tool would mean that we'll be seeing a continuation towards $4.50-5.00 in the next upwards move.
That could take place in Q4 2026/Q1 2027.
All the liquidity beneath the lows are taken for $NEAR and there's a strong bounce upwards.
That's a great sign.
I'd like to see €1.70 break as resistance and flip for support, which I assume will be happening in the coming 24-72 hours.
The most obvious spot: the €1.20-1.35 area is probably not going to be hit, unless Bitcoin breaks even further south and the markets are continuing their downwards fall.
If that doesn't happen, then this is your area to be buying $NEAR into.
That's the sweep on $NEAR.
I'd like to see a reclaim of the €1.70 area as an additional confirmation of a trade.
However, if you'd want to be interested into a position into this one, then these are the ranges that you want to accumulate.
If the markets continue to fall (in that case; Bitcoin), then I'm looking to accumulate a lot between €1.20-1.40.
$ZEC is sitting on edge of liquidity on both ends.
Lots of liquidity waiting $430-$440 and below liquidity till $350.
If buyers keep defending current price could get pulled straight into that zone.
This is why I spend more time watching liquidity than predictions.
The chart always tells you where the market wants to go before everyone else notices.
$SOL
Solana is attempting a larger wave 2 recovery, but the broader trend remains bearish. The preferred view is still that the current advance is a corrective rally within the bear market.
Leading Scenario: The preferred white count remains bearish, with the rally from the June low viewed as a wave 2 bounce. The first major resistance is between $73.18 and $89.40. A break above this zone, combined with a clear 5-wave advance, would increase the probability that a more meaningful bottom is forming.
Risk Scenario: The orange scenario remains a valid alternative, allowing for the larger correction to have already completed. However, a break above resistance alone would not confirm a trend reversal. A completed 5-wave advance followed by a corrective pullback is still required.
Key Support Levels: Current micro support
Key Resistance Levels: $73.18-$89.40
Bottom Line: The preferred outlook remains that the current rally is corrective. A confirmed bottom requires both a break above resistance and a clear 5-wave structure to the upside.
This is the period to be accumulating a position on $NEAR.
I'm waiting for slightly deeper levels and confirmation of reclaims of support.
If that happens = good signal for the markets and that's probably the sign for a new leg upwards for this one.
If that doesn't happen, then I'll wait for lower levels to go for a potential position.
Overall, remaining long on my altcoin portfolio and these trades are solely for daytrading purposes.
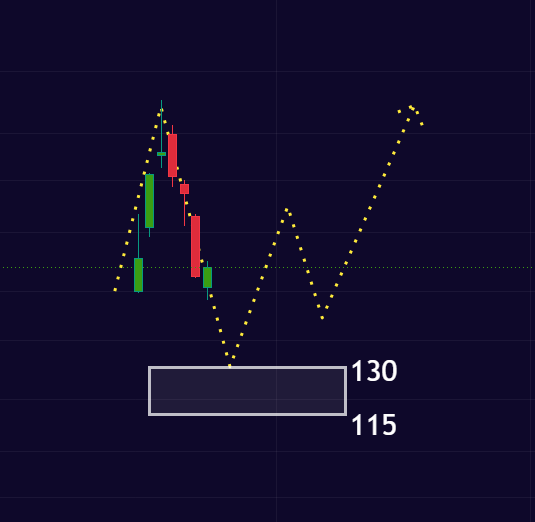
$SPCX Bottom Target: (1) a 20-25% of discount from IPO price is reasonable for a solid bottom, which is around $115-120 zone. (2) whoever chased the Big Rocket launching over the last week may need to hold the bag for some time; (3) a second launch would be more reliable/valid.
$NEAR
The price may be developing wave C of a larger wave 4 recovery. The market reacted from the support zone between $1.76 and $1.97 and is attempting to move higher.
Leading Scenario: The advance from the June low may represent the start of wave 5. A move into the target zone between $3.16 and $3.57 remains possible and could slightly exceed the previous June high.
Risk Scenario: The rally from the June low remains a 3-wave move and therefore corrective. A break below $1.83 would increase the probability of a local top and shift focus toward $1.24 and potentially $0.86.
Key Support Levels: $1.83 / $1.24 / $0.86
Key Resistance Levels: $3.16-$3.57
Bottom Line: The recovery remains valid while $1.83 holds, but the current structure is still corrective.
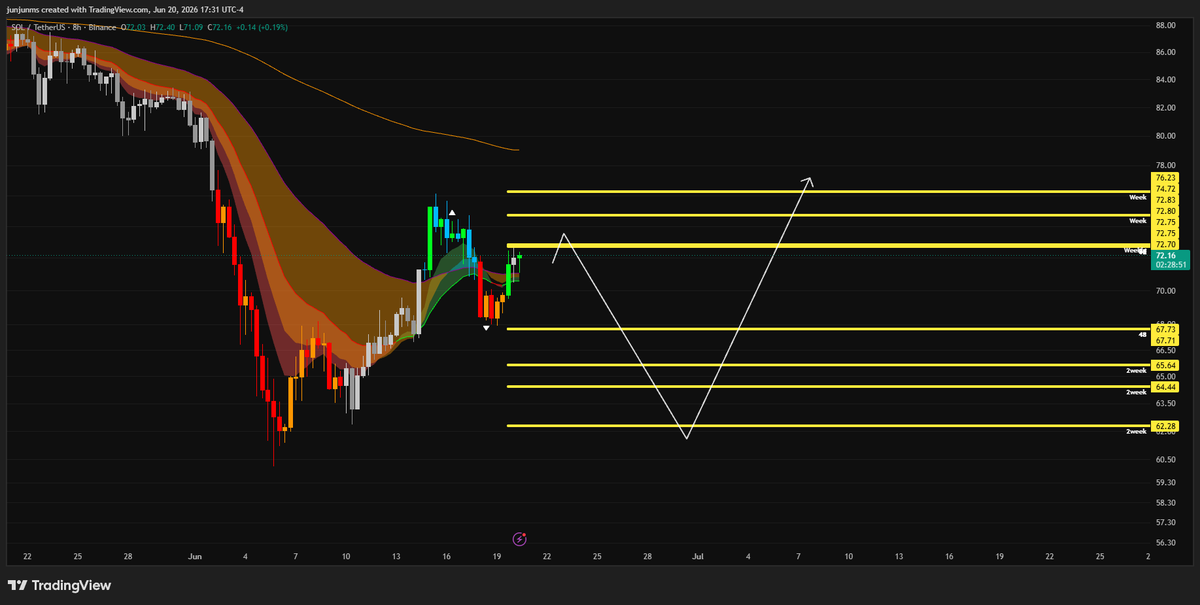
solana:So11111111111111111111111111111111111111112 Solana has reacted from micro support, keeping the wave 2 bounce scenario alive. The rally remains corrective and is now testing resistance.
Leading Scenario: Support between $63.12 and $69.43 continues to hold. Price has reached the 78.6% retracement near $74 and is testing resistance between $72 and $75. A break above this area would increase the probability of a larger wave 2 extension toward $82-$89.
Risk Scenario: The move up remains corrective. A break below $63 would increase the probability that the white bearish count is underway and that a larger third wave decline has started.
Key Support Levels: $63.12-$69.43 / $63
Key Resistance Levels: $72-$75 / $82-$89
Bottom Line: The bounce remains valid while support holds, but it is still corrective. Resistance between $72 and $75 is the key area to watch.
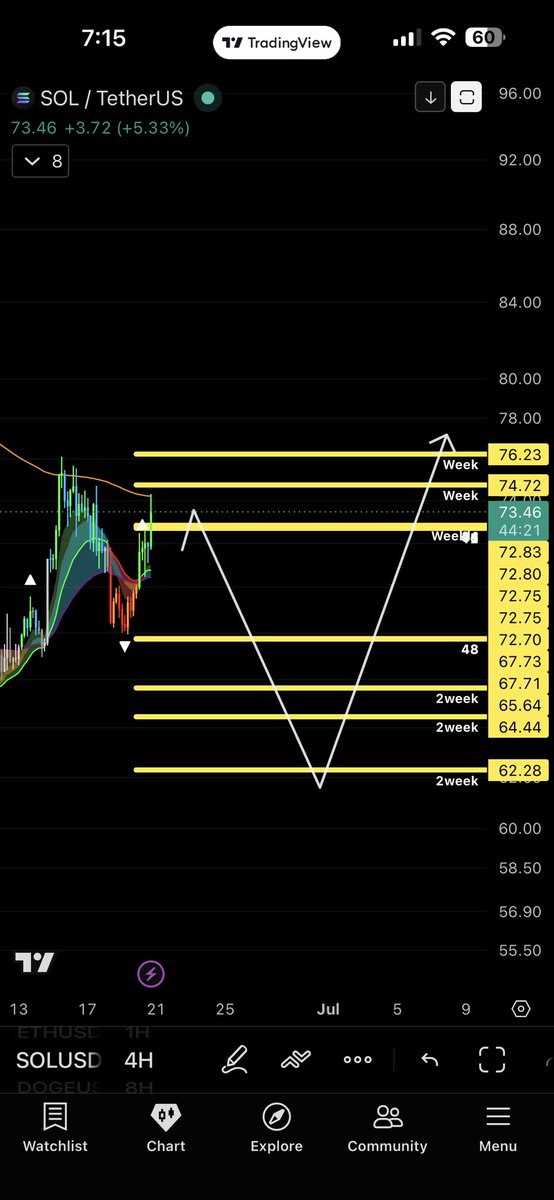
What I see with $SOL.
Liquidity cluster at $72.7 which is also the UBB4H. Raid it...
Then we retrace for delete all these swingers in the bottom and back to $76 zone.
Let's follow up