Paul Tudor Jones predicted the 1987 crash, made $100 million, then spent years trying to destroy this footage
you will watch him lose $6 million in one afternoon, sit in his chair and say "total devastation" then make it all back with 100% interest
This documentary will change how you think about risk forever
Bookmark & watch it. Then read the post below - $90 billion from being right just 54% of the time↓
🛢️ Oil slides as the geopolitical premium eases—gold reacts fast
📊 $XAUUSD bulls eye a move back above $5200 after a volatile session
🥈 Silver tracks the ratio shift, with $86–$87 as the hurdle for $XAG
https://t.co/YrpfBnD4dd
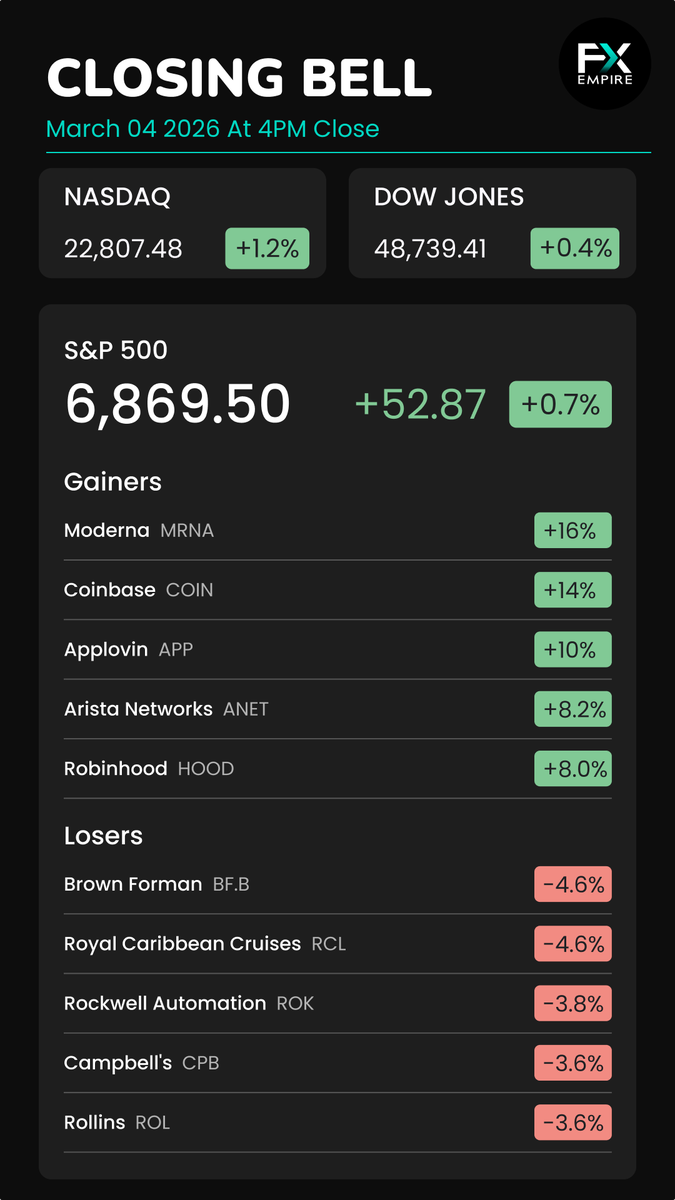
🔔Check out today’s S&P 500 movers & shakers at the closing bell!
$MRNA, $COIN, $APP, $ANET, $HOOD, $BF.B, $RCL, $ROK, $CPB, $ROL
Which one caught your eye? 📷 $SPY $DIA $QQQ
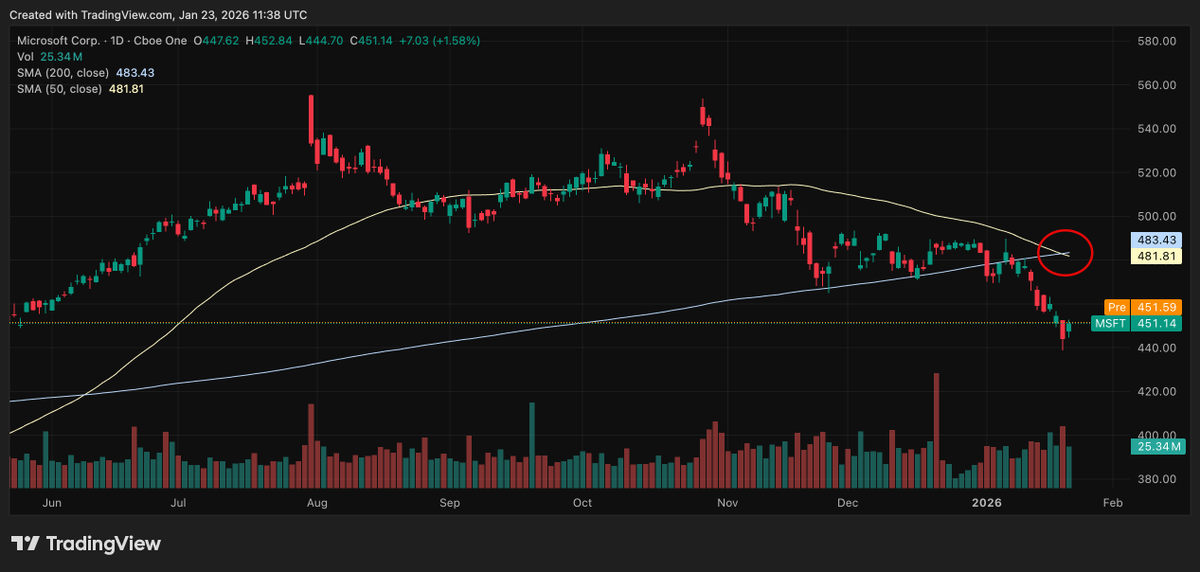
A Death Cross has formed on the Microsoft (MSFT) daily chart. The stock has slid about 10% in recent months, erasing much of last year’s gains as investors grow uneasy over ballooning spending on AI infrastructure, cooling enthusiasm for generative technologies, and intensifying competition from Google.
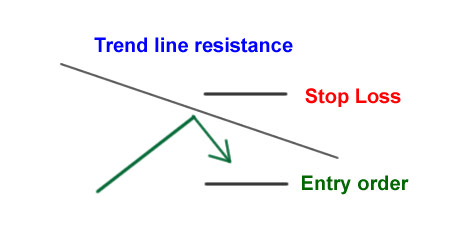
Instead of simply buying right off the bat, we want to wait for it to bounce first before entering. If you’ve been looking to go short, you want to wait for it bounce off resistance before entering. #thebounce https://t.co/6K7f3l72MS
edgeful is a statistics-based trading platform that positions itself as a personal financial analyst, transforming raw market data into actionable insights for traders. @edgeful#trading#forex#futures#stocks
https://t.co/pgMjBQs0Jl
As a career chartist who has made my living trading into my sixth decade trading, here are the things I disregard:
-Complex narratives (if interest rates do X, then stocks should do Y and metals should do Z). I find creating cross asset narratives to be a complete waste of my time
-Indicators. These are derivatives of price. Why study a derivative of price when I can study price directly?
-Seeking perfection
-Thinking that economists know anything useful
-Day trading
-Pyramiding
-Believing that CNBC or Bloomberg or any You Tuber have anything to offer me
-Government reports. They simply create volatility, not meaningful direction
-Day to day volume. I only pay attention to massive spikes in volume, which are either ENDING or BEGINNING volume
-Trendlines
-Symmetrical triangles (except every so often)
-The idea that charts predict the future
-The idea that charts provide a meaningful edge
-Win rate as an important metric
-ROR as an important metric
Attention Z and younger M geners
The past 15 years has been an enormous outlier in terms of the profitability of selective assets
Prepare yourself for more difficult times
Bitcoin has increased 35-fold from the 2018 low
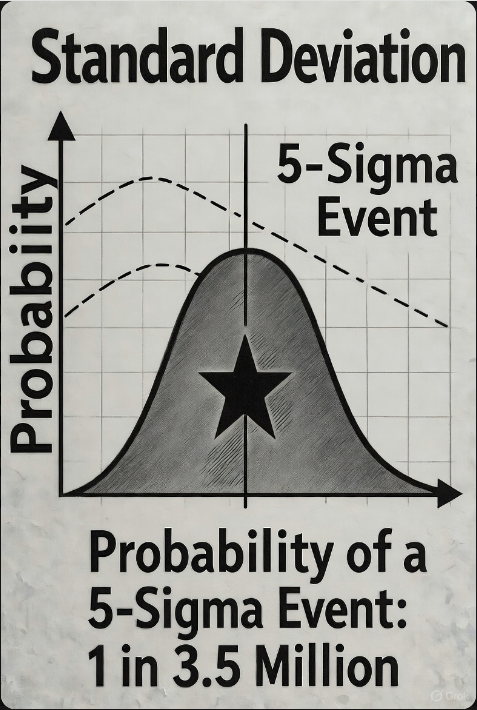
You have a higher chance of being struck by lightning twice (~1 in 9 million lifetime) than picking a random asset that goes 35×’s in 8 years. We are talking about 4 to 6 sigma events
Those that doubt me -- please take the other side of every trade I do
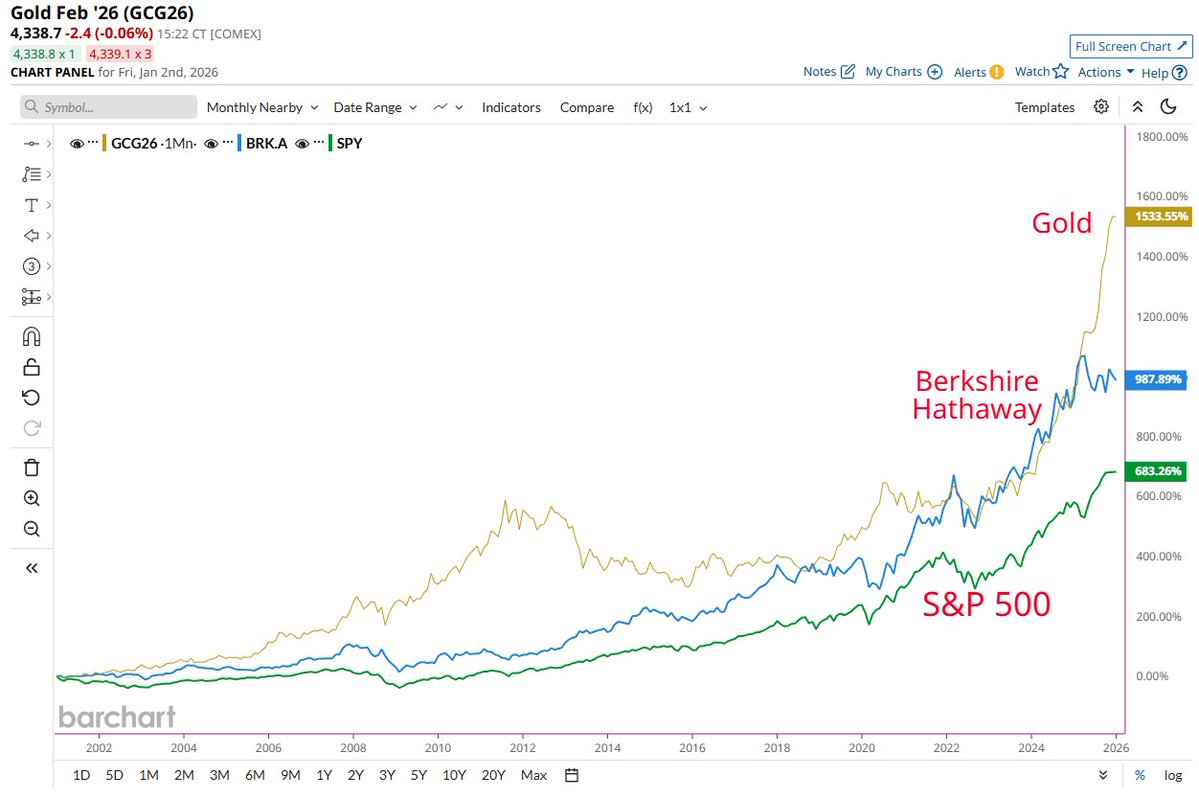
1. Stocks: all-time high
2. Home Prices: all-time high
3. Bitcoin: all-time high
4. Gold: all-time high
5. Money Supply: all-time high
6. National Debt: all-time high
7. CPI Inflation: 4% per year since Jan 2020, 2x the Fed's "target"
8. Fed: cutting rates again next week
$BTC had a sharp rejection from the $113,500-$114,000 resistance zone.
Bitcoin is back towards the $108,000 support level, and this needs to hold strongly.
If BTC loses this level, expect a correction towards the $100,000 level.