– Izquierda: el icono ortodoxo más antiguo de Cristo Pantocrátor (Χριστὸς Παντοκράτωρ, «Cristo Soberano de Todo»), del siglo VI. Encontrado en el monte Sinaí (donde Moisés recibió la Ley), en el monasterio de Santa Catalina, donde también se encontraron algunos de nuestros manuscritos bíblicos más antiguos e importantes (por ejemplo, el Codex Sinaiticus).
– Derecha: una reciente recreación de Jesús realizada con inteligencia artificial basada en el controvertida Sudario de Turín.
Dejando a un lado la centenaria controversia sobre la autenticidad de la Sábana Santa, obsérvese el asombroso parecido entre el icono más antiguo de Cristo y la imagen de Jesús generada por IA.
¿Qué significa todo esto para nosotros los que creemos?
Contundentemente y sin duda alguna: que el gran misterio de nuestra santa Fe no se basa en mitos, fábulas o supersticiones, sino en la historia real. ¿Y cuál es ese gran misterio? El Apóstol San Pablo nos escribe:
– "E indiscutiblemente, grande es el misterio de nuestra fe: Él (Dios) fue manifestado en la carne ..." (1 Timoteo 3:16).
El gran misterio (μέγα μυστήριον) de la Encarnación del Hijo de Dios: es decir, el Mesías prometido por los santos profetas de la antigüedad no solamente es Rey y Salvador, más que eso, es la Deidad encarnada, el Hijo de Dios en forma humana, Emmanuel (עִמָּ֥נוּ אֵֽל), "Dios con nosotros" (Isaías 7:14).
El Hijo que le nació a la virgen María es verdaderamente Dios, verdaderamente Hombre. Como declaró el Apóstol San Pedro de Él:
– "Tú eres el Cristo, el Hijo del Dios viviente" (Mateo 16:16).
Y el Apóstol San Juan igualmente:
– "En el principio existía el Verbo, y el Verbo estaba con Dios, y el Verbo era Dios ... Y el Verbo se hizo carne, y habitó entre nosotros, y vimos Su gloria, gloria como del unigénito del Padre, lleno de gracia y de verdad" (Juan 1:1, 14).
He aquí el gran misterio de nuestra santa Fe Cristiana: que Dios el Padre, por Su gran amor por nosotros, nos ha entregado a Su único Hijo, para que creyendo en Él, en Su verdadera deidad y en Su verdadera humanidad, por medio de Su gran sacrificio en la Cruz, seamos nosotros incorporados a la santa familia de Dios, que es la Iglesia: el cuerpo universal de creyentes que profesan al Hijo de Dios que se encarnó en el vientre de la virgen.
¡Aleluya! ¡Aleluya¡ ¡Aleluya!
Pronto le veremos cara a cara y nos sentaremos al mesa con Él, mientras tanto, militemos fielmente por Él y por Su reino imperecedero, que es la santa Iglesia, el verdadero Israel de Dios. Amen.
#AlertaPhD 🚨
Abierta plaza de #Doctorado en ESPOL
Estoy buscando reclutar un candidato en #SIG y #SensoresRemotos para el proyecto "Identification and Prediction of Urban Sprawl", en cooperación con la Universidad Federal de São João del-Rei 🇧🇷, Universidad Federal de Viçosa 🇧🇷
Did you know we can measure household wealth using daytime satellite images?
How does this work?
Here’s the breakdown:
The original research came from @nealjean1 at @StanfordAILab.
They created a novel way of using machine learning to predict household income using daytime satellite imagery.
Why satellites?
Satellite images provide detailed insights of the world — and they can tell us a lot about economic activity.
But satellite images can be hard to make sense of and analyse.
While deep learning is good at recognising objects and patterns in images, they usually need a lot of examples to learn from.
This is a problem as most places in the world don’t have detailed household-level data on economic activity.
To deal with this, we can use a method called "transfer learning."
Introducing Transfer learning
First, a model is trained on available data, even if it's not perfect.
Next, a model is used to predict economic information like wealth of villages or neighbourhoods.
Here’s the process:
Step 1: Intersecting daytime with night time satellite images
As I’ve discussed previously, luminosity (i.e. data from night time satellite images) is a reliable proxy for economic activity at a granular level:
https://t.co/vIyB4eGzla
Luminosity within a country is then categorised into three levels:
• ‘high luminosity’,
• ‘medium luminosity’, and
• ‘low luminosity’
Daytime satellite images are overlaid on top of these night time images.
Step 2: Feature extraction
A neural network is then used to extract the elements in a daytime satellite image that correlates with each category of luminosity.
The output of this model are thousands of features (from the daytime satellite imagery) that explains the category of luminosity for each village/neighbourhood.
Step 3: Predicting poverty
Machine learning models (ridge regressions) are used to estimate poverty at a granular level.
These are validated by comparing the model’s results to ‘ground-truth’ survey data from @DHSprogram and the World Bank’s Living Standards Measurement Surveys.
Impressive outcomes:
The results found this approach can:
• Outperform methods using night lights or cell phone data
• Estimate wealth in new (out-of-sample) countries
• Use freely available data
This pioneering work was published in @ScienceMagazine:
And has led to replication from many organisations from the ADB to the World Bank.
The use of daytime satellite images in economic studies is still in it's infancy.
I'm excited about what's to come.
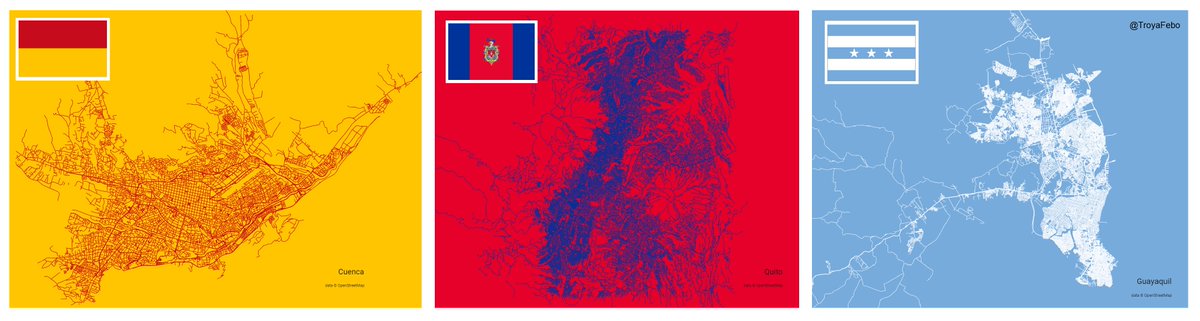
This is my summary of the #30daysmapchallange. It was my first time and unfortunately incomplete but a great experience, I hope to contriobute with more during this year and in the next year's challenge. #maps#Ecuador#rstats#rstudio#gis
Where do you find happiness? This is the question we answer in the SMILE Project, explained by our colleague Eva in the video below. Show us where you are happiest by posting a picture using #voteforyoursmile 😊
Vote for SMILE now at https://t.co/izNJgw9Zsx until November 30!
2021 energy consumption by province in #Ecuador is very different from consumption per inhabitant. In image#1, #Guayas stand out with a greater population and economic activity. In image#2 #Zamora and #Sucumbíos with much less population but with a mining and oil industries #maps
📚SORTEO INTERNACIONAL 📚
Junto con @ElMundoTolkien, sorteamos la EDICIÓN ESPECIAL ILUSTRADA de The Lords Of The Rings (Inglés) O la trilogía de El Señor de los Anillos (Español), ¡a elegir!
Requisitos:
- RT este tweet 🔁
- Seguir a @ElMundoTolkien y @ToIkienverse
- Menciona a un amigo
Finaliza 01/12/23
When trying to capture on a map a surface that is spherical, cartographic distortion produce alterations in the shape, size, and areas of the surface. The image shows circles that deform at high latitudes, the same goes for the size of the northern countries. #cartography#QGIS