I've initiated a position in $VLN ($155M MC).
This one is wild.
Valens is a AI semi for self-driving cars and robotics.
I've found that markets messed up on VLS from a ticker collision data error.
And missed new CES 2026 info this week.
VLN has:
1. $93.5M in Cash, 0 Debt.
2. ~$11M inventory
3. High gross margins ~69.1% (CIB/ProAV) margins, 43.2% automotive.
and projected to do $70M+ revenue with blended 63-65% gross margins, jumping from 43% from their automotive pivot from CES.
At $155M MC. What?
This just looked way too off at first glance, so I had to do more research, whether it was revenue collapse, dilution, cashflow problems, or regulatory risk.
What happened?
The mispricing was from an analyst/scanner typo regarding a $82M "inventory burn":
VLN is effectively a company with $93.5M Cash and Zero Debt for an EV of ~$65M, while the market has punished it for an "inventory crisis" that literally does not exist.
Streetwise's analysis + other scanners around Nov 13, 2025 typo'ed their report when they erroneously stated: "Inventory of US$82 million remained in line with the end of the second quarter".
The market and algorithms that scan for the reports thinks $VLN is sitting on >1 year of dead inventory ($82M) and burnt through their $93.5M cashpile on unsold chips.
We can mathematically prove this is a typo using the company's official Q3 2025 balance sheet:
Total Assets: $136.7M
Cash: ~$93.5M
Remaining Room for Assets: $136.7M - $93.5M = $43.2M.
If inventory were actually $82M, Total Assets would have to be at least $175M ($93M cash + $82M inv). This inventory figure is mathematically impossible.
After looking at their financial reports, they are sitting on just ~2 months of inventory ($11M), only selling what they make.
The analyst + algorithms wrote spread the report confused Valens Semiconductor (VLN) with Velan Inc. (https://t.co/oJVlzuwtoL), a Canadian industrial valve manufacturer (with that inventory amount).
Even LLMs that read this, completely messed up and required manual review.
$VLN actually only has ~$11M in inventory as a fabless chip company and did not burn through $82M.
This looks like a genuine market inefficiency because you are looking at a clean balance sheet ($93M cash, $11M inventory, $0 debt) that has been artificially suppressed because of $82M cash burn fears on dead inventory due to the type.
_
Now, the secondary aspect is new CES information that came out.
$VLN spent years and millions on R&D for DSP engines for Mercedes, which presented single customer concentration risk for the automotive segment.
But from the CES release this week, they've effectively took the same that exact same engine, and managed to sell it to many hot verticals that have the exact same physics problem. They've also managed to scale their previous automotive segment with new T1 automotive OEMs.
But regarding their (VS6320 vs. VA7000) chipset, they are using the same Core IP (DSP).
Medical Chip: They took the same engine from the auto chip and stripped out the car-specific features to create a Extender for the medical segment .
And my favorite is the Machine Vision/Robotics vertical:
The new information is that with the RGo Robotics partnership they announced, RGo integrated Valens chips which allowed RGo to design robots where the cameras are far away from the brain without signal loss. And at CES they also announced one with CIS Corporation (a Japanese camera maker) for another specific robotics win.
They've effectively diversified their automotive segment into multiple other high growing + higher margin verticals for robotics computer vision to others.
Again, the alpha is that their new robotics segments announced at CES, operate on a 6-month sales cycle, not the 5-year automotive cycle. So revenue actually hits this year too.
Also, analysts were using blended automotive revenue (Mercedes, etc.) has lower gross margins (~42-45%).
The new growth coming in now (Robotics/Medical via VS6320) has significantly higher margins (VS6320 Gross Margin: ~69-70%), so the the blended gross margins will likely come in significantly higher than street consensus.
_
Now the downside?
Extremely heavy dilution at $11.5 Strike from warrants (which is 10X+ from here).
This will cap upside if it ever increases 1000% from $1.5 to $11.5
_
TLDR:
The market expected 2026 with high cash burn from inventory risk from a ticker collision typo. Instead, they are likely to get:
Revenue and earnings beat (driven by new verticals and much higher blended margins ~69%+ from new chip). As well as an $70M+ cashflow beat from the typo.
We could see $85-$92M revenue off 63-65% blended gross margins and that $82M+ in cash modeled back into this $155m company.
The algorithms are pricing $VLN as if it has <1 year of runway due to a phantom $82M inventory pile (off of a poison pill data point). So this is my own personal thesis from public information synthesis on why I entered this trade, NFI.
So while I don't expect this to be a $2B+ company, the current MC is just completely irrational pricing for a
$155M MC semi:
- with $93.5m in cash
- $11m in inventory,
- est. $80m+ revenue (growing 20%-30%+ Y/Y)
- with 60%+ gross blended margins.
Fabless semi companies with 60%+ gross margins typically trade at 4x–8x EV/Revenue and sector average valuations would be $493.5M, from $155m as a conservative base case.
Just slight "AI/Robotics" Premium, could value it at $653.5M with 7 E/V (~320%+)
TLDR: Found that this company likely got artificially suppressed because of a typo + ticker collision from false $82M inventory burn and is about to enter a newer higher margin + growth cycle from new verticals.
I am taking advantage of a database collision error.
Right now the tariff market is pricing pharmaceuticals as the top candidate at 53%, ahead of critical minerals at 39%.
But the stock market does not always reward the highest-probability headline.
Critical minerals already has real policy momentum, and $MP has shown it can react violently when Washington backs domestic supply. Sometimes the best trade is not the likeliest event, it is the event with the clearest transmission into stocks.
#Tariffs #Macro #CriticalMinerals
Most people will look at this board and chase the highest probability bill. I think that is the wrong framing.
ROTOR may be the cleaner headline, but the better stock trade is still critical minerals. $MP already showed what government support can do, and stockpiling is one of the few policies that can change financing, pricing and strategic demand at the same time.
On the other side, the real risk sitting here is chip policy. We already saw $NVDA get hit hard when export controls tightened. If Congress adds more licensing and security friction, that is not just a headline, it is revenue and multiple pressure.
The best trade is not always the most likely event. Sometimes it is the event with the clearest transmission into earnings and positioning.
#Stocks #Macro #RareEarths
Most people are looking at $HIMS the wrong way.
They see a company selling weight-loss drugs.
But the real story might be something else:
$HIMS is quietly building one of the largest direct-to-consumer healthcare audiences.
A quick story.
Years ago, Robinhood didn’t make much money either.
They simply captured millions of retail traders with free trading.
Only later did the monetization arrive: options, margin, crypto, subscriptions.
Meta did the same thing.
First came the users.
Then came the money.
Now look at $HIMS.
Hair loss.
ED.
Mental health.
Weight loss.
Millions of people now go directly to HIMS instead of traditional healthcare channels.
GLP-1 drugs may have been the biggest customer acquisition engine in digital healthcare.
Even if regulation changes that market, the audience is already there.
And healthcare is not a small market.
It’s a $10–16 trillion global industry.
If HIMS can keep those users and expand into areas like hormone therapy, diagnostics, longevity medicine, or subscription care, the business model starts to look very different.
Meanwhile, short interest is still extremely high.
That means the market is still debating whether this is a temporary hype cycle… or the early stages of a consumer healthcare platform.
Sometimes the biggest opportunities appear when the narrative is still being written.
#HIMS #Healthcare #Stocks
WTI did the hard part already: it proved the market will pay a huge geopolitical premium when supply fear gets real.
But today’s reversal matters just as much as yesterday’s spike.
Oil went from panic near 120 to the high 80s fast. That tells you this is not a clean sustained-shock trade yet. It is a headline-driven volatility regime.
So the stock setup changes:
$XOM and $CNQ look like the sturdier expressions if crude holds elevated.
$EC and $NOG still have the most torque, but they are now whipsaw trades, not clean breakouts.
FTI only gets really interesting if high oil lasts long enough to change capex expectations.
#Oil #Macro
The “Fed cuts in 2026” market is basically pricing a soft-landing easing: most weight sits on 1–3 cuts, with an implied ~2.6 cuts (~65 bps).
That’s why the purest winners in my watchlist aren’t the flashy names:
$AGNC/$NLY (mortgage REITs) and $IIPR (REIT). When the discount rate falls, yield assets get re-rated.
But don’t ignore the tail: if we drift toward 7+ cuts, it usually means “something broke”… and $GLD becomes the quiet winner while credit/cyclicals start sweating.
Base case: $AGNC $NLY $IIPR + duration tech ( $NVDA, $LRCX)
Tail hedge: $GLD
#Fed #rates #markets
Most people think the Anthropic vs US Gov fight is about AI politics.
It’s actually about who controls the $10B+ Pentagon AI stack.
Prediction markets show 95% probability the Department of War uses OpenAI models.
That means the real winners aren't AI labs.
They are the infrastructure behind them:
$NVDA GPUs
$MSFT Azure
$PLTR defense AI
History repeats itself.
When the Pentagon awarded the JEDI cloud contract in 2019, Microsoft stock rallied ~35% the following year.
Government contracts can lock in multi-year AI spending cycles.
The quiet trade here is defense AI.
If Pentagon AI budgets scale from ~$1.8B today toward $10B+, companies like Palantir could see enormous demand growth.
AI wars won't just be fought by models.
They'll be fought by infrastructure and data platforms.
#AI #DefenseTech #Macro
Iran succession is an underpriced macro catalyst.
If the Supreme Leader transition turns unstable, markets will immediately price geopolitical risk.
History tells the story:
• 2018 Iran sanctions → oil +50%
• 2020 Soleimani strike → oil spike overnight
• Middle East tensions → gold rallies
Watch the leverage points:
Energy: $NOG $XOM
Uranium: $CCJ
Gold: $NEM $FNV
Political succession can become an oil shock faster than people expect.
#Macro #Energy #Geopolitics
CPI markets are clustering around 2.5–2.8% core inflation.
That’s the Goldilocks zone: cooling inflation without recession risk.
Historically when CPI lands there:
• AI semis rip
• fintech rallies
• rate-sensitive growth squeezes
The real “no-matter-what” winner though?
$NVDA
AI capex doesn’t care about CPI.
The hyperscaler spending cycle is already locked in.
#AI #Macro #CPI
SpaceX IPO chatter is heating up.
Prediction markets now show ~78% odds Musk announces it before Sept 2026.
If that happens, watch the space ecosystem:
$RKLB (launch)
$PL (satellite data)
$BWXT (space propulsion)
Every mega IPO creates comps.
Alibaba lifted Chinese tech.
Snowflake lifted cloud.
A SpaceX listing could reprice the entire space economy.
The real trade isn’t SpaceX — it’s the public proxies.
#SpaceEconomy #IPO #Macro
Prediction markets now price ~97–98% odds that a US court orders tariff refunds before 2026.
If tariffs unwind, history suggests a clear sector rotation.
In the 2018–2019 US-China tariff war:
• $NVDA fell ~45% peak-to-trough
• $MU dropped ~50% as China demand weakened
• Global semis sold off as supply chains froze
But when trade tensions eased in 2020, the same names rallied sharply as supply chains normalized.
If tariff refunds happen, the macro chain reaction looks like this:
Tariffs ↓
Import costs ↓
Goods inflation ↓
Fed pressure ↓
Global trade ↑
That favors import-heavy tech and semiconductors.
Most sensitive tickers from my universe:
Bullish
• $NVDA
• $AMD
• $TSM
• $AMAT
• $MU
• $AAPL
• $AMZN
Bearish (tariffs currently protect them):
• $MP
• $UAMY
Historical pattern: whenever trade friction fades, global supply chain stocks outperform domestic resource protection plays.
Watch semis closely — they tend to front-run tariff policy shifts months before official rulings.
Prediction markets might be signaling the next rotation.
#Macro #Stocks #Semiconductors
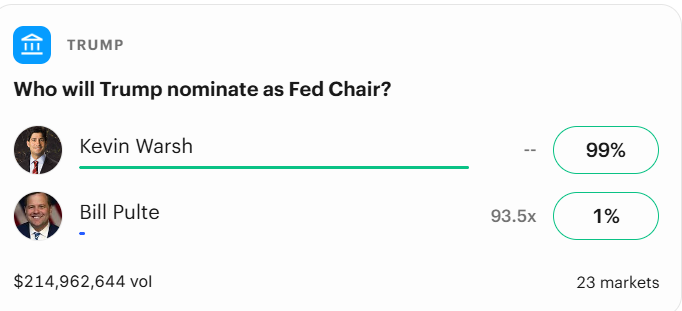
Prediction markets now price Kevin Warsh at ~99% to become the next Fed Chair.
Here’s what that could mean for markets 👇
• Warsh is historically more hawkish than Powell
• Market interpretation: “higher rates for longer”
Why this matters:
2021 → 2023
Fed Funds: 0% → ~5.25%
This crushed rate-sensitive names.
Example:
$UPST
~$400 (2021 peak) → ~$20–30 range
Reason: loan demand collapsed as borrowing costs surged.
$NLY
Mortgage REIT spread trade:
Long mortgage yields − short funding cost
If short rates stay high:
→ funding costs rise
→ spreads compress
→ dividends pressured
⚠️ Key takeaway
Markets move on expectation changes, not just rates.
If a Warsh Fed signals:
• rate cuts delayed
• tighter liquidity
Then pressure stays on:
$UPST (fintech lending)
$NLY (mortgage REIT carry trade)
But if markets think policy ≈ Powell:
impact may be already priced in.
The market is pricing only a 20% chance of a US–Iran ceasefire by March 31.
That means the base case is continued geopolitical tension.
If that holds, the sectors most sensitive historically are:
Oil → $XOM $CNQ $EC $NOG
Uranium → $CCJ
Gold → $NEM $FNV
Defense → $BWXT $HEI
Energy risk premium could stay elevated.
@Gubloinvestor Best to not recommend any advice to friends or even family. When it goes well, you may get a free dinner, when it doesn't, the friendship is broken.
Investing and trading is a lonely world in real life.
I didn’t find this trade from news.
I noticed who spoke, when they spoke, and how price reacted before headlines caught up.
Built a tool to track this exact behavior, tweets overlaid on price, ranked by market impact.
Calling it #TweetRipples.
$SNDK - Up by +4.55% when whole market is down.
This gold move doesn’t look like 1980 or 2011.
In both of those cycles:
Gold and silver rose together
The gold–silver ratio compressed
The move was driven by inflation fear + speculation + commodity breadth
Today is different.
Gold is rising while silver is lagging, keeping the ratio elevated. That tells you:
The bid in gold is defensive, not inflationary...