The US can't afford higher rates... Warsh knows that.
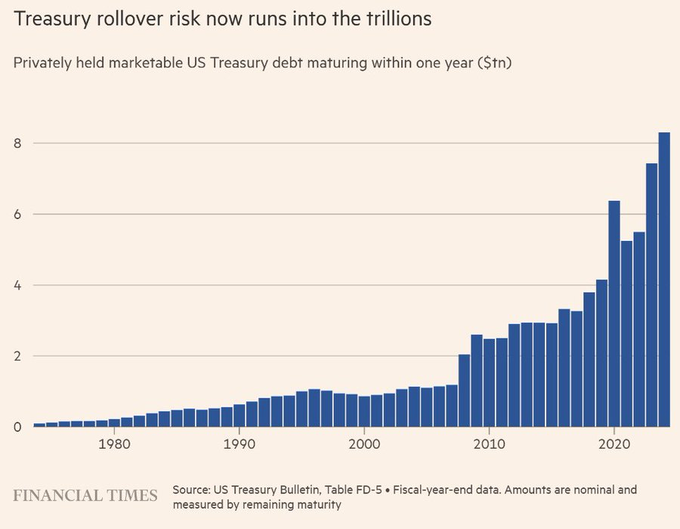
- In the next 12 months, ~$8T of USTs need to be rolled.
- The average coupon is ~3.3%.
- The US10y yield is ~5%.
Rolling that $8T at today’s US10y level would add $136B in annual interest costs, and that’s before you factor in the interest burden on an ongoing $2T annual deficit.
Volcker could crush inflation with double‑digit rates because inflation had already driven debt to GDP down from about 120% to ~30%.
Today we are back at 120%...
First you inflate the debt away, then you raise rates to kill inflation.
We are in the inflation part of the cycle... you know what that means
Turkish stock market indexes have been hit hard in the last week! Let's see if they stop bleeding soon. I am curious about the impact of FED funds rates and the BOJ decision coming up soon!
7-14-26 The Market Bubble Paradox Explained
Spotting a market bubble in real time is one of the hardest tasks in investing.
If bubbles were easy to identify, everyone would sell before prices reached extremes, preventing the bubble from forming in the first place. That's the paradox: bubbles only become obvious after they've already burst.
History is full of speculative booms—from railroads and Japan to the dot-com era—and today many investors believe AI stocks could be the next bubble. But relying on historical chart comparisons can be misleading.
Every market cycle is shaped by different economic conditions, monetary policy, technology, and corporate fundamentals. History may rhyme, but it rarely repeats exactly.
The bigger mistake is assuming expensive automatically means doomed. Markets can remain irrational far longer than investors expect. Alan Greenspan warned about "irrational exuberance" in the mid-1990s, yet the market continued climbing for nearly four more years before the dot-com crash.
Today's valuations are undeniably elevated, but so are earnings growth and profit margins. Stock prices aren't rising in a vacuum—corporate earnings, especially among AI leaders, have also accelerated. As long as earnings continue growing rapidly, elevated valuation multiples can persist much longer than traditional models would suggest.
The real risk isn't simply high valuations—it's a slowdown in earnings growth. Investors should spend less time trying to predict the exact top and more time watching whether corporate profits begin to weaken.
If earnings start rolling over, today's prices become much harder to justify, increasing the likelihood of multiple compression and a broader market correction.
So, don't try to time a bubble based solely on valuations. Focus on fundamentals, monitor earnings trends, and remember that calling the top years too early can be just as costly as missing the top altogether.
Check out our comprehensive "15 Trading Rules" guide ▶️https://t.co/T7MzH34WXd
This guide includes practical rules for managing positions, taking profits, controlling risk, and avoiding the emotional mistakes that often hurt returns during major market corrections.
If you like this video, please ❤️like and 🔁retweet
5-4-26 Summer Correction Risk Is Rising
$SPX $QQQ
Markets have rallied sharply on strong earnings, but the foundation is now weakening.
Breadth continues to deteriorate, with fewer stocks participating in the advance, creating a negative divergence that often precedes pullbacks.
Momentum is stretched, with relative strength near overbought levels, while the advance-decline line is starting to slip. At the same time, volatility $VIX remains extremely low, signaling complacency and increasing vulnerability to downside moves.
On the macro side, #crudeoil above $100 due to geopolitical tensions adds pressure on growth and consumers, especially if sustained into the summer.
Markets are currently pricing in a quick resolution, but if that proves wrong, risk rises further.
This is not a crash call, but the setup for a normal 5–10% correction is clearly building.
If you like this video, please ❤️like and 🔁retweet
Gold Silver Ratio Alert
Ratio broke through the symmetrical Triangle pattern 2 weeks ago (downside). Testing but not getting back into the Triangle.
At this point, the ratio is right at the Apex or possible inflection point. The daily chart with downtrend line is from the peak of the ratio last year.
Green triangle is the recent break of the larger triangle.
Looking for signs where silver could re-assert against gold.
Silver vs Silver Volatility Alert
Has silver topped or is silver consolidating?
Appears hedge funds and trading desks may have found a new way to trade silver without trading silver.
Silver volatility reached all time high levels in January. Many are now shorting this volatility index to capture trading revenue or profits. The reduction in volatility is also calming the silver price. The whippy swings in price have cooled off. A trading range is developing.
Players appear more confident in the short term that volatility will pullback vs silver rising in price. Remember this is short term trading, not long term price manipulation. As long as the Middle East headlines captivate investor attention and rise in the stock market to new highs pull in new capital flows, the precious metals are taking a back seat at the moment. Thus another reason why large trading firms are selling silver volatility and not actively trading silver itself.
This is evident by the continued crash in Silver futures open interest which now stands at 99,168 contract. A level not seen since 2011.
See chart below. Red is SLV Volatility and Blue is the silver price. Volatility continues to stay in a declining wedge. This is an orderly decline at the moment. This formation is dangerous for many playing the short side. If the wedge breaks to the upside, the move could be very powerful and could be a reason that aids the silver price.
What this means for silver? appears to be a consolidation and trading range while volatility resets. This is constructive and something that could set the stage for a move higher if volatility finishes compressing.
If you like the analysis, please repost so help others can understand the current market structure and why the silver market is acting the way it is.
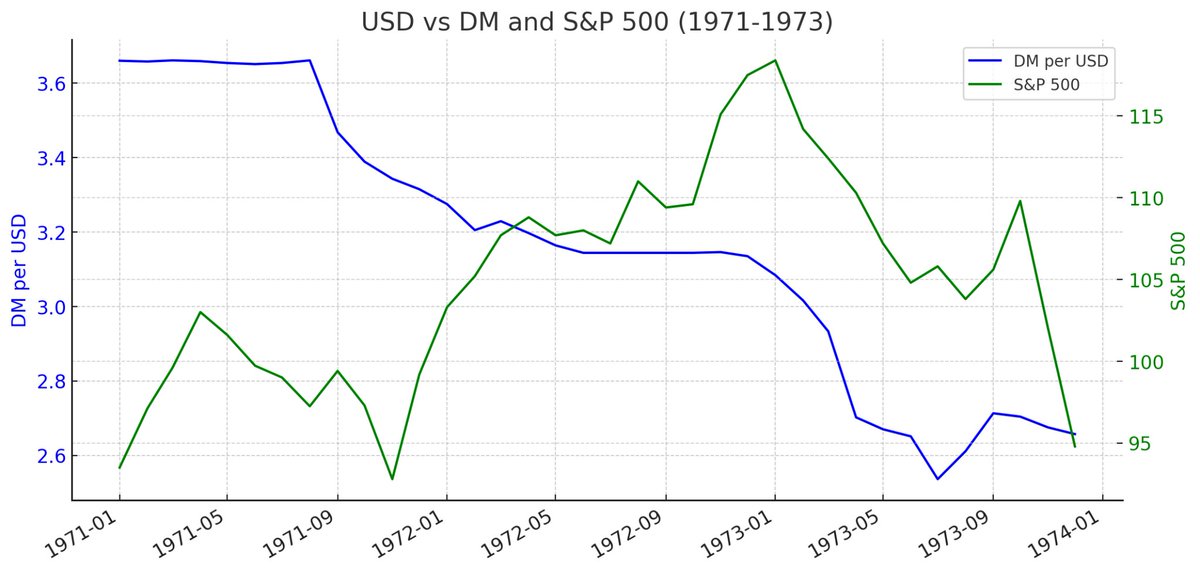
1973 IS COMING - BUT NOT FOR OIL
There is falling global dollar AND treasury demand, but not for US equities.
25% of USTs are owned by foreigners (down from 33% a decade ago)
25% of US Equities are owned by foreigners (up from 18%)
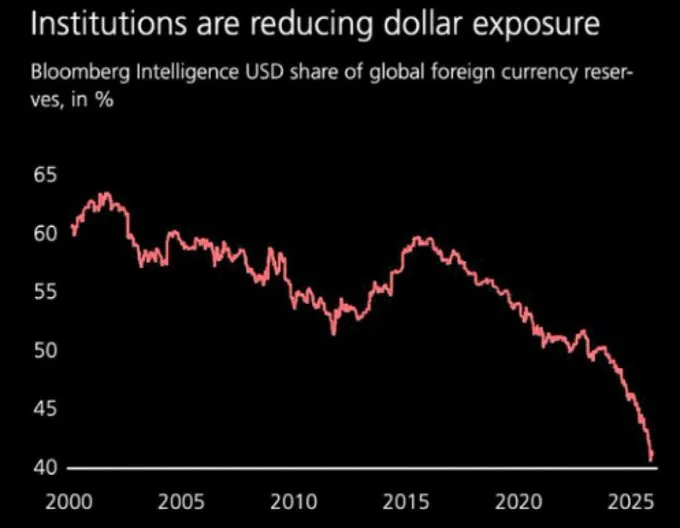
USD share of global foreign reserves as fallen 33%. As a result: Gold is #1 reserve asset on global central banks - not USD anymore.
USD wasn’t in a hurry to fall without Fed/Treasury intervention Oct 2022 - but then Trump entered the scene JAN 2025 to make USD devalutation a feature not a bug.
Now, with Fed pressured to lower rates & monetize deficits, the USD is falling faster as foreigners stay away from USTs & bypass USD, UST & Petrol-dollar (Oil) for trade settlement in Gold.
THIS macro roadmap was laid out early last year as basis of potential crack-up boom reaction in stocks.
The problem is when the USD weakens too much as Fed cuts, forcing the Fed to later re-tighten... just like what happened in 1973 ... THEN the equity rally falters & fades WITH the USD falling, setting up an even more aggressive selling of both foreign-held equities & treasuries & dollars.
In the same way 1973 caused USD to fall hard with equities, US is setting up for a strong case of foreigners selling EVERYTHING once inflation picks up state-side and Fed intonates hiking.
Bad news will be very bad news - ala 1973 - 1974 - and it won't have to do with oil.
Remember my mantra last year:
METALS ARE THE NEW OIL™️
Geoffrey: @GraphCall
"Now the Fed is going to cut rates and resume balance sheet expansion. DO THEY BELIEVE THEY OPERATE IN VACCUM?
So now you know why I am long the euro"
It's all about BALANCE OF TRADE & CAPITAL FLOWS.
"once the DXY is at 0.8 you should get better terms of trade IF the Treasury manages to shrink primary deficit as a % of GDP. A much lower FX with not TOO MUCH inflation is the cure."
PLACE YOUR BETS
$EURUSD $WTIC $SPX
https://t.co/NcKcmjafDU
Uranium falls VERY much into my theme of:
US AS GOVERNMENT VENTURE CAPITALIST™️
And a recd TREND LONG since Nov 2020…
Video
https://t.co/UulKjZxCGt
Post
https://t.co/LLTmyF48eg
$CCJ $URA $URNM
$FLR $SMR $OKLO
$JBL $GEV $BWXT $PWR
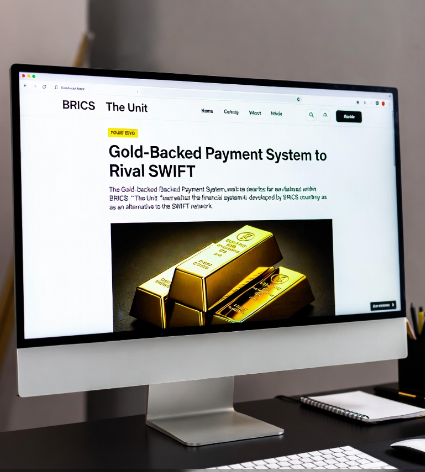
🚨🚨BRICS GROUP LAUNCHES GOLD-BACKED UNIT PAYMENT SYSTEM 🚨🚨
Russia & China Are Attempting to Issue a TERMINAL BLOW to the USD as Global Reserve Currency Using #GOLD:
⚡️The BRICS have launched a pilot project for a new settlement instrument called "The Unit," which is backed by a blend of ⚡️40% PHYSICAL GOLD ⚡️ & 60% BRICS national currencies.
Pegged to GOLD: Each Unit is currently pegged to a value equivalent to 1 gram of gold, however its daily value fluctuates based on the exchange rate of its constituent currencies against gold.
Structure: "The Unit" is a mixed-backed exchange unit administered by the International Reserve and Investment Asset System (IRIAS).
Digital Reserve Currency: The system is designed as a digital platform utilizing transparent blockchain technology.
The Unit was just launched as only a pilot program initially, with only 100 units issued.
While the full global rollout is yet to be announced, the US Dollar has been officially put on notice.
Russia and China are officially coming after the USD's role as global reserve currency, and their weapon of choice to SLAUGHTER the globalists is none other than GOLD.
Translation: The US Dollar is COOKED!!
Apollo Global Management, Inc. just dropped their 2026 outlook. h/t @Samsilverman_
“The 14 macro trends every investor needs on their radar:
1. The 45-Million-Person Headwind Student loan payments restarted. Nearly 20% of the population just saw their disposable income shift. The "spend-at-all-costs" era is cooling.
2. A Widening K-Shaped Economy We're not in one economy - we're in two. Asset owners thriving on record highs. Lower-income brackets hitting savings exhaustion.
3. Student Loan Delinquency Spike It's not just about payments. It's about default risk rippling into auto loans and secondary credit markets.
4. The "One Big Beautiful Bill" Starting Jan 1, 2026: 100% immediate deduction on capital expenses. Projected to boost GDP by 0.9% alone.
5. AI Adoption Plateaus Hype cycle over. Adoption rates flattening as companies shift from talking about AI to the grind of actually integrating it.
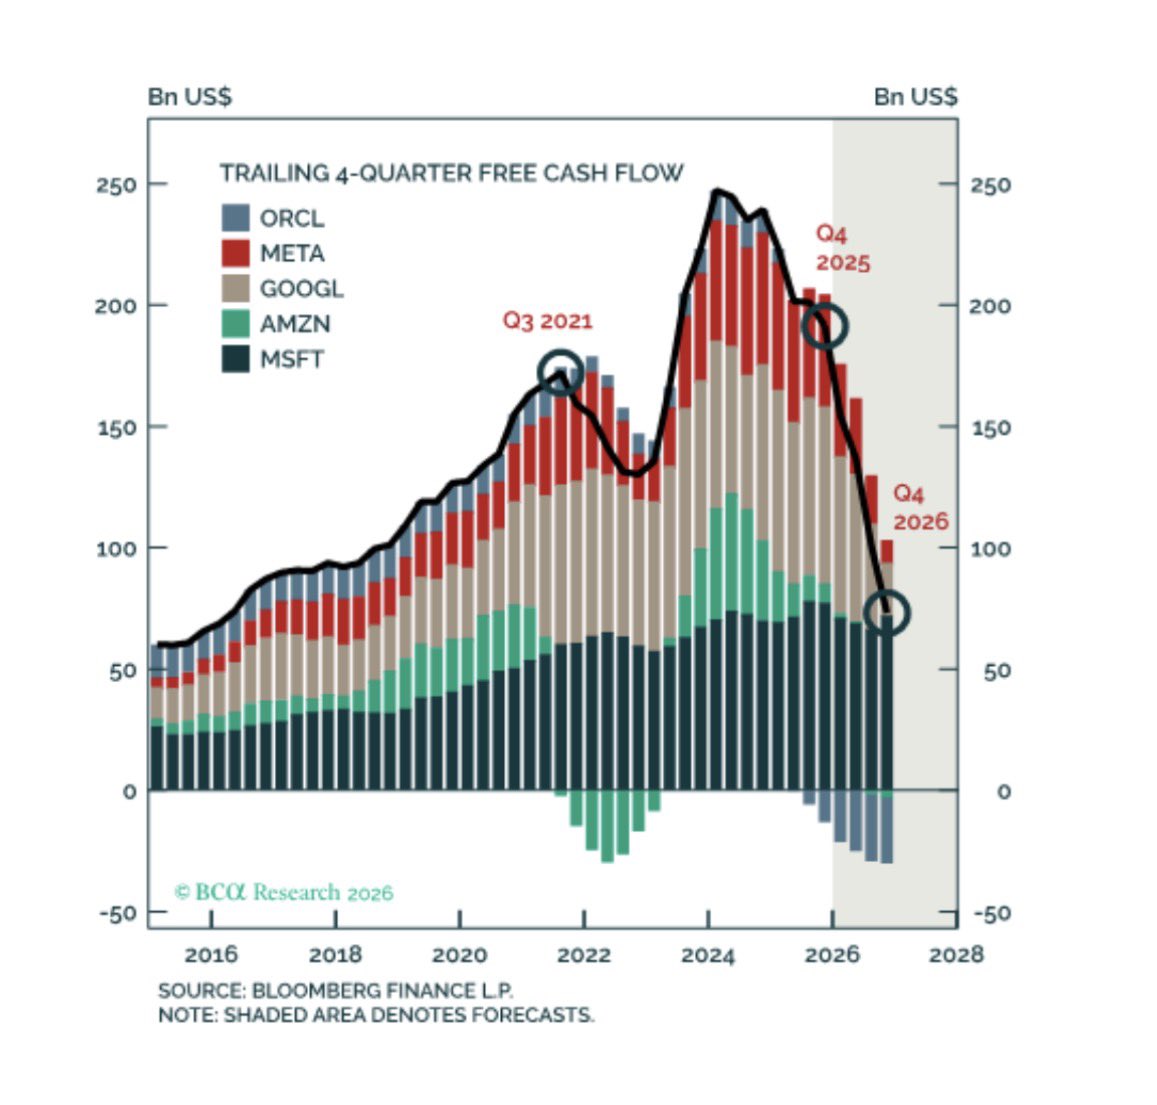
6. The 60% Capex Concentration Mag 7 now spending 60% of operating cash flow on AI infrastructure. The entire market is betting on AI ROI.
7. Zero Growth in Non-AI Capex Outside the AI arms race? Flat. Traditional industries are getting capital-starved as every spare dollar chases GPUs.
8. The S&P 7 vs. The S&P 493 Margins expanding for tech giants. Declining for everyone else. If you're not an AI provider, you're facing a squeeze.
9. Data Center Construction Slowdown Physical limits reached. Power grid constraints and land scarcity are slowing builds. Power generation is the new bottleneck.
10. The 2026 Maturity Wall Massive wave of corporate debt coming due. A refinancing supercycle is moving billions from banks into private credit.
11. The Death of 10-Year Duration "Higher for longer" is here to stay. Investors fleeing long-duration bonds for floating-rate private credit and short-duration paper.
12. Institutionalization of Sports No longer "alternative." Sports is now a $2.5T institutional opportunity with recession-proof cash flows.
13. Foreign Demand for US Yield Despite trade tensions, foreign capital is flooding US private markets. The US remains the safe haven for AI-linked tech and quality yield.
14. Brief Stagflation Risk The Fed is watching a 1970s-style scenario: tariffs keeping inflation sticky at 3% while growth slows. Active management > passive indexing.”
Which trend are you watching closest heading into 2026?