⚡ One big liquidation can trigger ten more behind it, and that's how fast crashes actually happen
I used to think liquidation cascades were random. They're not, they're mechanical
When a leveraged position gets liquidated, the exchange has to close it immediately, no matter the price. That forced selling pushes price down further, which then triggers the next leveraged position sitting just below it. One liquidation becomes two, two becomes ten, and suddenly the chart looks like it fell off a cliff.
1️⃣ Why this isn't the same as normal selling
Normal sellers choose when to sell. Liquidated traders don't get a choice, the exchange closes them automatically. That forced, non-negotiable selling is what makes these moves so much faster and sharper than a regular pullback.
2️⃣ Why leverage makes this worse
The more leverage traders are using, the closer their liquidation price sits to the current price. During high leverage periods, even a small move can wipe out a huge number of positions at once, which is exactly when cascades happen.
3️⃣ How to actually see this coming
Check open interest before a big move. If OI is high and climbing while price is also climbing fast, that means a lot of leveraged positions just got stacked close together. That's fuel sitting there waiting for a spark.
4️⃣ Why the bounce after a cascade can be just as violent
Once the forced selling is done, there's nobody left who has to sell. Real buyers step back in against way less resistance, which is why you often see sharp reversals right after a liquidation spike, not slow recoveries.
5️⃣ How I actually use this
Before entering any fast move, I check funding rate and open interest together. Overheated funding plus rising OI tells me leverage is stacked and a cascade is more likely. I size smaller or wait for the flush instead of getting caught in it.
Save this one. Next time a coin crashes out of nowhere with no news behind it, check the liquidation data first, that's usually the real answer.
I just made $1.1M in one trade.
So I recorded a complete tutorial on the 4-step liquidity strategy I used to make this.
For 24 hours, it's yours for FREE.
Like + comment "TUTORIAL" and I'll DM it to you.
(must be following + RT for priority)
🚨 FREE STRAT INDICATOR GIVEAWAY🚨
I normally keep my custom setups locked down exclusively for my private community...
But Rob Smith gave us the ultimate gift with the Strat (1, 2, 3 candles), so to pass that blessing forward to the trading community, I'm giving you my custom TradingView indicator for FREE:
The Strat: 1-3-1-3-1 Setup 📈
This is exactly how we caught the +200% profit moves on $TSLA and $IBM in ONE day.
I am DMing the direct TradingView script link + the 1-page setup dashboard to everyone who:
Like this post ❤️
Repost it (RT) 🔄
Comment "INFO" below 👇
(Must be following so my DM can hit your inbox!) ⚡
#TheStrat #OptionsTrading #Options $SPY $AAPL $NVDA
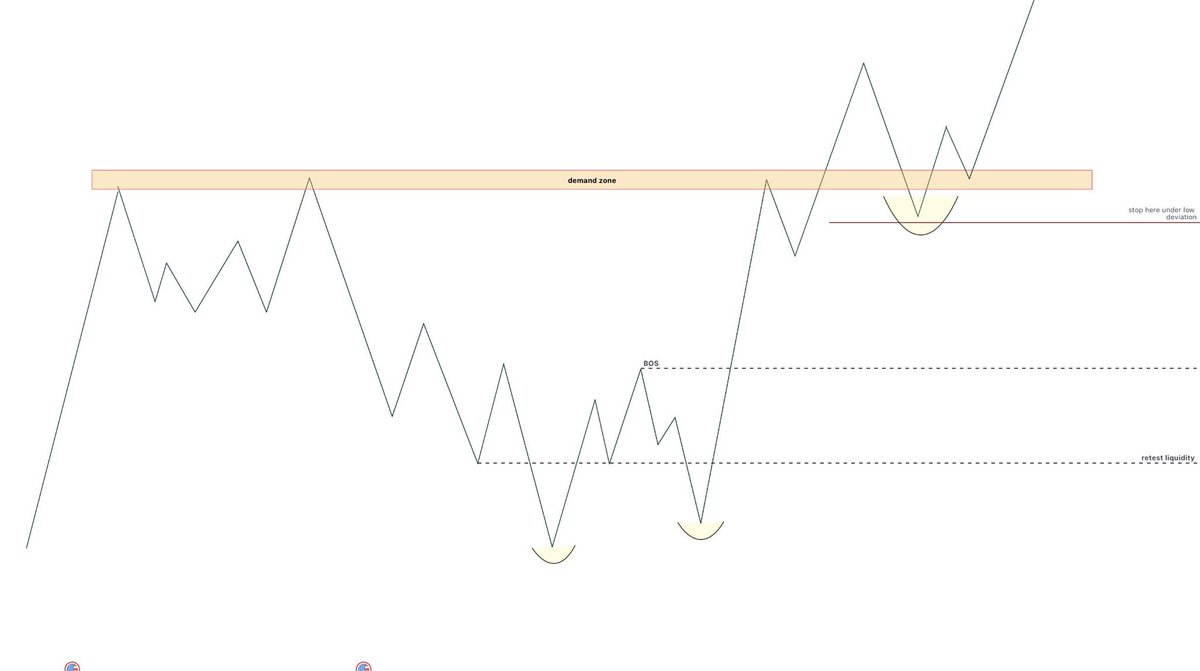
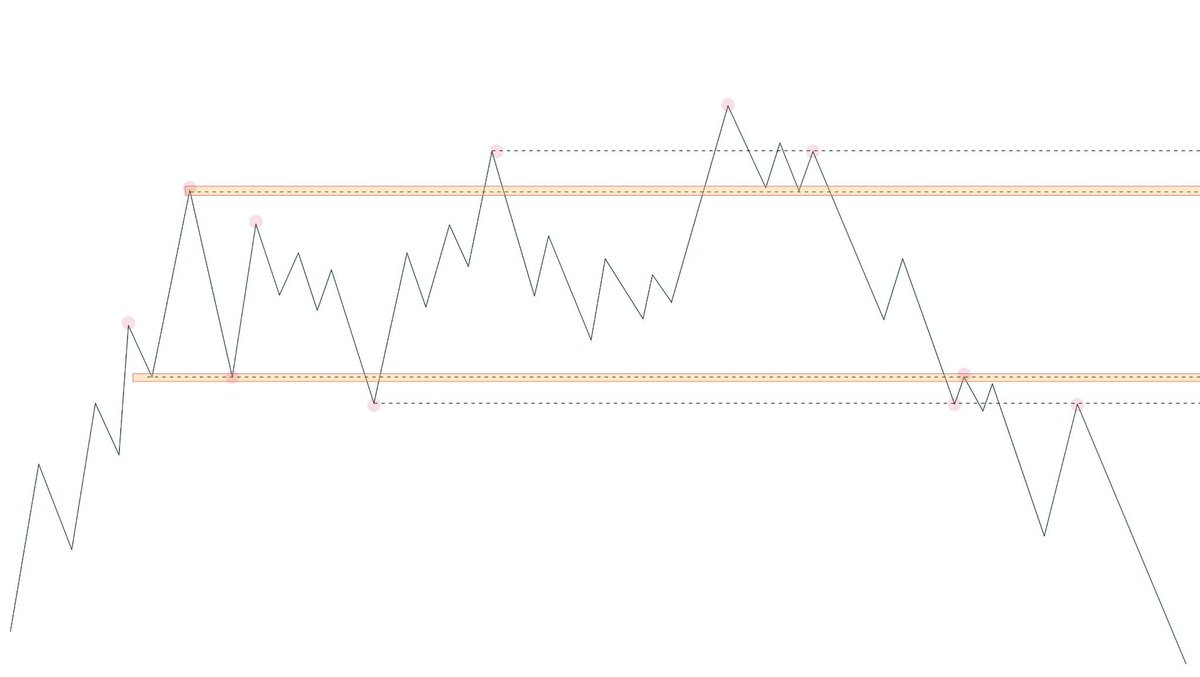
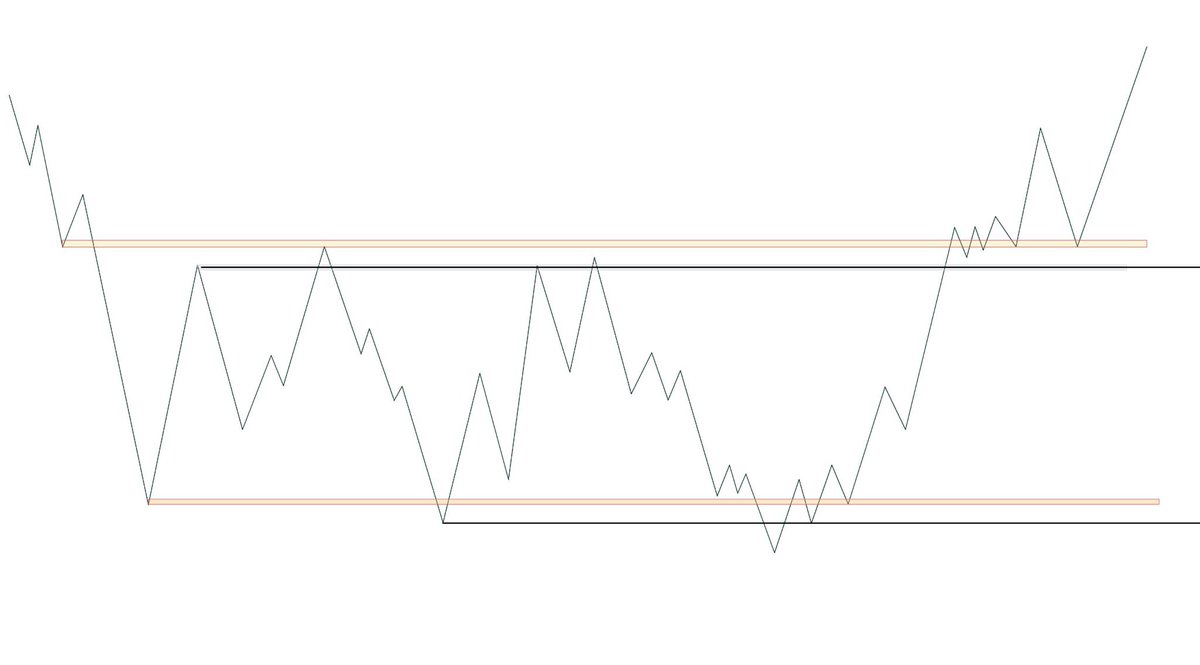
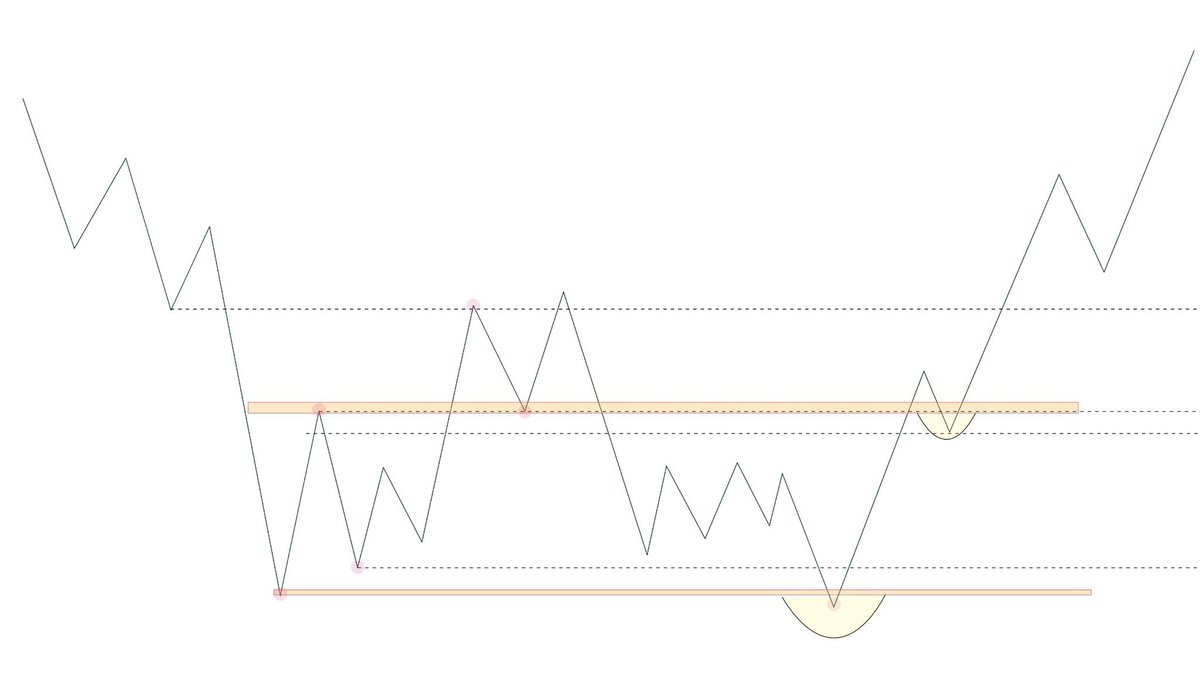
Support and resistance levels are among the simplest yet most misunderstood concepts in technical analysis. The longer a price zone holds over time, the greater its practical significance tends to be. The difference between an inexperienced trader and an experienced one lies in their approach: the former seeks the perfect level, whilst the latter observes how the market reacts within a zone of interest.
Liquidity sweeps, deviations, reclaims and structural confirmations are often the elements that allow us to distinguish a simple reaction from a high-probability opportunity.
Ultimately, support and resistance levels are not used to predict the future, but to identify areas where it is worth paying closer attention and waiting for the market to reveal its intentions.
Study these slides and they will be useful to you
A retweet would be helpful