if you use the @ether_fi card, hold ethereum:0xfe0c30065b384f05761f15d0cc899d4f9f9cc0eb or thinking to buy it
finally @valueverse_ai added ethereum:0xfe0c30065b384f05761f15d0cc899d4f9f9cc0eb, so i (we) have like the best and the most accurate data on what actually goes to holders. as a big ether fi fan and daily card user i gave it to my claude and started digging
also, @DefiLlama shows $0 to ethereum:0xfe0c30065b384f05761f15d0cc899d4f9f9cc0eb holders since april, looks like it only tracks one old wallet. valueverse is the only tracker i found showing $sethfi stakers still got ~$400k last 3 months
tbh, sadly for me the token is pricey on holder cashflow, ~95x on staked ethfi last month, one of the priciest in the whole screener. yearly whole supply is ~69x, below hyperliquid:native 111x, ethereum:0x1f9840a85d5af5bf1d1762f925bdaddc4201f984 88x, ethereum:0x232ce3bd40fcd6f80f3d55a522d03f25df784ee2 76x (those two annualized, under a year of data)
what bugs me is the staker payouts are ~3x lower than spring, revenue roughly flat. back at spring pace staked ethfi would be like ~17x
i think it's bc of the september dao vote weekly ethfi buys go to card cashback and treasury, $sethfi isnt in the proposal. so token is bought weekly, it just goes to card users not stakers, and screeners dont count that
@MikeSilagadze is card cashback the main value accrual now, or any plan to route part of the weekly buys back to sethfi? would be great to see that multiple come down
Great to see that smart minds are so close to adopt P/FCFt
@thedefiedge we value holder revenue vs. Revenue-eligible market caps, not just liquid m.cap - it is much more detailed metric.
Your current multipliers show a bit different thing
BTC went up 5.6% in two months.
Raydium went up 178%. Uniswap 80%. Aero 77%.
I dug into what the winners had in common. It wasn't that they were cheap. https://t.co/ZKXdzBSfkI
@hooeem Probably you could use P/FCFt - one number that shows your cost for every $1 token pays you
Then you could compare it with treasuries and your growth expectations
We've excited to announce that @ether_fi ($ETHFI) is now covered on Valueverse (Extended Section).
Fundamental metrics:
- Holder Revenue 7D-365D
- Valuation multiples (P/FCFt)
- Supply, buybacks, staking and many more
Access (free)👇
Checking out our new (simple) UI tool with $NEST.
Revenue in 7D-365D periods + annualized at the same chart.
Easier than multiples, yet insightful:
- recent 30D were pretty solid (max annualized)
- longer period 180D steadily grows -> more and more revenue traction gained
You can dig into any token with that
Talked to @valueverse_ai folks yesterday. It was interesting.
Apparently, CRV and AERO are probably the easiest to evaluate in "TradFi" ways: prices peg to fundamentals and ignore negative or positive mentions in the media.
- CRV is the easiest: just based on your normal cash flow, just made ve-aware, but nothing complicated.
- AERO is trickier. It has semi-liquid NFTs which makes delta-neutral positions feasible, so shorts suppress the price. Also lots of inflation just has to be sold to compensate IL, which suppresses price below the "naive" estimate further. But possible to analyze.
- UNI and HYPE appear to be valued very far from their fundamentals, traders appear to buy the narrative there more than calculations.
Meaning that they are priced quite high vs. their real fundamentals.
In other words: a significant portion of the valuation is driven by narrative premium.
What narrative premium is: future growth expectations, assumed market dominance, or simply popularity.
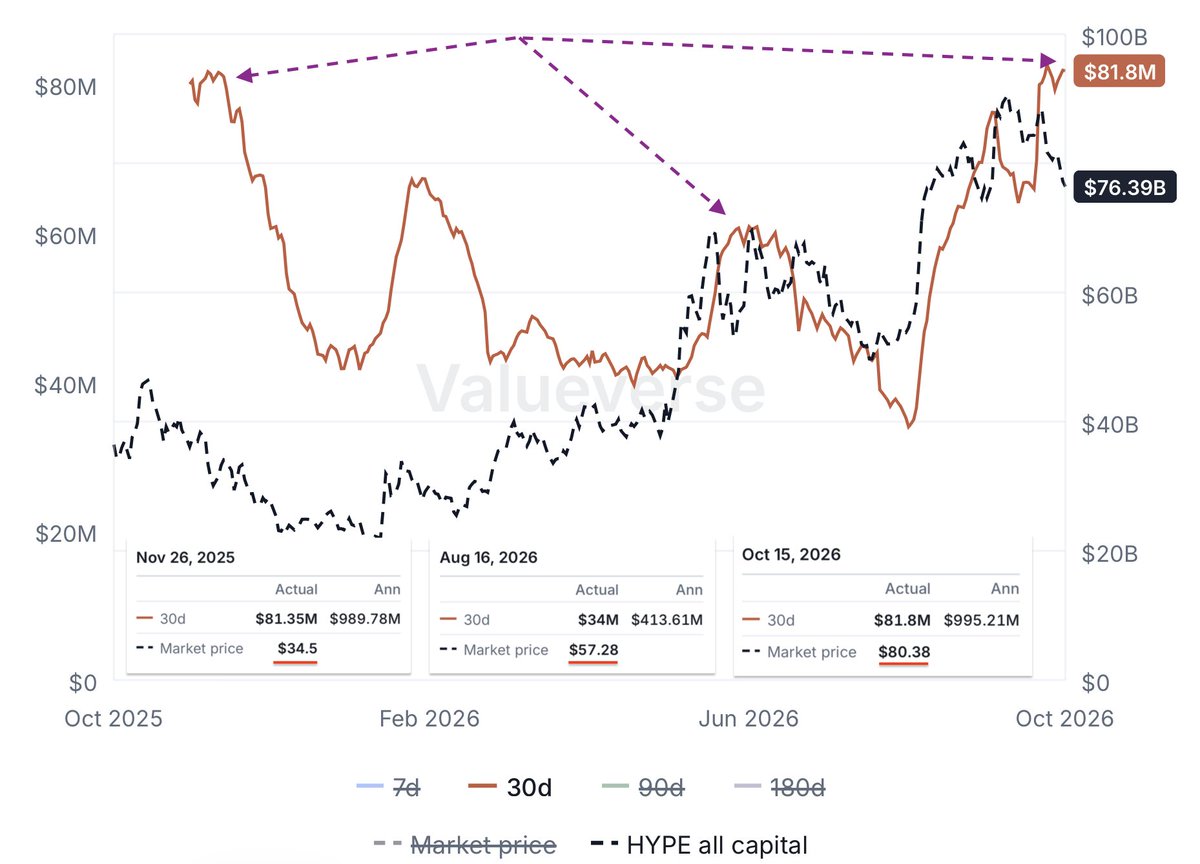
A case study: $HYPE holder revenue vs. price chart
Comparing results for buyback vs. ve-tokenomics.
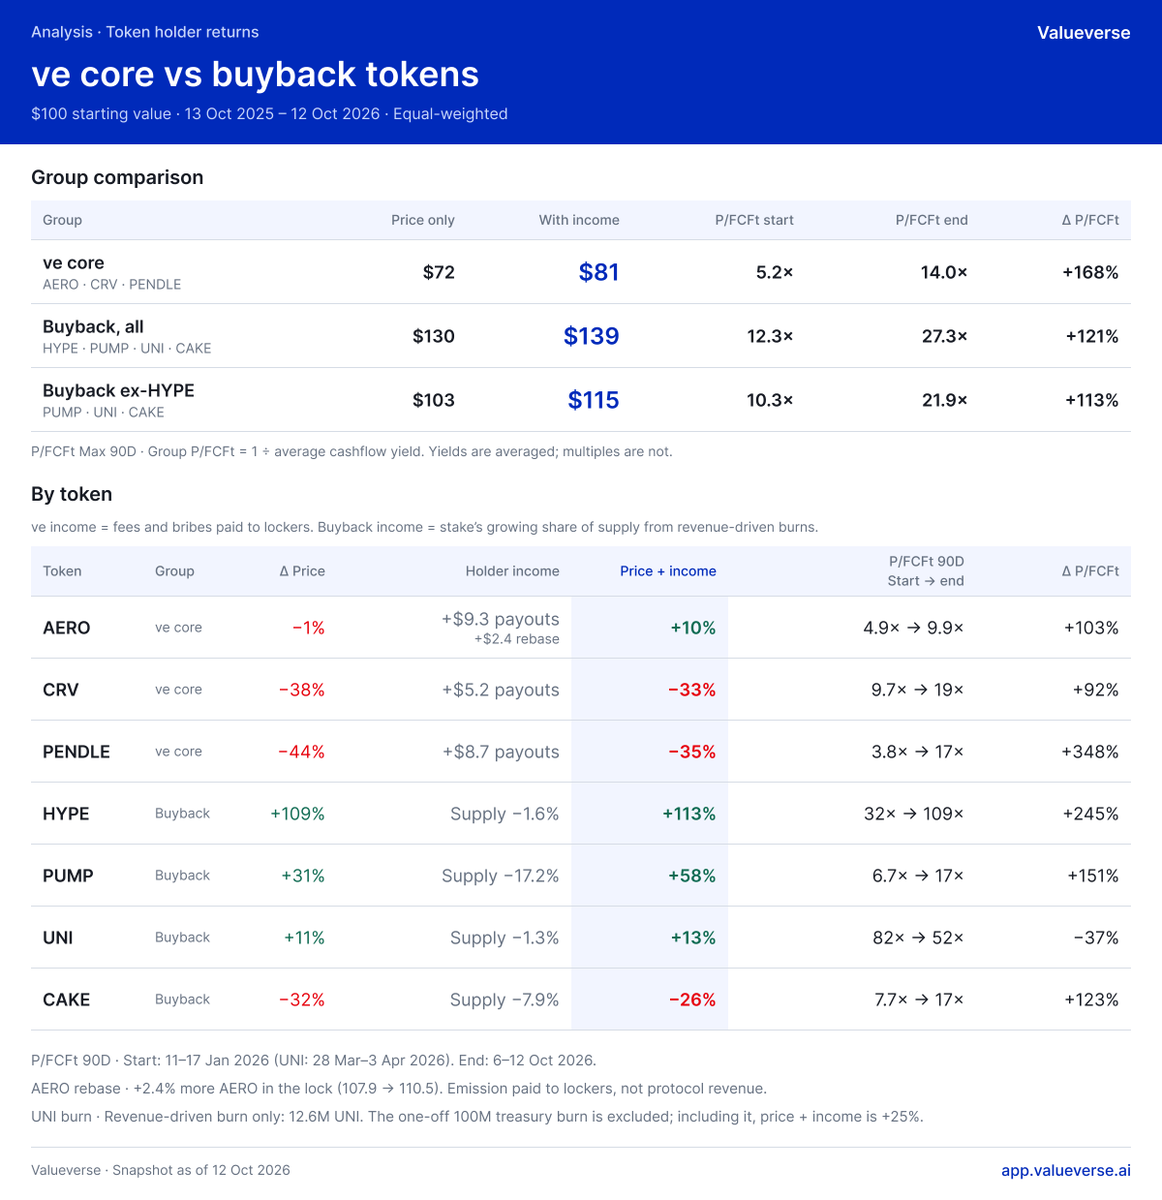
A small case study comparing two baskets consisting 4 biggest buyback tokens and 3 biggest ve-tokens.
Takeaways:
1. The peformance gap "buyback vs. ve" is much smaller that it was stated in the original post: $67 vs $300 -> $81 vs. $139
2. The highest valuation multiples are concentrated in major assets like $HYPE and $UNI. This suggests that market attention and valuation premiums remain heavily concentrated in the largest projects.
Ongoing observations:
1. Buybacks outperformed on price returns.
$100 invested in each of the four buyback tokens one year ago would be worth $130 on average today (equal-weighted across the group).
2. ve-tokenomics underperformed. The same $100 investment across each of the three ve-tokens would be worth just $72 on average.
3. But price performance doesn't tell the whole story. Both groups generate economic value for token holders beyond price appreciation.
4. To account for this:
- Buybacks: we account the reduction in total supply as a kind of an income, since each remaining token represents a larger share of the supply.
- ve-tokenomics: we account for revenue claimable by token holders.
5. $HYPE was the strongest price performer. Excluding $HYPE, the buyback group's average ending value drops from $130 to $115.
6. Accounting for accumulated revenue in the position:
Buybacks: $130 → $139
ve-tokenomics: $72 → $81
7. $HYPE and $UNI have relatively small supply reductions: just 1.6% and 1.3%, respectively. We calculate these figures against maximum supply (the FDV basis), since buybacks increase the proportional ownership of all remaining tokens.
8. $PUMP and $CAKE burned significantly larger portions of their supply, making their buyback-driven value accrual more substantial.
9. $PUMP and $CAKE trade at roughly the same P/FCFt multiples as $CRV and $PENDLE, around 17x, despite their fundamentally different value accrual mechanisms.
10. $AERO stands out with a P/FCFt below 10x, making it one of the cheapest assets in this comparison on a token-holder revenue basis.
All the results are presented at the infographic
Source: Valueverse API
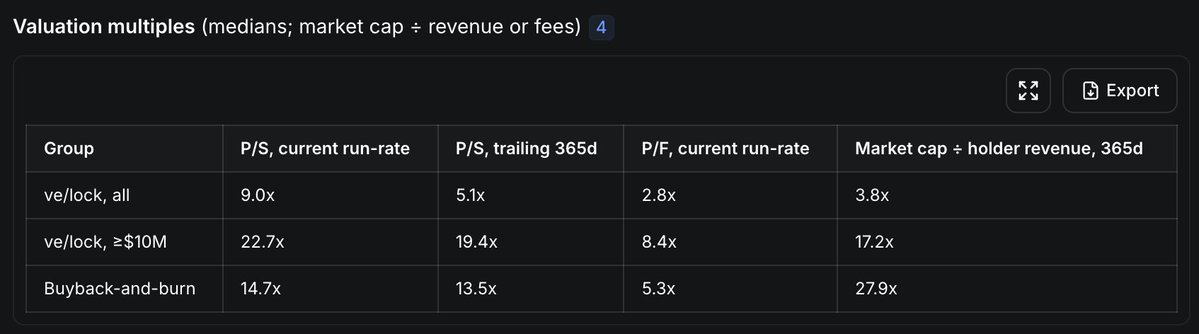
I've been selling my positions that require locking.
Actually, I think some of these mechanisms are incredibly sophisticated. But the performance numbers are pretty depressing.
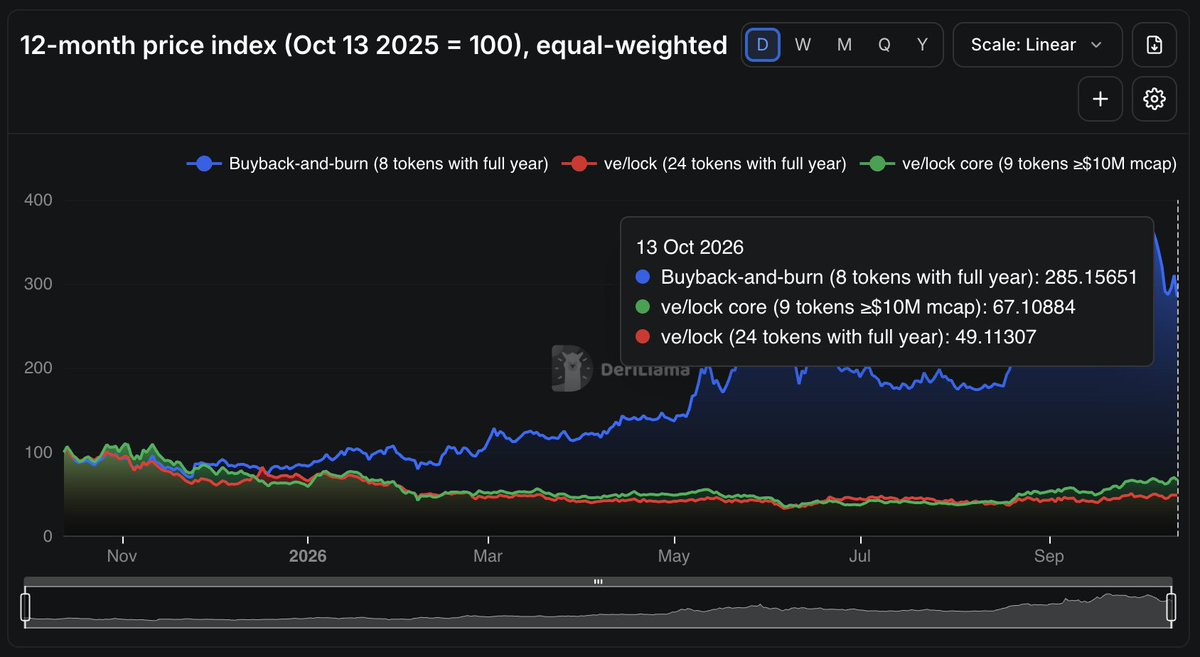
I was looking at @DefiLlama AI's data, normalizing a $100 investment across different token models over the last 12 months.
Here's what that $100 would be worth:
> Top 9 ve/locked tokens (>$10M): ~$67
> All 24 tracked ve/locked tokens: less than $50
> Buyback & burn tokens: almost $300
Of course, tokenomics aren't the only reason for this performance, but I think we're underestimating how much liquidity matters.
Great technology doesn't automatically mean a great investment.
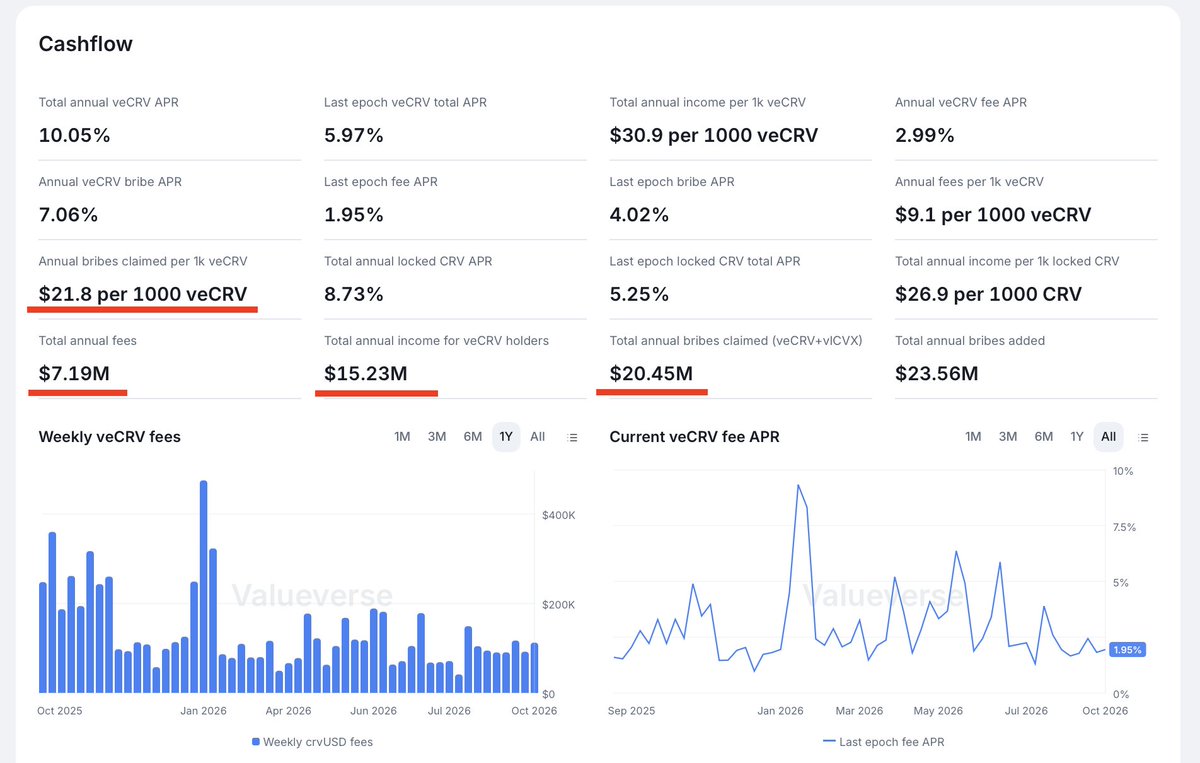
We don't know why Defillama AI says that @CurveFinance annual revenue is less than $5m.
- It's simply not true.
- We estimate it $15.2m - $27.64m is our data.
- Maybe it was an AI Slop?
Our manually verified data for that:
- $7.19m fees for veCRV holders
- $20.45m bribes that protocol brought for all kind of veCRV holders (incl. @ConvexFinance owning a huge veCRV stake)
- $15.23m veCRV holders yearly income, EXCLUDING vlCVX bribes (so direct veCRV bribes only!)
With all due respect, DeFiLlama appears to lack bribe coverage and proper attribution of fees and bribe revenue to token holders.
You can dig into all numbers yourself👇
After yesterday's post about Curve, I got a few replies worth addressing.
First, I really don't want to be bearish on @CurveFinance. I love the protocol.
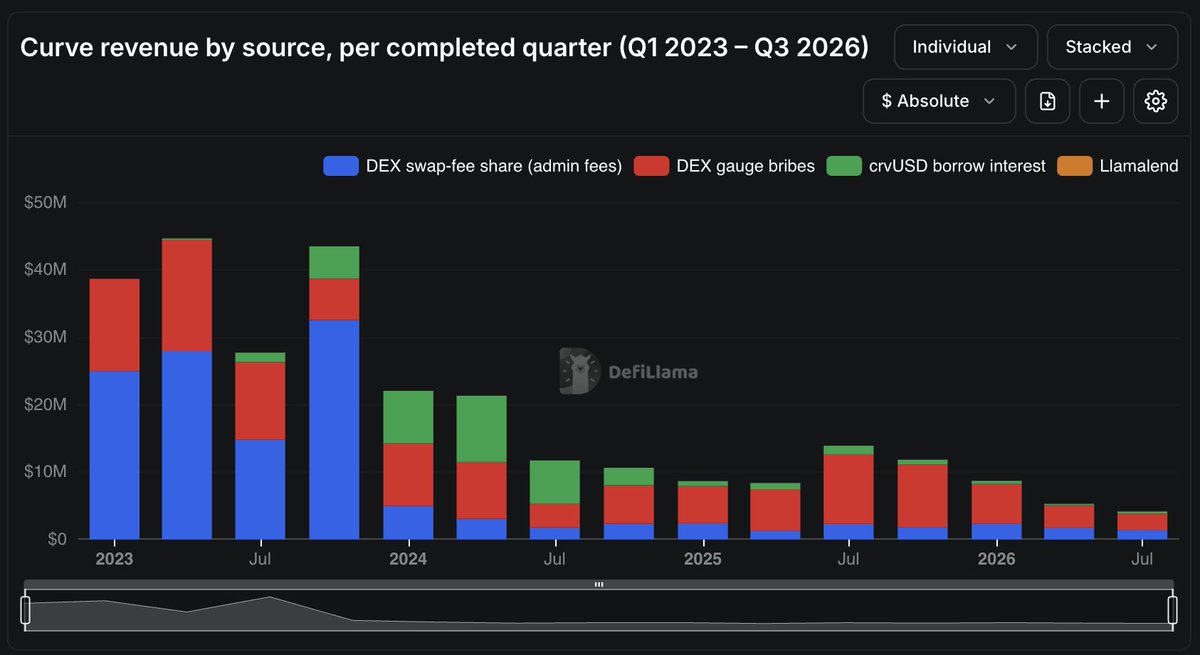
I'm using @DefiLlama AI for this analysis, so some figures might not be perfectly accurate.
A lot of people pointed out that Curve no longer depends entirely on its DEX business. That's true, but look at the numbers:
> 2023: ~$40M revenue, with 64% coming from DEX activity.
> Today: less than $5M revenue, with DEX still representing 34%.
Bribes have become a much bigger part of the business, which is actually encouraging given where CRV trades today.
But crvUSD minting and lending activity remain relatively small. I'm really hoping @yieldbasis helps revive this side of the ecosystem.
As more traditional assets move onchain, financial systems will need better ways to understand and compare the economics of assets across increasingly connected markets.
@vasily_sumanov will join @Genzio later today to discuss the shift to always-on markets and what it means for financial infrastructure.
Tune in at 12 PM ET.