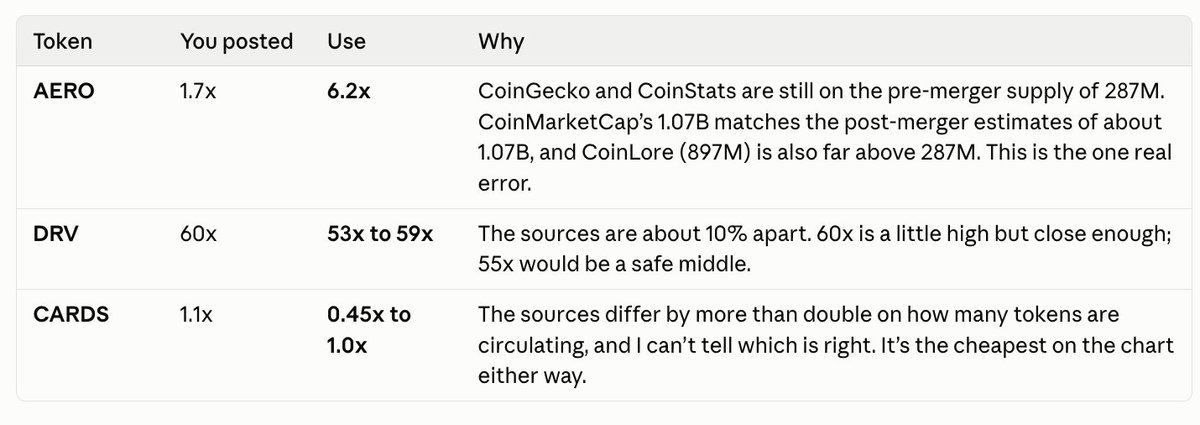
Found a nice tool from @valueverse_ai you gotta check
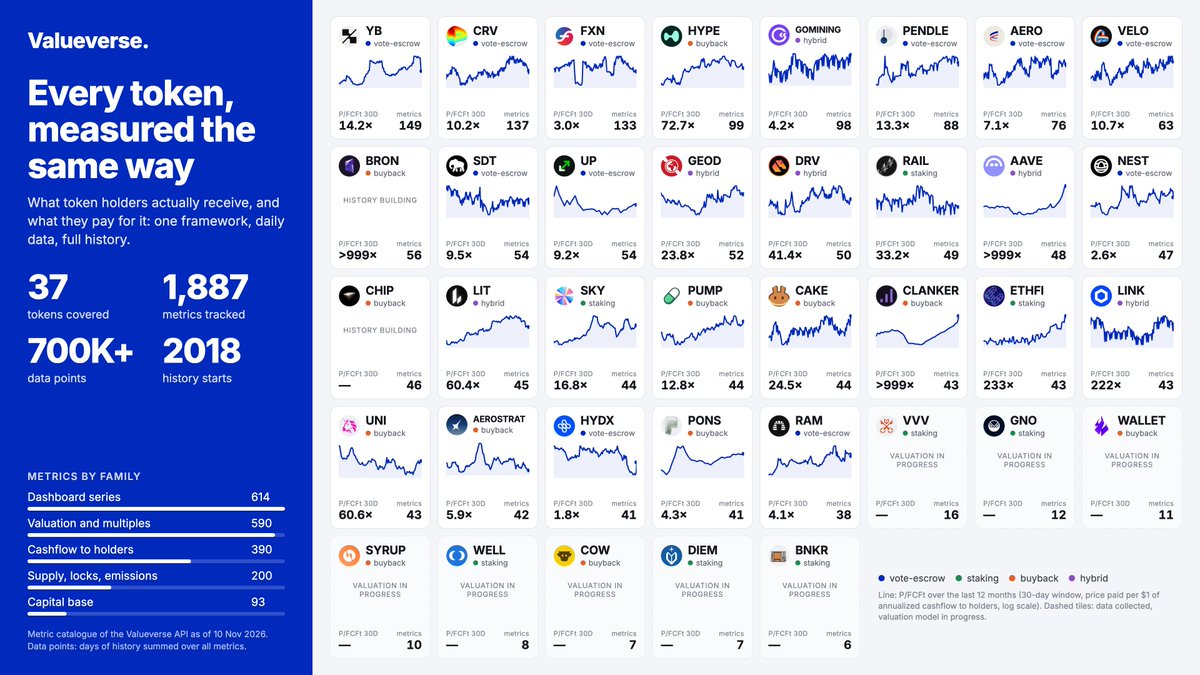
It ranks tokens by 30d P/FCFt - basically how much you're paying for every $1 of cashflow that actually reaches holders (buybacks, fee share, etc).
Lower = cheaper relative to holder value accrual. Top 10 cheapest right now:
aerodrome-finance:native - 4.6x
$GOMINING - 5.2x
$CRV - 7.8x
$PUMP - 8.8x
$PENDLE - 10.8x
$SKY - 14.9x
$GEOD - 19.8x
$UNI - 41.8x
$LIT - 43.8x
$HYPE - 58.3x
Looking at this table, the recent dump has pulled many projects with real revenue into a much more comfortable discount zone.
In derivatives group, because token prices corrected more than the decline in revenue, many large protocols have become significantly cheaper compared to 3 months ago.
→ Clear examples are $HYPE and $LIT.
In contrast to the broader valuation compression, a few names recorded a sharp rise in P/FCFt over the past 90D because their token prices held up better than the short-term pace of fee generation.
→ The standouts are $ETHFI and $CAKE.
NFA, DYOR.
Lot of familiar names in blue 👀
$DRV $AERO $HYPE $LIT all considerably improved their ratios in the last 3 months.
This is a great visual to show what actually monetizes volatility well and has durable revenue, even as the market is crashing.
@vadim_web3@PaulKlayVC token holder revenue here is explored
Why do we need to know the cost? We already know the result. If the cost is in tokens we can account for dilution
Protocols ranked by % of m.cap that they pay out to the token holders
We name it Aggregate Return. On the chart:
- Year-to-date, de-facto distributed value
- Recent 7D, annualized
This list contains only protocols covered in Valueverse's Core Section: >$5m revenue per year + m.cap requirements
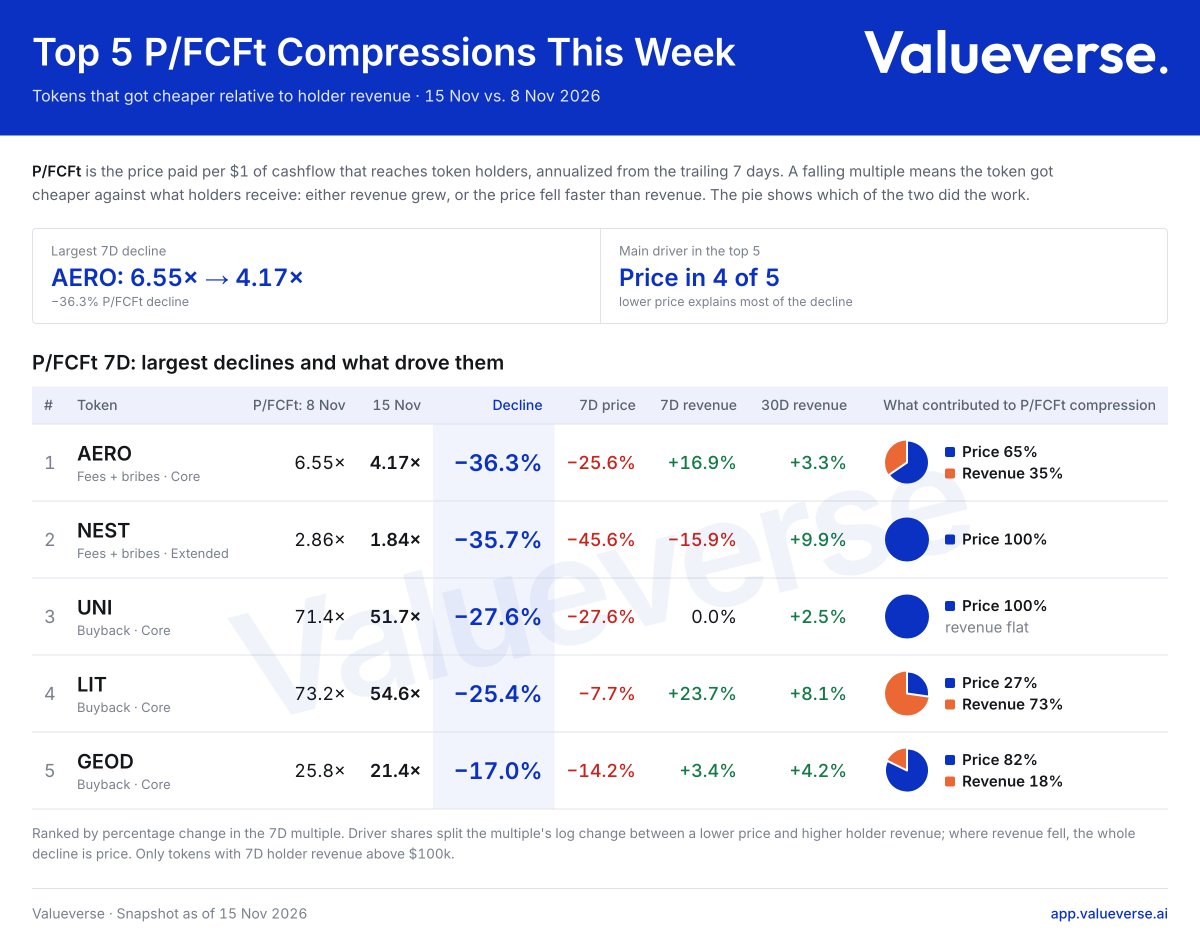
Price Falls, But Fundamentals Keep Strong
P/FCFt decrease:
🥇 $AERO: −36.3%
🥈 $NEST: −35.7%
🥉 $UNI: −30.3%
Also, $LIT & solana:7JA5eZdCzztSfQbJvS8aVVxMFfd81Rs9VvwnocV1mKHu
Here we cover P/FCFt, Holders Revenue, and price vs. revenue contribution to fundamental valuation.
Track fundamentals, not just prices.
The latest trade using the $UNI Fundamentals Strategy is closed (+30%)
Mechanics:
- Revenue was declining
- Price held up -> so short it & wait 30 days
- In 30 days, price followed the revenue decline (-31% vs -33%, almost a perfect match!)
Fundamentals are not just for dashboards.
Data: Valueverse API
When I started building @valueverse_ai, my goal was to create an engine delivering understanding for complex topic of token design & valuation
Not just data.
Maybe this is a reason why I see a lot of “fundamentals” posts that just “inform” people on “fundamentals”, but zero trading strategies using fundamentals as an input?
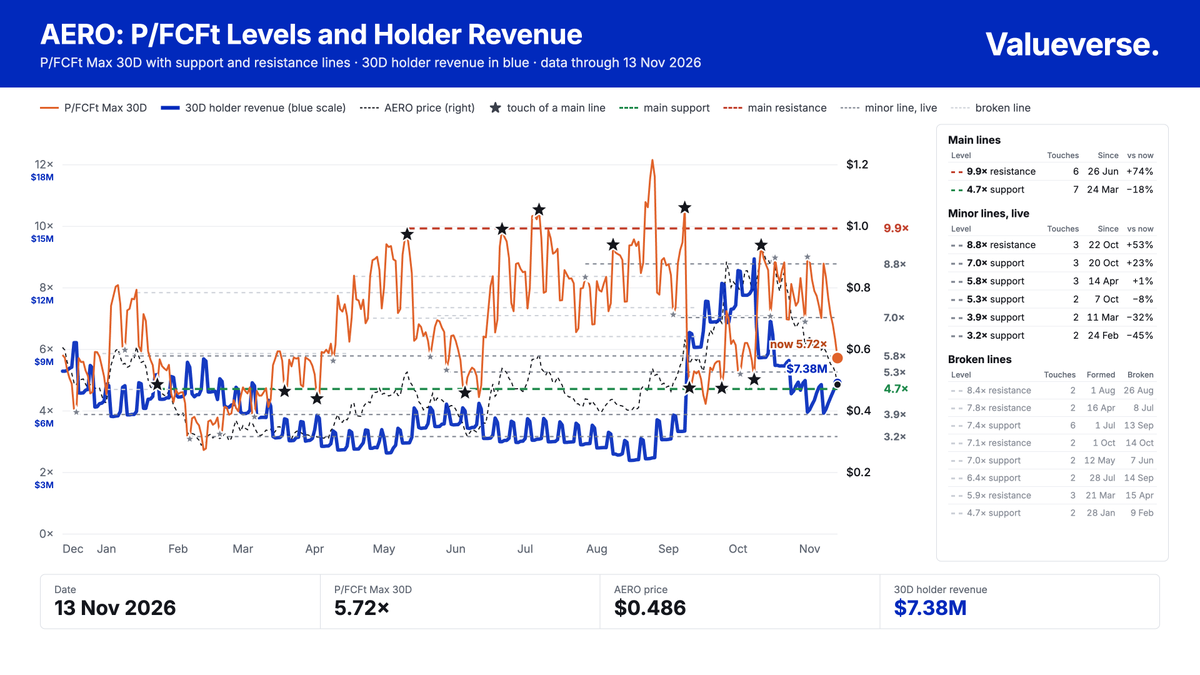
$AERO fundamental analysis:
1. Nothing wrong with a project itself: market is down, so valuation compressed a bit
2. P/FCFt is ~5.7x, it approaches the resistance level ~4.7x
2. 30D Revenue is around Jan 2026, and much higher than during the March-Aug periods of quiet market.
NFA, for research purposes only.
Built with Valueverse API
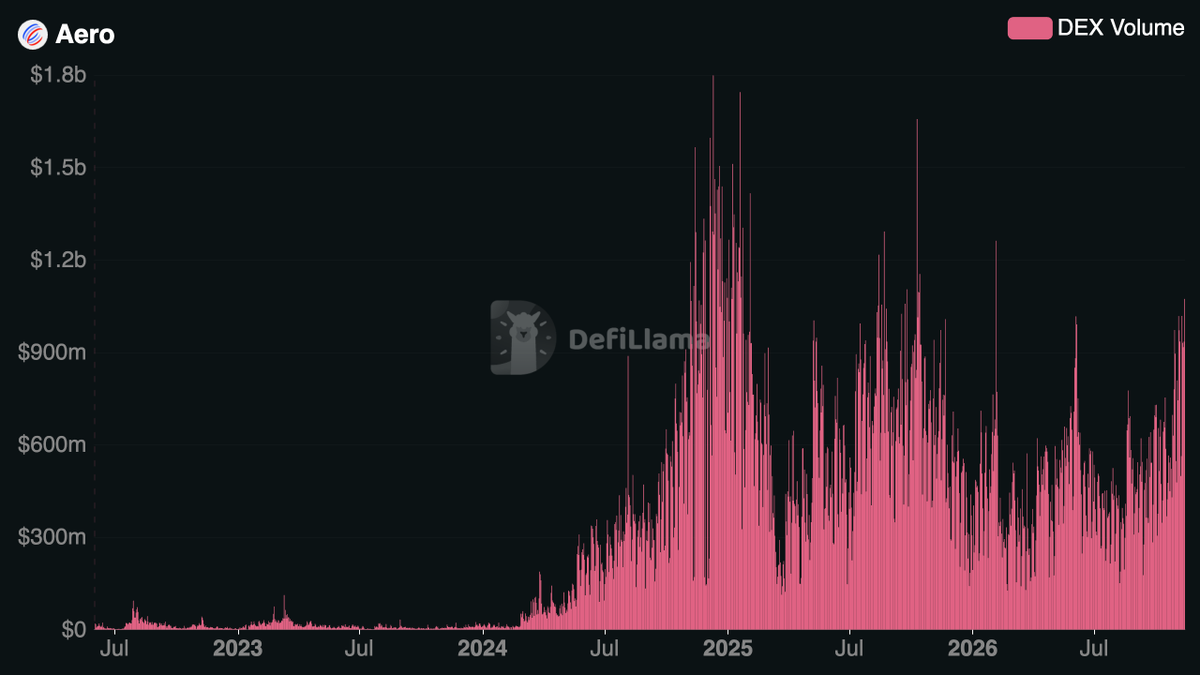
absurd disconnect on aerodrome-finance:native, DEX volume is up 2.5x from August after the chain expansion and token has completely retraced gains over the last few months.
AERO trades at about 3.7x annualised 30-day revenue, vs UNI at 35.1x.
keep in mind AERO's emissions are variable and are expected to decrease via predictive allocation vs UNI's are fixed at the 20M annual growth budget.
some names are completely detached from fundamentals at these levels...
Trading on token fundamentals?
Yes, I've actually built something for that.
Here's a short excerpt from a conversation I had yesterday.
More on that: I found systematic trading strategies for $AERO and $FXN. Cooking a strategy for $HYPE.