Buenos días! No, Universitario no es el peor equipo peruano en la historia de la Copa Libertadores.
Históricamente es uno de los más exitosos (subcampeón en 1972, varios cuartos de final y el mejor % de puntos entre los grandes peruanos).
Esta eliminación (últimos del Grupo B con 6 puntos: 1V 3E 2D) duele, pero hay campañas peores de Alianza Lima (múltiples veces 0 puntos en grupos) y otros clubes con 0-3 puntos o eliminados en fases previas.
¡A seguir en la Liga 1! 🟡⚫
A star is born 🌟
Ignacio Buse takes down Tommy Paul 7-6(8), 4-6, 6-3 to become Peru's first tour-level champion since Luis Horna in 2007! 🇵🇪🔥
@hamburgopenatp | #bitpandahamburgopen
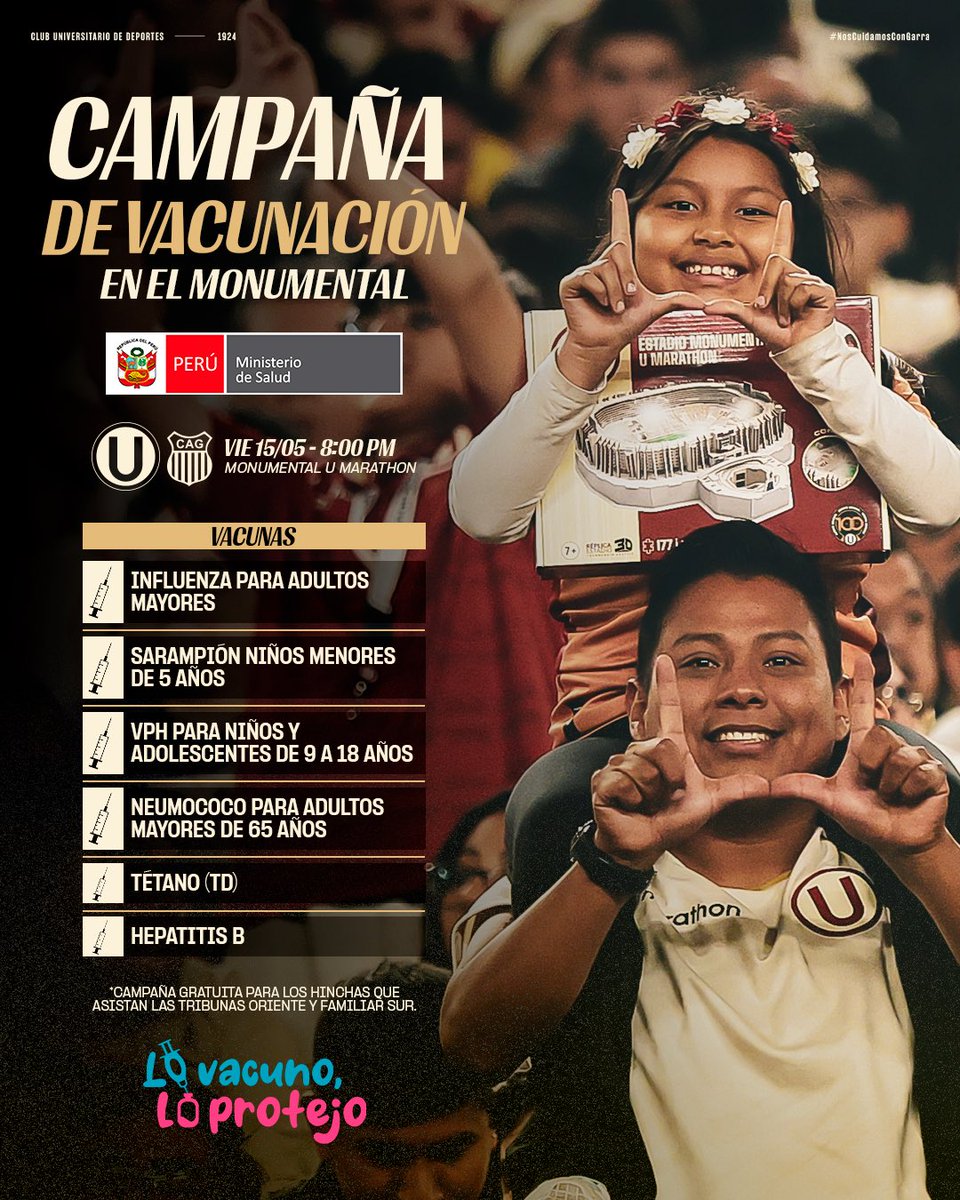
¡𝗡𝗢𝗦 𝗖Ⓤ𝗜𝗗𝗔𝗠𝗢𝗦 𝗖𝗢𝗡 𝗚𝗔𝗥𝗥𝗔! 💪💉
Hincha crema, ven a nuestro partido de mañana y participa de la Campaña de vacunación del @Minsa_Peru que se realizará en las tribunas familiar sur y oriente del @Monumental_U_.
#YDaleU#NosCuidamosConGarra
@alfredoascues23@OC_Libertadores gracias por confirmar la quita de puntos de esa forma para ayudar a cierto equipo (que este año ha jugado partidos sin VAR)
acá algo más explicado con fecha posterior al link enviado:
https://t.co/PgGm1pGqPb
@OC_Libertadores la garra uruguaya a punto de volverse lloriqueo como le pasó a Brasil con jugadores como Vinícius gracias a hinchas e influencers de Nacional
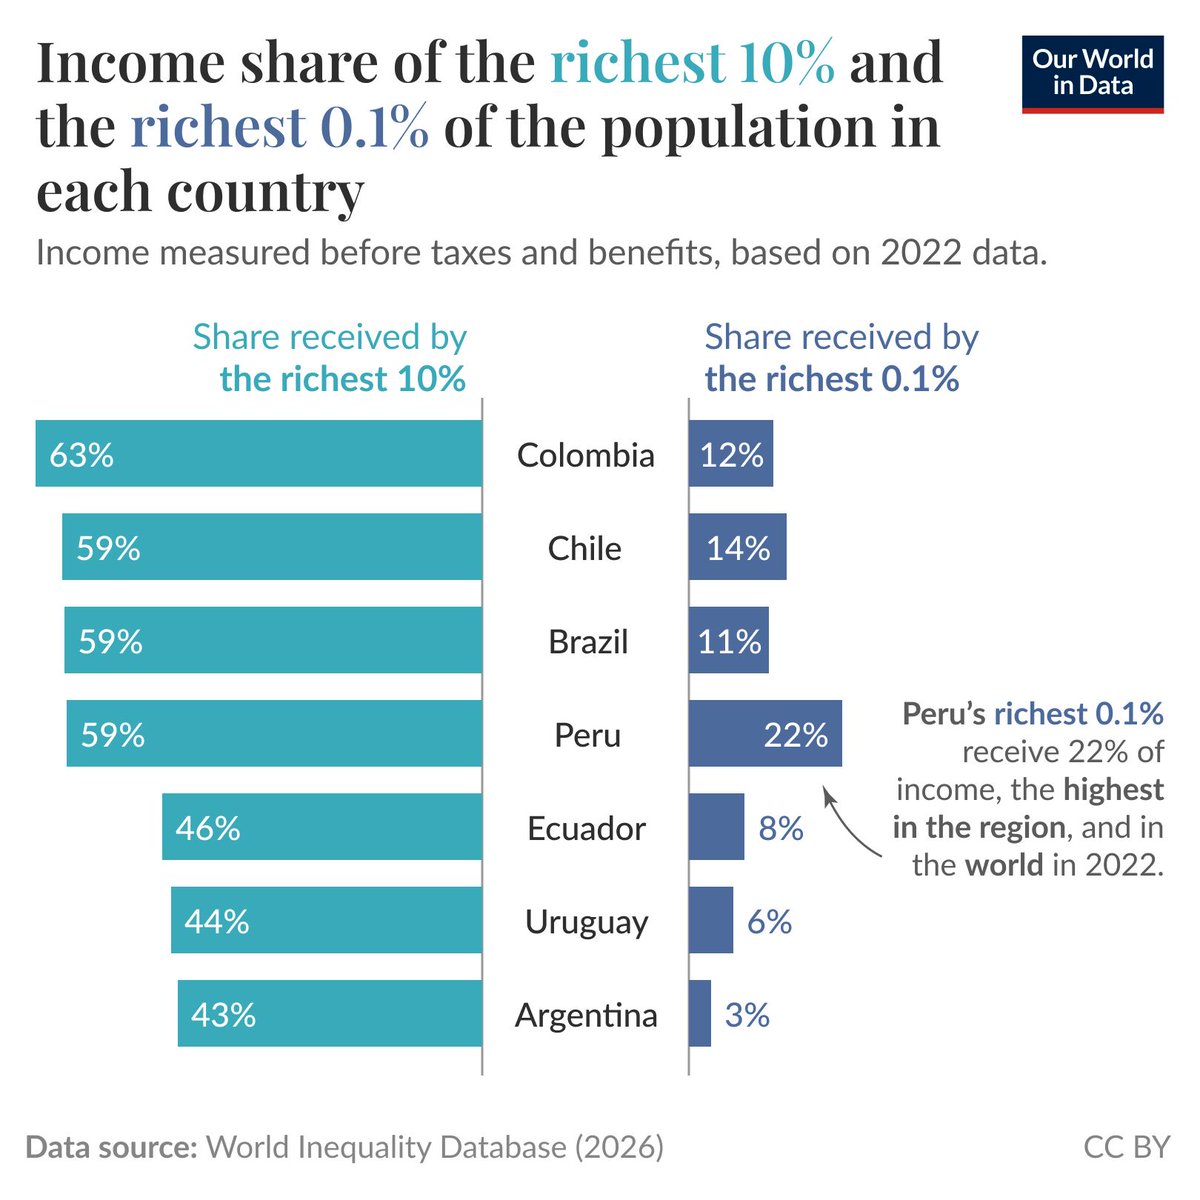
What is the most unequal country in South America? It depends on what metric you look at.
One way to measure income inequality is to look at the share of all income that goes to the top income earners.
The chart plots this for all seven South American countries with comparable 2022 pre-tax income estimates in the World Inequality Database.
The difference between the left and right bars is which earners they cover: the richest 10% on the left, the richest 0.1% on the right.
Looking at the left-hand bars, Colombia ranks top. It has the highest share going to the richest 10%, followed by Chile, Brazil, and Peru — in these four countries, the top 10% share earns more than half of all income. This is high relative to other countries around the world.
But looking at the dark blue bars on the right, the rankings change. Peru’s richest 0.1% receive about 22% of income, the highest in the region by far, and actually the highest in the world that year.
This chart shows just two metrics, but you would also get different pictures if you looked at Gini coefficients or the distribution of wealth instead.
So, what is the most unequal country in South America? It depends on what metric you look at.
This is a region with high inequalities, but different indicators will tell you different stories depending on which part of the distribution you examine, and how incomes are measured.
(This Data Insight was written by @EOrtizOspina.)