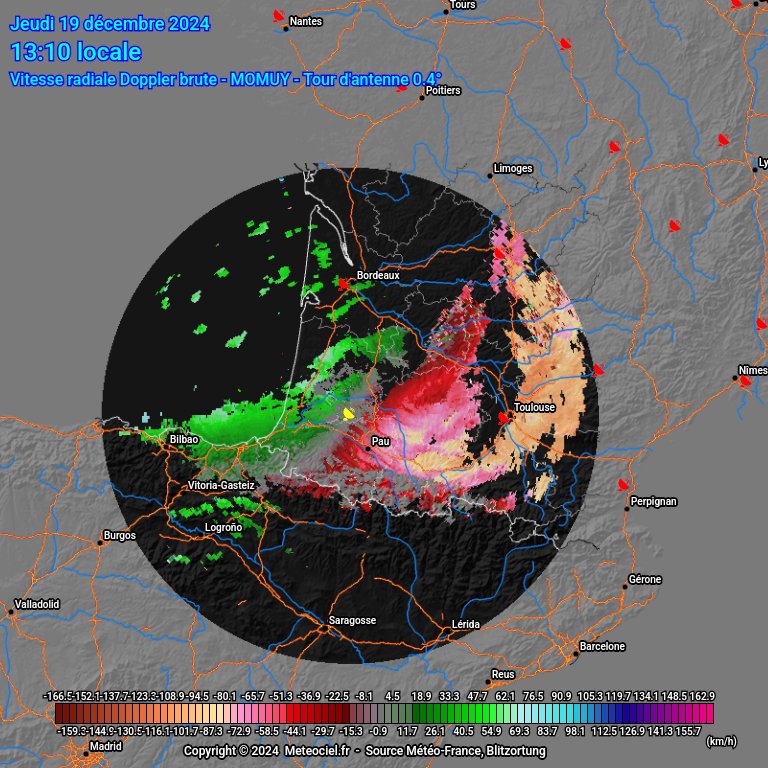
Ca y est ! Il est de retour ! 😃
Le radar #pluie de MOMUY (40) qui couvre une partie du Sud-Ouest près des Pyrénées est de nouveau opérationnel.
Arrêté depuis mars 2024, il est de nouveau disponible sur la mosaïque et en mode radar expert sur Météociel.
➡️ https://t.co/pW9mhoT7H8
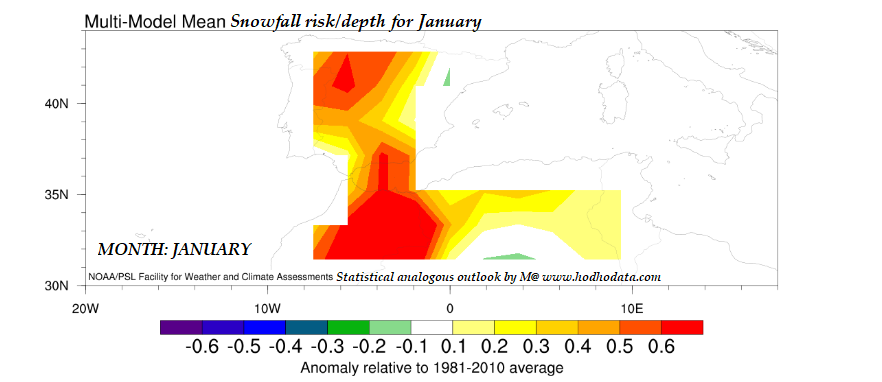
JANUARY Snowfall Risk/ Depth standardized anomalies for the Iberian peninsula and North Africa. The warm colors ( namely the red, orange and yellow) imply higher odds of snowfall or snowfall depth . Colors represent probabilities of snowfall and not necessarily quantities of snowfall DURING #January . Also this monthly weather outlook is statistically driven risk analyses based on a vector of analogous seasons that utilized SST, climatic teleconnectivity indices and rainfall and temperature records for 110 years in climatic archives . If this statistical analogous seasonal outlook converges on the real universe, would it be cold during January?-Most Likely!
Courtesy: NOAA Physical Science Laboratory.
Statistical Latent Profile and Class analysis By Mohammad Alkhateeb, https://t.co/4PftHqD0mL
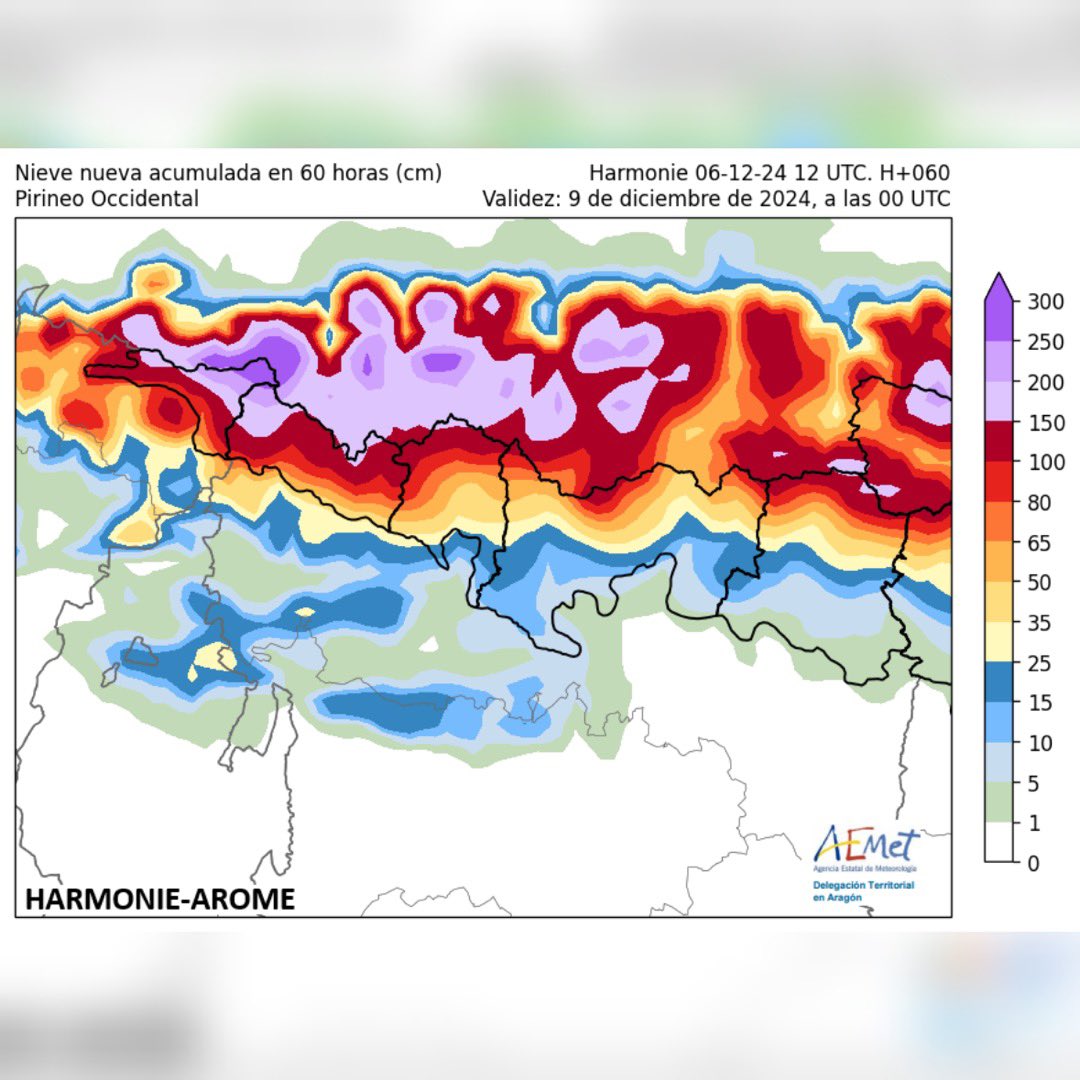
Algunos de los mejores modelos de alta resolución apuntan a una nevada de hasta ⚠️🔴 250/270cm ‼️en 60h en el macizo de #LarraBelagua 😳😱
En otros puntos de la vertiente N y divisoria del #PirineoOccidental entre 150 y 250cm
❄️📏 SWISS 4x4 / HARMONIE-AROME:
December snowfall risk for North Africa and Southern & Western Europe.
Firstly, this is statistically analogous based outlook for snowfall water equivalence. Data related issues were noted during the iterative analysis due to measurement related issues. The orange-red highlighted regions in the multimodsl mean outputs (within bkack rectangles) may be at higher risk of snowfall during December. Cluster Analysis and exploratory factor analysis EFA were used to summarize analogous possible Decembers ( n=24 years). Yellow highlighted regions are at lower snowfall risk.
This outlook should be considered along with Numerical Weather Prediction models outputs and color in tge maps characterize cumulative December propensities for snow amounts and not necessarily the quantities.
Spain & Portugal severe rainfall risks for the months of Dec-Feb. This is statistically dependent analogous forecast. Blue and purplish colors imoky higher odds of rainfall and severe rainfall respectively.
🌧️ Uno de los argumentos estos días en contra de los avisos meteorológicos es el de “se ponen avisos rojos muchas veces y luego no pasa nada”.
➡️ Y es que un #AvisoRojo habla del RIESGO de un evento extremo.
👇 Así se hace una previsión usando la #probabilidad. @euskaltelebista
The Stratospheric Polar Vortex is becoming unusually weak for this time of year, reflecting the Weather anomalies in the lower levels and hinting at a possible winter linkage, similar to the Winter of 1981/1982
https://t.co/262EA8kiY9
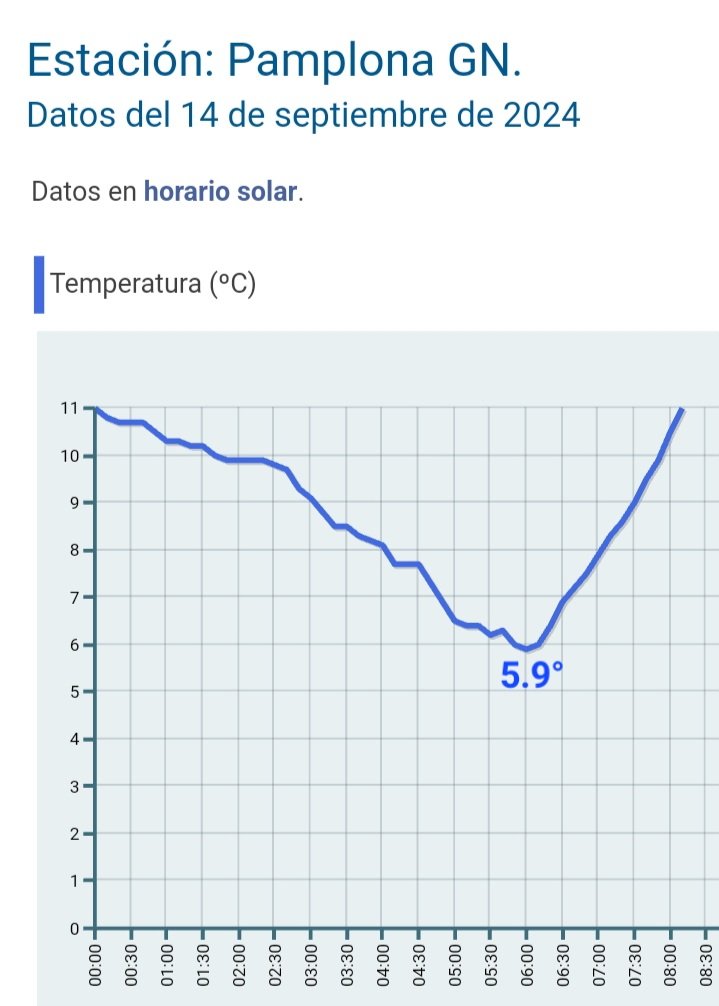
La temperatura mínima 📉 de hoy en el centro de #Pamplona#Iruña ha sido de 5.9° en la estación oficial de Labrit (GN/AEMET)
No se registraba una mínima tan baja en la 1ª mitad de Septiembre desde 1965!! Entonces fueron 3.8° el día 11
Jueves y viernes se utilizarán muchos jerseys de manga larga en la mitad norte peninsular.
Entrada de aire frío desde el norte que dejará los termómetros con anomalías negativas de temperatura de 8/10 grados en esas regiones.
Podrá nevar en Pirineos a partir de 1700/1800 metros.
El jueves 12 y viernes 13 tendremos temperaturas hasta 10 grados inferiores a las que corresponderían en algunos puntos de la Península Ibérica.
A nivel hemisférico se aprecia muy bien como nos llegan esas anomalías y además ocupan bastante extensión.
Inicio del mes de septiembre muy húmedo en #Pamplona y gran parte de #Navarra.
Datos de precipitación acumulada en la estación automática de Labrit.
Ha llovido todos los días de lo que llevamos de mes, alcanzándose ya los 97,9 litros
La media de septiembre superada en una semana
🌧️ Fascinante la borrasca que se ha situado en pleno golfo de #Bizkaia y que ha dejado impresionantes acumulados de #lluvia especialmente en el pirineo navarro y oscense.