Central banks are likely buying way more gold than official figures suggest:
World central banks acquired +44 tonnes of gold in July, +158% above the pre-2022 average of +17 tonnes, according to Goldman Sachs.
This brings the 3-month average of purchases to +91 tonnes, near its highest since mid-2025.
By comparison, the 12-month moving average has oscillated between +50 and +60 tonnes over the last few months.
Meanwhile, official central bank purchases of gold stood at +23 tonnes in July, or 21 tonnes below actual levels.
Furthermore, official monthly purchases have not exceeded +60 tonnes in any month since November 2024, also representing a wide discrepancy.
Central bank gold demand may be much greater than official figures suggest.
🤖 LATEST: SharpLink CEO Joseph Chalom says Ethereum could serve as an “uncensorable neutral rail” for AI agents, calling it “a very important role” in the emerging AI economy.
#Bitcoin – What’s Next?
The Big Sunday Report: All We Need to Know
TA / LCA / Psychological Breakdown:
Several weeks ago, when Bitcoin was trading around $60,000, I called for $88,000. Last Sunday, I repeated that target and explained why the rejections at the MA50 Weekly did not change my bullish outlook, and to make it very clear: Last week the sentiment was completley different than today, last week almost everyone was bearish and was calling for a rejection at the MA50 weekly, in fact i called for a breakout and justified it We had seen a similar pattern in early 2023, when several failed attempts were followed by a breakout. A few days after my report, Bitcoin reached $87,300, less than 1% below my target. After anticipating this move from $60K, I consider the $88K target area effectively reached. The move I expected has played out, and while a target has fully achieved for me, i saw plenty of bears capitulating and turning bullish, at the exact region where my plans shifted towards a short accumulation.
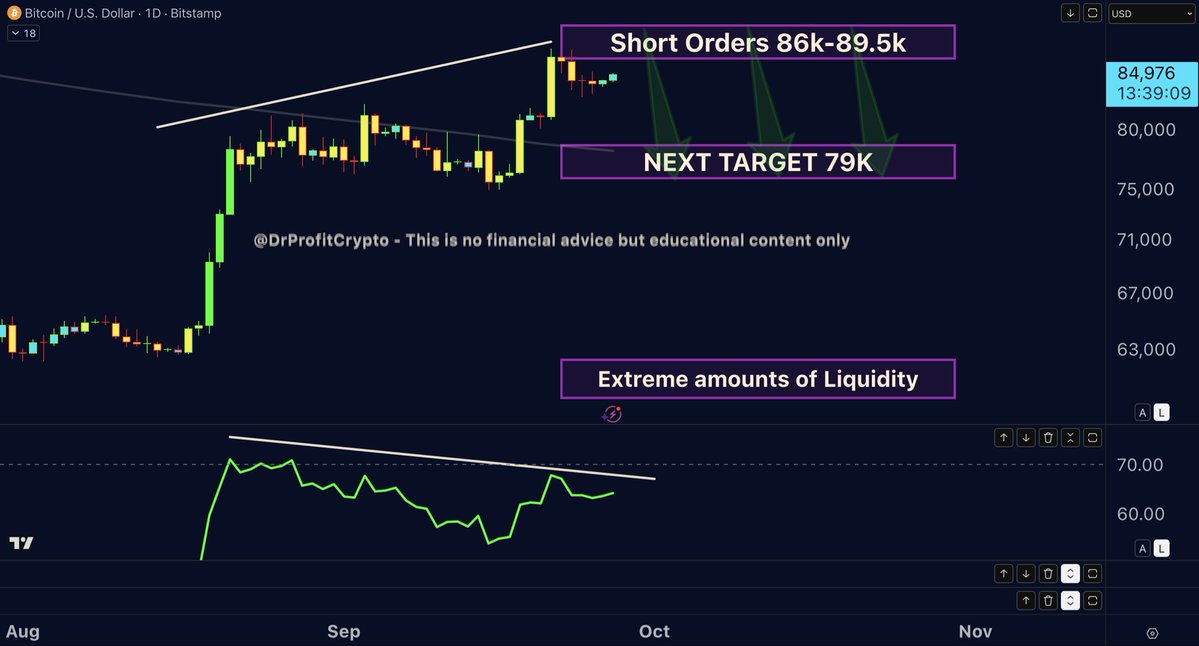
Now my focus is on the next move. I entered a short around $86,200, and placing within the $86K–$89.5K area several short orders, and my first downside target is $79,000, around the MA50 Weekly. Important i mention first, this does not mean that there is a second target lower, but 79k and then i can tell based on BTC reaction, but for now its 79k and continue to a new high and continuing the bull. Let me make this extremely clear: I consider Bitcoin to be in a BULL MARKET, but I expect a correction WITHIN that bull market. My spot positions accumulated around $60K remain open. The short allows me to position for a pullback while maintaining my longer-term investments. At $79K, I want to see whether the MA50 Weekly holds as support. That reaction will guide whether I take profits on the short or continue holding if support fails.
Also four key indicators are showing bearish divergences, RSI on daily, the most important one for me, alongside ADX, MACD/PPO and MFI. RSI, MACD/PPO and MFI show bearish divergences, while ADX shows weakening trend strength. That is why I’m using the short to reduce my net exposure, aiming to turn any profits into more coins before the next leg up.
Further below, I have marked the substantial liquidity area around $62,000. It remains relevant if the correction develops into a deeper move, but my main target remains $79K , For now, my positioning is clear: spot holdings remain open, the short was entered around $86,200, and additional short orders are placed between 86k - 89,5k and I am targeting a move toward $79,000 before deciding the next step. I remain bullish on the larger trend while preparing for a correction after the move into my target of $88K was hit
THIS IS NOT FINANCIAL ADVICE, BUT EDUCATIONAL CONTENT ONLY.
Join Premium: https://t.co/Qx4dZU40Lk
Bitcoin has triggered a sell signal, but $MSTR hasn’t
That’s a notable divergence🤔
Lately, $MSTR has been significantly stronger than $BTC itself, and mNAV is now sitting around 1.2
@saylor has been executing well lately
🐋 WHALE WATCH :Something interesting is happening with $LINK.
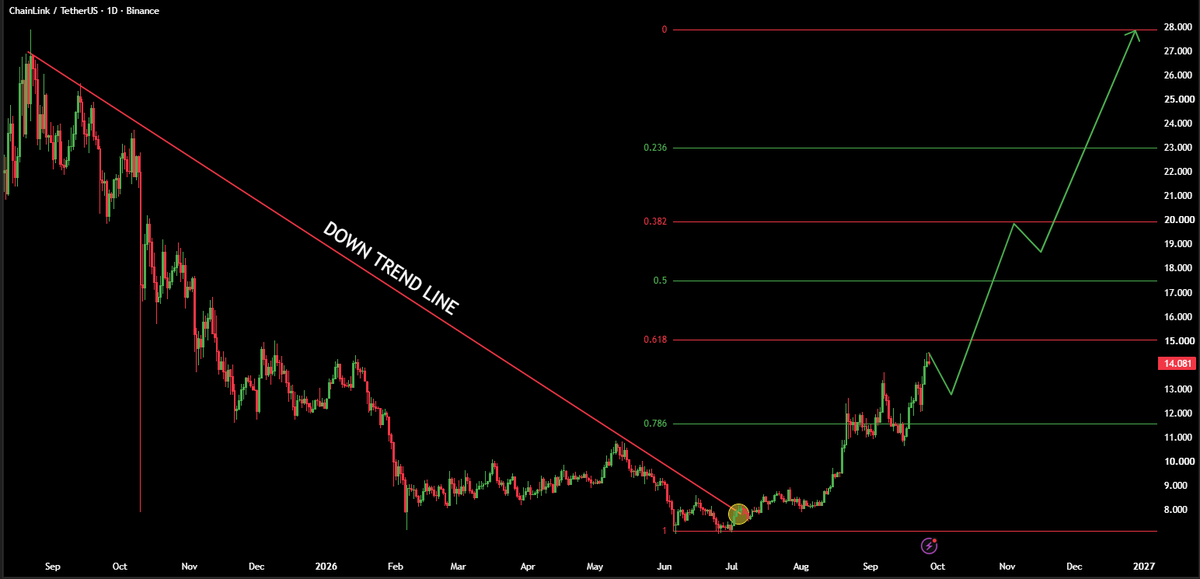
The daily chart shows a long term downtrend line that has controlled price for months.
Now LINK has pushed through that structure and is trading around $14.
Potential Fibonacci roadmap:
=> $15
=> $17.3
=> $20
=> $23
=> $28
The big level is $20.
Reclaiming it would put the higher Fibonacci zones into focus.
Nothing is guaranteed in crypto = confirmation = prediction.
But $LINK has officially entered an interesting technical setup.
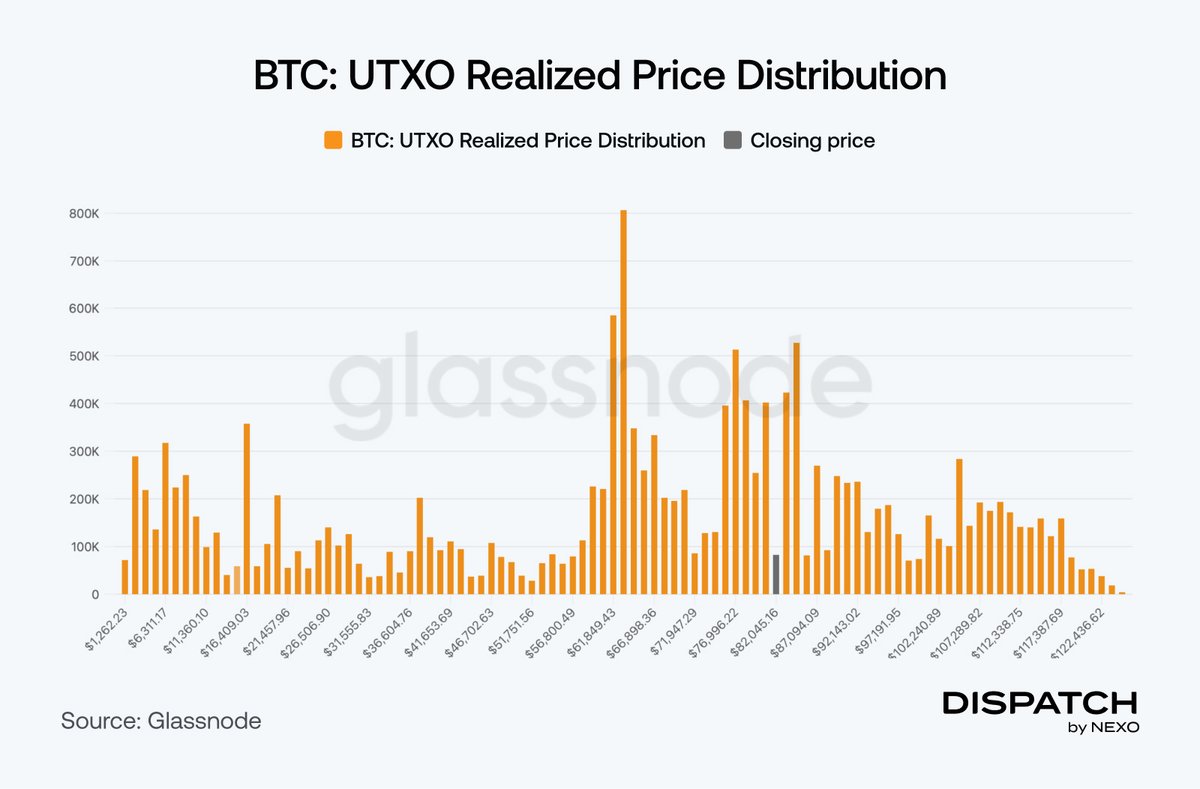
Bitcoin's most crowded price level sits right around $80K.
About 13% of supply, close to 2.7M BTC, was last bought between $75.7K and $84.6K, right where price sits now.
That's a lot of recent buying packed into one zone. Whether it holds as support or turns into selling pressure will say a lot about conviction.
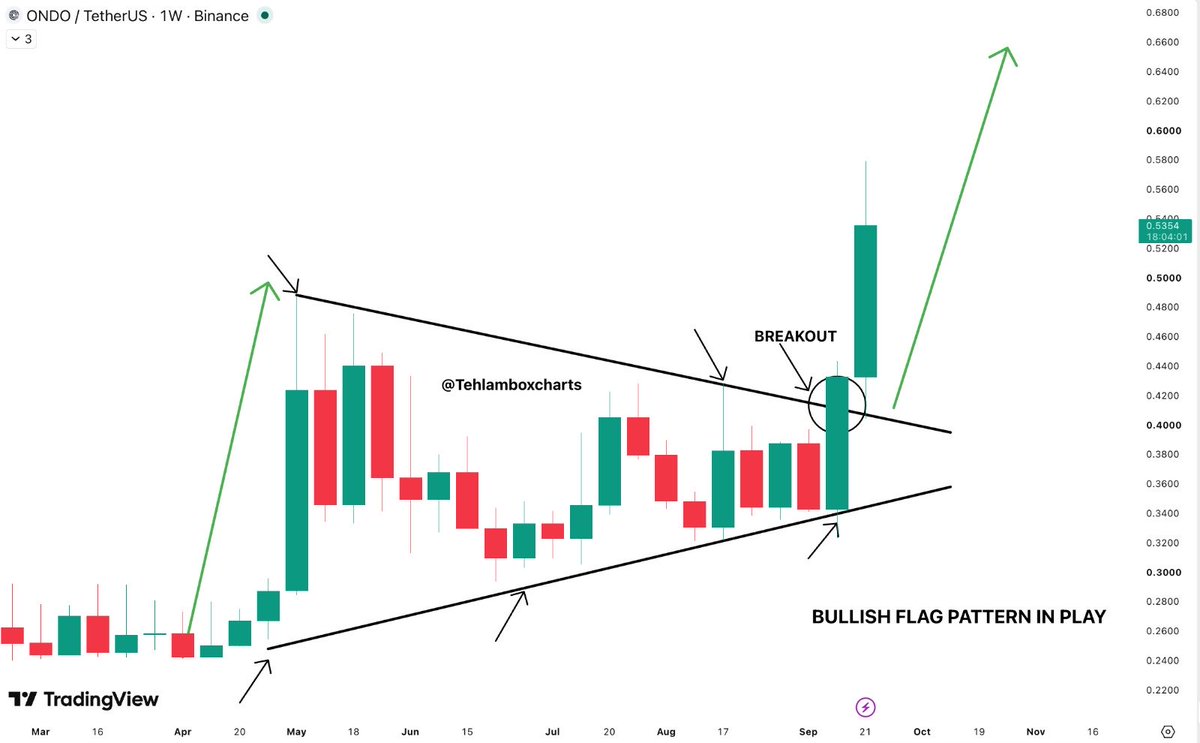
$ONDO holders finally got their patience rewarded
That bullish flag has been sitting there for months and price ripped through the upper trendline
Breakout is here
Would be funny if this is only the beginning of the move
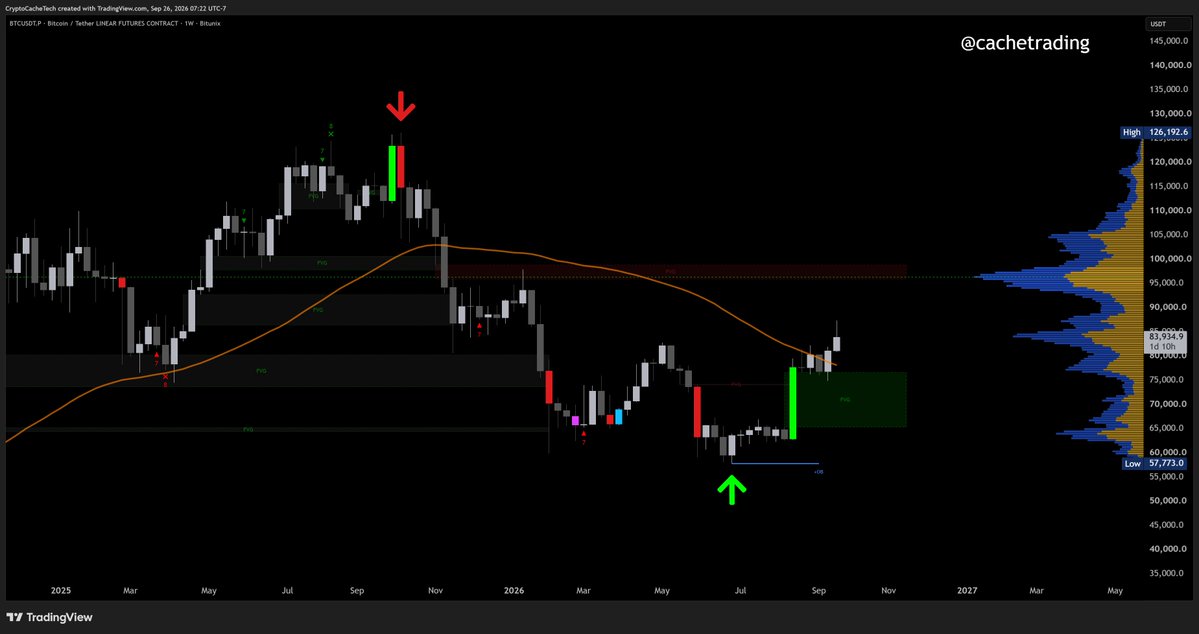
Called the $BTC top in early October, with 60-65k as the next major level. 🎯
Advised against shorting the bottom at 60k, instead, bought heavy in that range.
Long from 59k...
Just opened a short at 86.5k.
Targeting ~80k next.
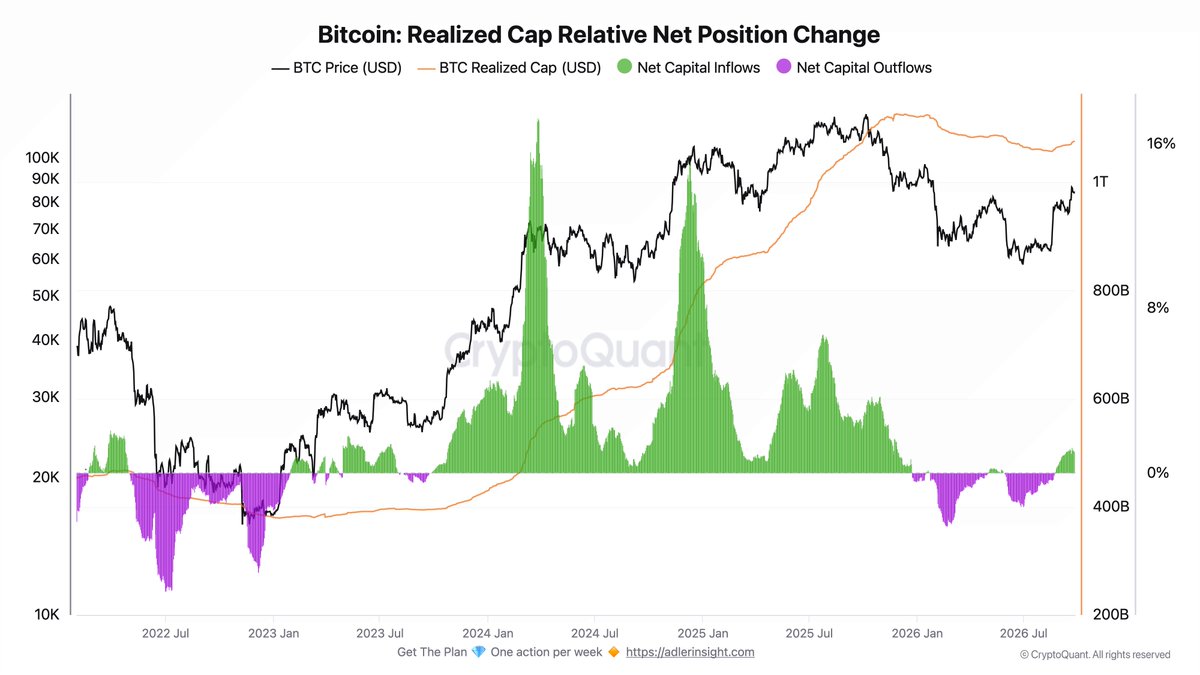
Since August 24, capital has been returning to Bitcoin: Realized Cap has grown by $15 billion, and the inflow metric reached 1.27%, its highest level since November 2025.
The scale of the inflow still corresponds to an early stage of recovery.