Mapped: How Long Europeans Work to Afford Netflix 📺
This graphic by The European Correspondent is one of the many incredible data-driven charts and stories from creators featured on our website. ✅
https://t.co/4mlFVE1ejl
About 71% of the world’s population now lives in countries with fertility rates below replacement level 👶
China’s fertility rate has fallen to 1.0 birth per woman, while India is also below replacement at 1.9. The highest fertility rates remain concentrated in Sub-Saharan Africa.
Read the full article: https://t.co/xsZtYcVHPK
Gold prices rose more than 16-fold from 2000 to the first half of 2026, significantly outpacing U.S. home prices 🥇
Created in partnership with @USMoneyReserve, this graphic compares gold’s purchasing power against U.S. residential real estate over time using data from Macrotrends and the Federal Reserve Bank of St. Louis.
https://t.co/x9c2X985fo #usmr01
Ranked: Rule of Law in 41 European Countries in 2026 ⚖️
This graphic by The European Correspondent is one of the many incredible data-driven charts and stories from creators featured on our website. ✅
https://t.co/kHVzqOmZ8A
Ireland leads the world in ICT service exports at $301.7 billion, followed by India at $200.3 billion 💻
Created in partnership with @Adobe, this visualization highlights the top countries by information and communication technology service exports using data from the World Bank.
https://t.co/k37XcZqKWf #adb02
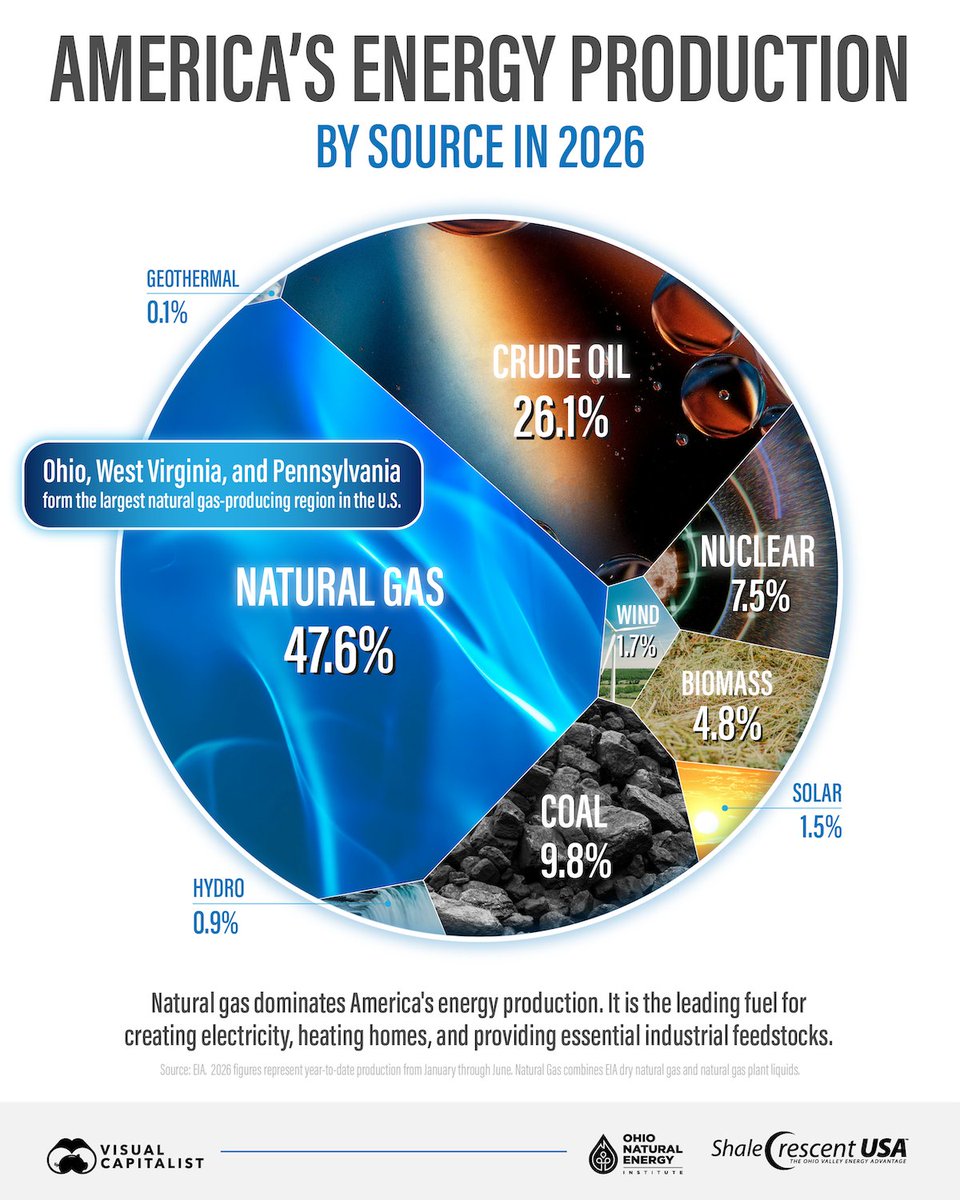
Natural gas and natural gas plant liquids account for 47.6% of U.S. primary energy production in 2026 YTD ⚡
Created in partnership with @ShaleCresUSA, this graphic shows America’s energy production by source using data from the EIA.
https://t.co/3SoRFCeXRf #sc02
Mapped: How Much of Each Country Is Online? 🌐
This graphic by Iswardi Ishak is one of the many incredible data-driven charts and stories from creators featured on our @VoronoiApp. ✅
https://t.co/FBD44DUpZ2
The U.S. attracted $285.9 billion in private AI investment in 2025, more than 23 times China’s total 🤖
Created in partnership with @TerzoHQ, this graphic ranks the countries attracting the most private AI investment as the global AI boom accelerates.
https://t.co/qc3lelMMHn #ter02
Mapped: EU Countries by Government Debt (% of GDP) 💶
This graphic by Aneesh Anand is one of the many incredible data-driven charts and stories from creators featured on our @VoronoiApp. ✅
https://t.co/ZxpDnRcliW
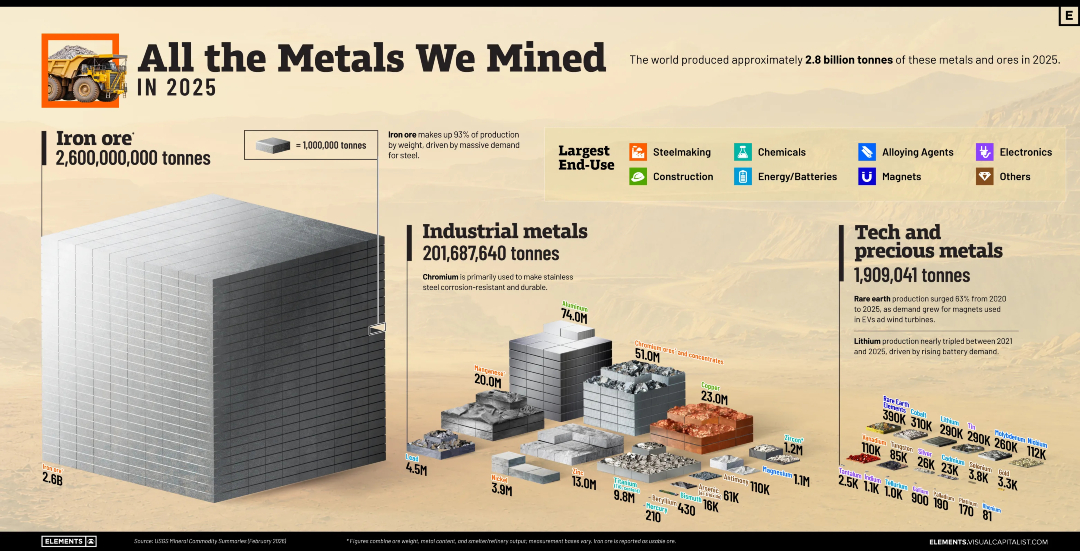
All the Metals the World Mines in a Year, Visualized ⛏️
From @VCElements—bridging the gap between global trends shaping our future, and the raw materials powering them ⚡️
https://t.co/Eo8htk09fv