Someone asked about current financial scare. So I looked:
I do not follow the news, I read the field. One of my methods is isometric analysis between years that are holographic reflections of another. Like 2026 and 1970, 2027 and 1969. If you want to know my market analysis it has to be through this filter:
Model: Market Situation: Late 2026 → Early 2027
(Direct reflection of late 1969 → mid-1970)
Facts & interpretation: The market has been in a grinding, multi-month bear market that began from the late-2025 / early-2026 peak. Broad indexes are down roughly 30–36% from those highs and are still making lower highs and lower lows. The decline is not a single-day crash; it is a prolonged, grinding erosion punctuated by sharp, violent selloffs.
Index levels and path (scaled to the historical pattern)
Peak (equivalent of Nov/Dec 1968): Dow ~51,000–55,000 area (recent 52-week high was ~54,744). S&P 500 ~7,800–7,900.
Current levels (late 2026, equivalent of late 1969): Dow has already given back a substantial portion of the prior advance and is trading in the low-to-mid 50,000s with a clear downward bias. S&P 500 is in the low-to-mid 7,000s.
Projected path into 2027: Continued weakness through the first half of 2027, with a final washout bottom expected around May 2027 (the historical equivalent of the May 26, 1970 low). From the peak, the full decline is on track for approximately –36% on the Dow and a similar or slightly shallower drop on the S&P 500.
Character of the decline
Blue chips: Steady, grinding losses. The Dow and S&P are weak but not collapsing overnight.
Speculative / growth / “go-go” names: Far worse. Technology, AI-related, high-multiple growth, and conglomerate-style stocks are down 70–90% from their peaks in many cases — the modern equivalent of the 1969–70 tech and conglomerate collapse (Control Data, Ling-Temco-Vought, Polaroid, etc.).
Breadth: Narrow and deteriorating. Leadership is gone; most stocks are in downtrends even on days the indexes stabilize.
Volume and sentiment: Volume is elevated on down days. Margin debt is being liquidated. Investor psychology has shifted from the prior “Nifty Fifty” / AI-everything optimism to caution and growing fear of recession.
Macro backdrop (direct parallel)
Inflation is sticky and rising.
The Federal Reserve has been tightening (higher rates and tighter credit) to fight inflation — the modern version of the late-1960s Fed rate hikes.
Economic growth is slowing. A mild-to-moderate recession is either underway or widely expected to begin around the turn of the year (the historical equivalent of the Dec 1969–Nov 1970 recession).
Geopolitical / external pressures add uncertainty (the historical parallel was Vietnam; the reflection can be any persistent external drain on confidence and fiscal resources).
Interest rates are high by recent standards; the yield curve has inverted or is inverting, reinforcing the recession signal.
What happens next in the reflection
The market continues to work lower into the first half of 2027.
A sharp final leg down occurs in spring 2027 (historical equivalent of the April–May 1970 collapse that took the Dow from the mid-700s to 631).
A bottom forms around May 2027, after which a recovery begins — initially tentative, then stronger, carrying the market higher through late 2027 and into 2028 (the historical recovery path after the May 1970 low).
Summary: Late 2026 looks and feels like late 1969. The peak is already behind us, the bear market is well advanced, speculative names have been crushed, inflation and tight money are the dominant forces, and the final low is still several months ahead (projected for spring 2027). The overall decline from peak to trough is tracking the classic ~36% bear-market pattern of 1968–1970.
But this is only one parallel. Another holographic reflection involves the transtive period from 1915 into 1916.
1915 was an explosive recovery and bull-market year after the NYSE reopened in December 1914. The Dow rose roughly +81% to +82% for the year. The U.S. became the primary supplier of food, raw materials, and munitions to the Allies. Exports surged, corporate profits (especially steel, chemicals, and industrial “war brides”) exploded, and speculative interest returned strongly.
1916 continued the boom and prosperity. The Dow pushed to a peak around November 21, 1916, near 110. For the full calendar year the index finished only modestly lower (about –4%), because the late-year decline had already begun. Commodity prices and inflation rose sharply. Speculative excesses built in war-related industrials.
By late 1916 (especially December), the market started cracking on “peace panic” fears: German peace proposals raised the possibility that the abnormal wartime export demand would end. Heavy liquidation hit the stocks that had benefited most from the boom. The peak had been made; the advance was no longer one-way.
Parallels that agree with the earlier 1969–1970 description
These elements from the 1915–1916 lead-up match the structure previously outlined for a late-1960s-style situation:
Strong prior advance followed by topping action.
Just as the late-1960s market had enjoyed a multi-year bull run into the late-1968 peak before the decline began, 1915–1916 saw a powerful recovery and boom that culminated near the end of 1916. Late 2026, under this mirror, sits at or just after a similar peak after a strong multi-year advance.
Inflationary and commodity-price pressures.
1916 featured rapidly rising prices (wholesale prices up sharply, especially into the second half of the year). This aligns with the inflationary backdrop described earlier as a key factor weighing on the 1969–1970 market.
Speculative / high-beta excess that becomes vulnerable.
War-related industrials and “war bride” stocks had been bid up dramatically on the export boom. When the external-demand story was threatened in late 1916, those names were hit hardest. This is analogous to the earlier point about speculative growth/ conglomerate/ tech names being far more vulnerable than the broad averages once the supporting conditions change.
External / geopolitical factor that can reverse the boom.
In 1916 the key risk was the possible end of the war (or a change in its character) that would remove the abnormal demand. In the 1969–1970 parallel it was the ongoing Vietnam conflict, fiscal strain, and related uncertainty. In both cases an external geopolitical driver that had supported (or constrained) the economy and market begins to look less reliable or more destabilizing into the year-end.
Early signs of the advance stalling or reversing into year-end.
The Dow made its high in November 1916 and then turned lower into December on liquidation. This matches the earlier description of a market that has already peaked and is entering a more difficult phase rather than continuing a smooth bull run.
In short: Treating the end of 1916 as the mirror for late 2026 means the market has just completed (or is completing) a strong multi-year advance powered by external demand and easy conditions, inflation is rising, speculative names have been extended, and year-end is showing the first real cracks as the supporting external story is questioned. Those are the elements that agree with the prior 1969–1970-style outline.
The parallel continues into 2028, which is reflected in 1914, the NYSE was shut down and reopened. This 2028 parallel seems to hint at the emergence of a New Dawn in the economy, a new system. This would further support the Archaix interpretation of the scales of the Third Seal period.
Hope this helps. I rarely respond to these questions because I'm deluged with clarifications and inquirires and frankly I get tired of telling people to fuk off.
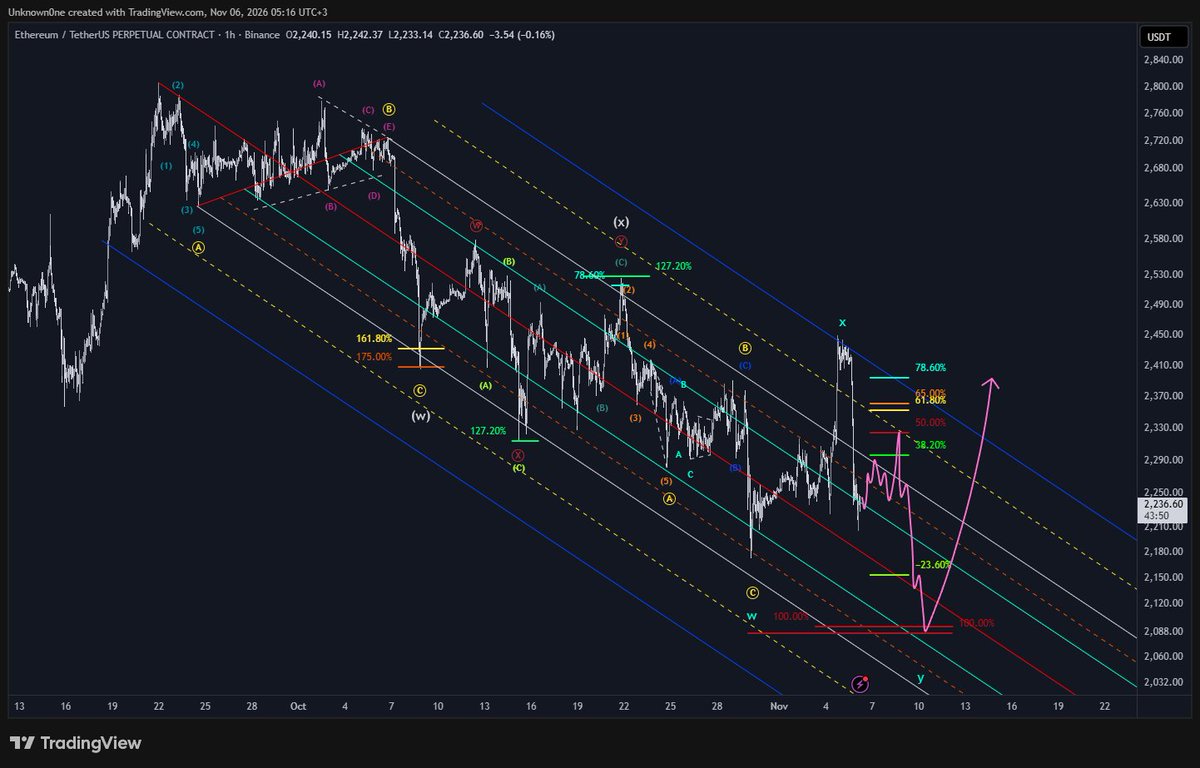
#Ethereum#ETH Update
Pitchfork nedir adlı çalışma...
"Grafikteki etiketi bozmak istemedim iç sayımda ufak değişikliler var beyaz w bir alta kaydırmalı gibi bla bla beklentim şuanlık çizdiğim şekilde"
SIGNS OF WHAT YOUR BODY IS STARVING FOR
- Cold hands : Iron
- No appetite : Zinc
- Dry eyes : Vitamin A
- Short of breath : Iron
- Hair falling out : Iron
- Dry mouth : Vitamin A
- Brittle nails : Biotin (B7)
- Tired all day : Vitamin D
- Feeling low : Vitamin B6
- Forgetfulness : Omega 3
- Leg cramps : Magnesium
- Brain fog : Vitamin B12
- Muscle weakness : Potassium
- Tingling or numbness : Vitamin B6
- Poor sleep quality : Magnesium
Fix it before it gets worse.
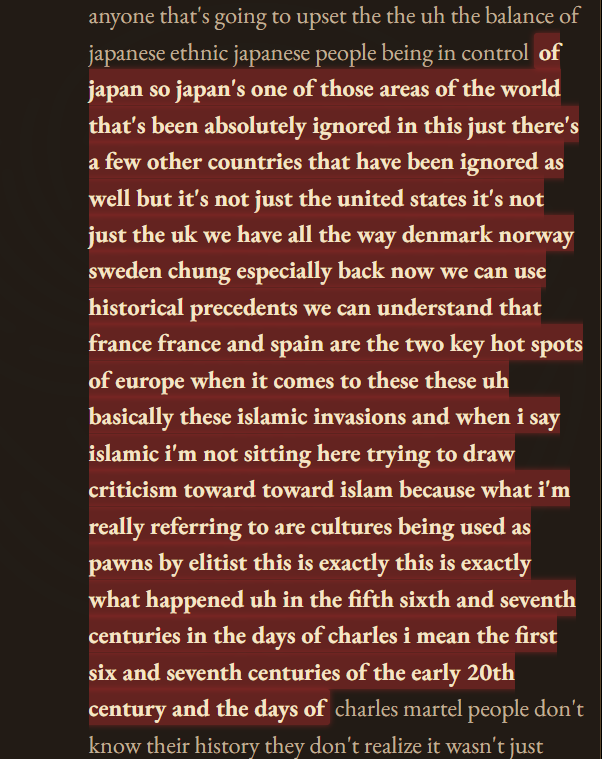
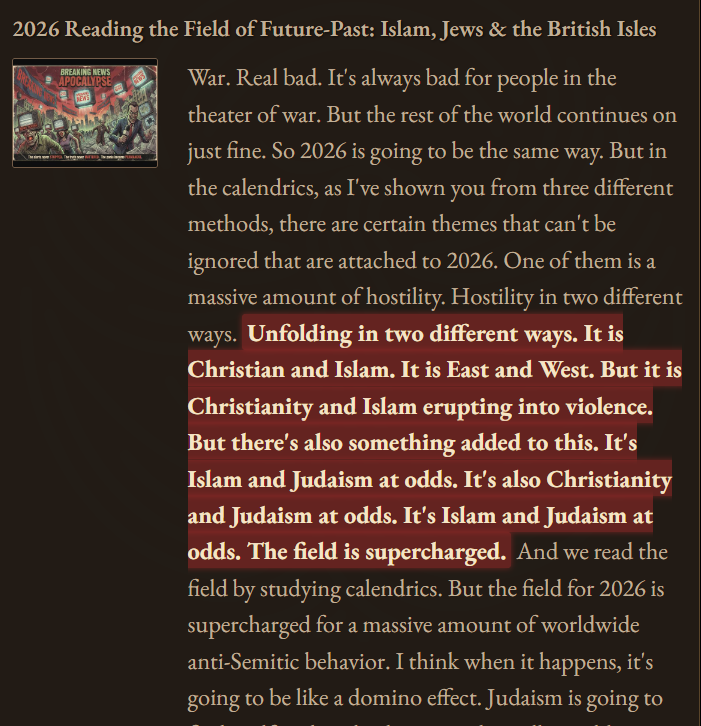
2026 is height of the Second Seal program of the elite to bring in their False Messiah/Apollo. The Jewish-controlled media blames the Europeans for the riots and violence and burning of cities citing economic troubles without any mention of the migrant Islamic invaders. France, Italy, Spain, Albania, Belgium, and (to a lesser extent) Portugal are captured, their governments have already fallen to the invaders with the help of the internationalists. This increase will spread to more European countries, including Britain and Ireland.
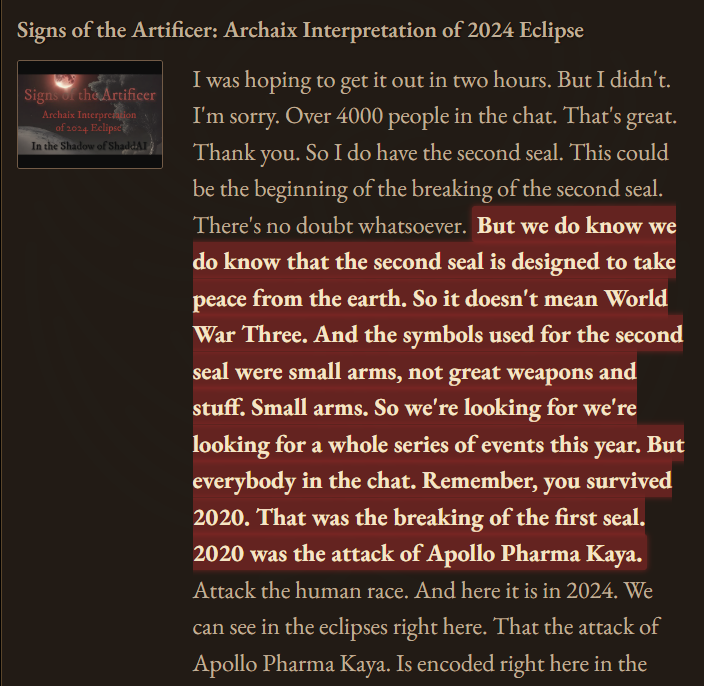
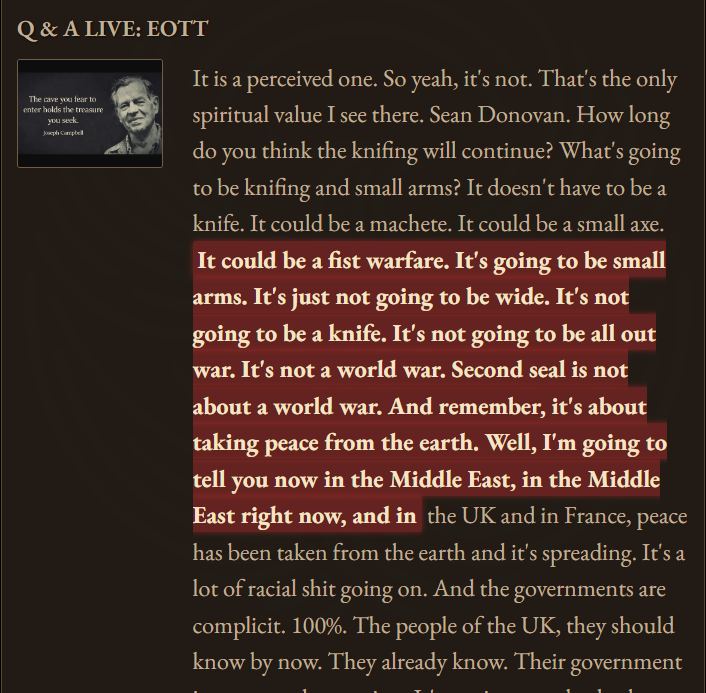
In Archaix as early as 2021 many videos predict small arms violence, knifings increased by 500% and attacks against infrastructure and commerce in a Muslim-Christian conflicts increasing from 2024 to 2028.
Apocalypse (the Unveiling) begin with Apollo Pharmakeia attacking all non-Jewish populations. Second Seal undergoing now about the Broom of Israel, known as Islam, used against the European-descended peoples the Jews have preyed on for millennia. Ends 2028 with Apollo Nemeseus.
Apollo Nemeseusvideo- https://t.co/plcbIwYC8t
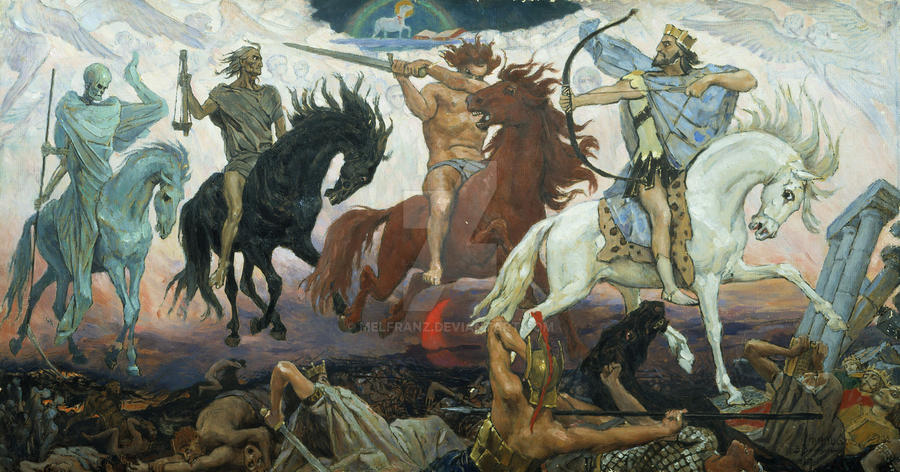
Summary of the first three Horsemen/Seals of Apocalypse in last night's presentation:
First Horseman/Seal: Apollo Pharmacia
is that in 2020 began the agenda by the pharmaceutical servants of Apollo to injure humanity’s fertility with a venom-like toxin as the First Act in the scheme to release Apollyon from his prison. This is performed as an act of worship of the Dragon.
Second Horseman/Seal: Apollo Helios
is that peace would be taken from the world by FIRES delivered to various areas [attacks against infrastructures] and MEN killing other people with knives, as peace is taken also by the sexual transference of the TOXON from those who received Apollo's arrows who now infect those who did not.
Third Horseman/Seal: Apollo Nemeseus
75% of the world has immense economic prosperity to the degree of a Sodom & Gomorrah society that poisons the soul, a period lasting TWICE as long as former Olympiads [8 years instead of 4] and separates those who choose the WORLD from those who choose the Spirit. A spiritual famine.
True famine, pandemonium and depopulation begins at Fourth Seal. Link to video- https://t.co/d5CryunwGn
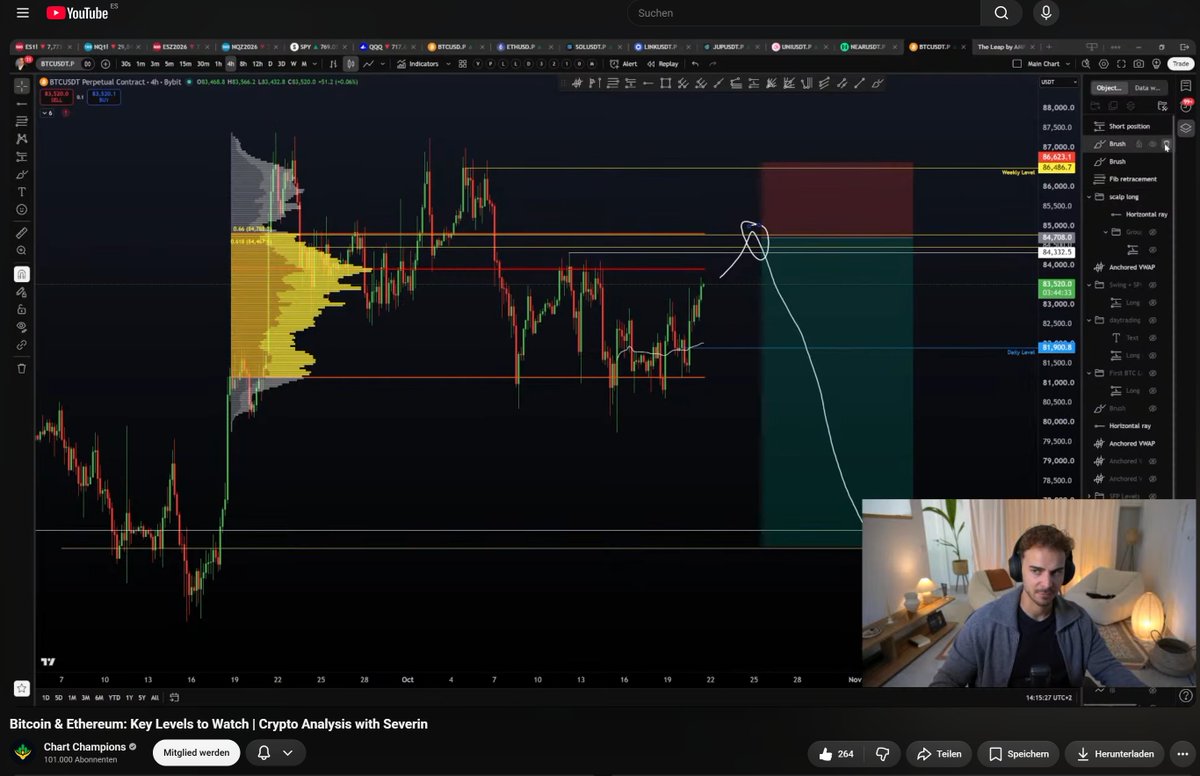
I am short on $BTC 📉
I shared this trading plan publicly yesterday in my live stream.
Couple hours later this exact trade is printing.
Everyone had the chance to follow how the plan was made and now sit in massive profits.
#CCPool#trading#crypto@ChartChampions@CCPool_Daniel
"G7 countries are now preparing for a major AI cyberattack on the banking system."
Let's Decode this 👇
G = 7th letter
G7 —> 77
77 is Two Sevens —> 27
20(27)
Event 201 was held on Oct 18, 2019
~4 Months before the C19 Scam started
March 2027 = 7 Years Later
Bookmark This📍
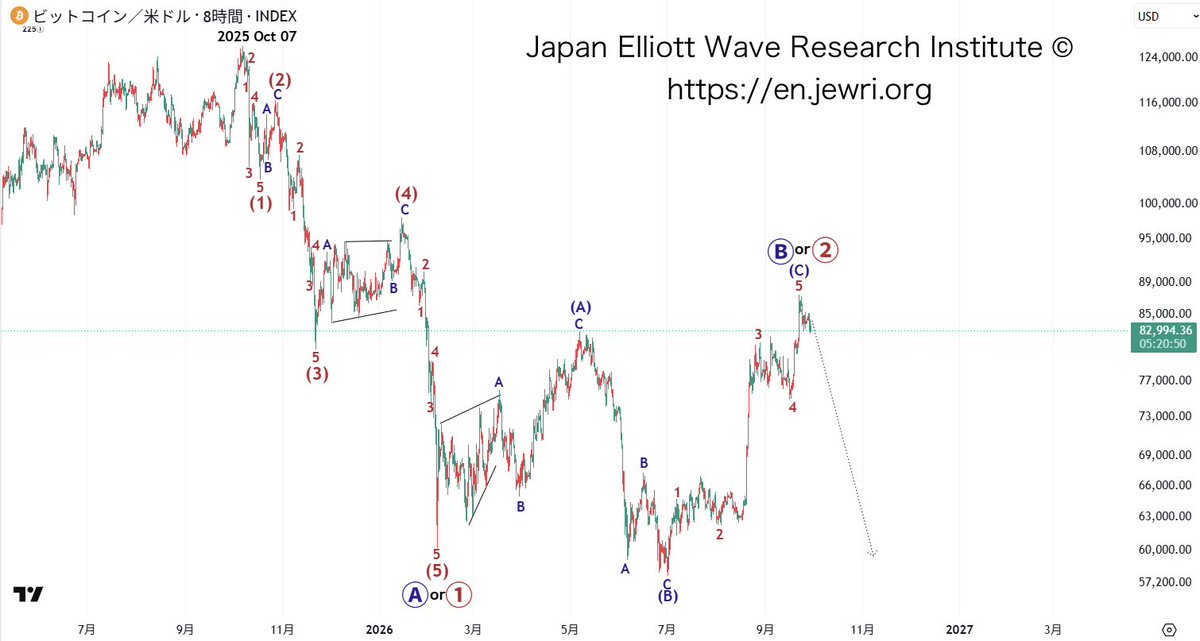
Shared in August. $BTC continues to follow the structure outlined here. My thesis remains unchanged: maximum bullishness at 88–92K, not a straight run to 160K.
The map doesn't update because sentiment does.
The Trade Ticket 📜
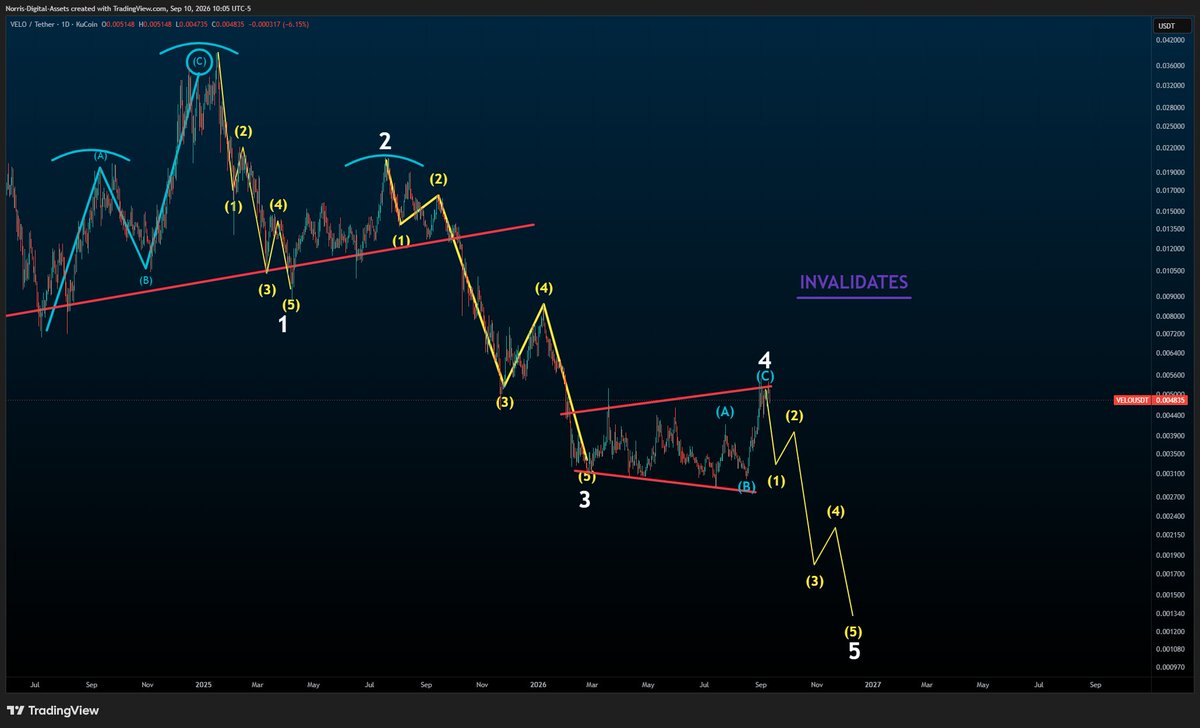
velo:native 1D
THE BULLISH SETUP
Hold: $0.003 (last low)
Trigger: Begins 5 new bullish waves
Wave count invalidates: White 4 crosses white 1 (purple line)
Void: New lows
If void: Daily breakout is wrong, not the coin
THE BAG
Add: DCA, or when 5 subwaves form into white 5
Hold: From white 5 for massive expansion UP
Thesis: Setting up for macro reversal
Target: 10-100x (later)
Notes: White 4 can still go higher first. I was estimating this wave 4 ahead of time.
🚨 THEY DON’T WANT THIS PUBLIC, SO I’M POSTING IT.
What you’re looking at in this image is HOW THE GAME IS ACTUALLY PLAYED.
Insiders don’t care about RSI, MACD, or whatever indicator is trending this week.
They care about WHERE LIQUIDITY SITS, WHO’S TRAPPED, AND HOW TO FORCE REACTIONS.
Retail looks at a chart and sees chaos.
Institutions see the SAME STRUCTURES REPEATING OVER AND OVER:
- QML setups
- Fakeouts and liquidity grabs
- Demand and supply flips
- Compression into expansion
- Stop hunts disguised as breakouts
- Flag limits
- Reversal structures that repeat cycle after cycle
NONE OF THIS IS ACCIDENTAL.
Every pattern on that chart exists for one reason:
TO MOVE PRICE INTO AREAS WHERE ORDERS ARE STACKED.
Once you understand that, a lot of things stop hurting you.
You stop chasing green candles. You stop panic-selling red ones. You stop getting liquidated on moves that felt “random.”
This is why MOST TRADERS LOSE.
They react to price instead of understanding WHY PRICE IS MOVING.
The people who survive this market spend years studying charts like this until it finally clicks.
After that, the market feels SLOWER, CLEARER, AND FAR LESS EMOTIONAL.
Save this tweet. Study it.
If you can learn to read WHAT INSTITUTIONS ARE DOING instead of guessing what comes next, you’re already ahead of 99.9% OF PEOPLE HERE.
Remember: I’ve been trading markets for 20+ years.
I’ve seen every kind of bubble, crash and liquidation.
I only care about the moves that matter.
When the next one comes, my followers will see it first.
Follow and turn notifications on.
You won’t get a second warning.