I keep things pretty simple when I trade.
• Start with identifying overall trend (on a weekly chart)
• Look for strong context and key levels
• Wait for price to tighten up
• Execute with a clear plan and defined risk
Then just rinse and repeat.
I’m not here to call every move - just waiting for spots where a move looks ready to happen.
This is how I approach every setup.
I’ll be sharing my trades, ideas, and thought process in real time.
Follow if you want to learn how to spot high-quality setups for yourself.
$HOOD follow-up
There it is.
Strong move through the trendline triggered the buy opportunity I’ve been waiting for.
Price confirmed. I’m in.
Now let’s see what this breakout has in it. 🎯
$HOOD +11% today and pushing right into the weekly trendline. Huge move.
But what if I told you the biggest move may still be ahead?
A clean break of this trendline would clear a major level that’s been intact since the highs.
$CVNA
Something is brewing here. 👀
Months of compression while momentum quietly resets.
RSI back to neutral. MACD histogram starting to pick up.
Price retesting two points of confluence:
- Trendline
- EMA Clouds
High watch.
$SMCI
Called the setup. Took the trade.
Stock: +8%
Calls: +145%
This is why I study charts every single day.
You can learn to spot these opportunities too. 🎯
$SMCI
Quietly setting up nicely on the weekly.
Momentum has reset and price is pulling back into the EMA clouds.
I like it here for a move toward the trendline.
But a strong close ABOVE that trendline?
That’s where this setup gets really interesting. 👀
$CVNA
Something is brewing here. 👀
Months of compression while momentum quietly resets.
RSI back to neutral. MACD histogram starting to pick up.
Price retesting two points of confluence:
- Trendline
- EMA Clouds
High watch.
$SMCI
Quietly setting up nicely on the weekly.
Momentum has reset and price is pulling back into the EMA clouds.
I like it here for a move toward the trendline.
But a strong close ABOVE that trendline?
That’s where this setup gets really interesting. 👀
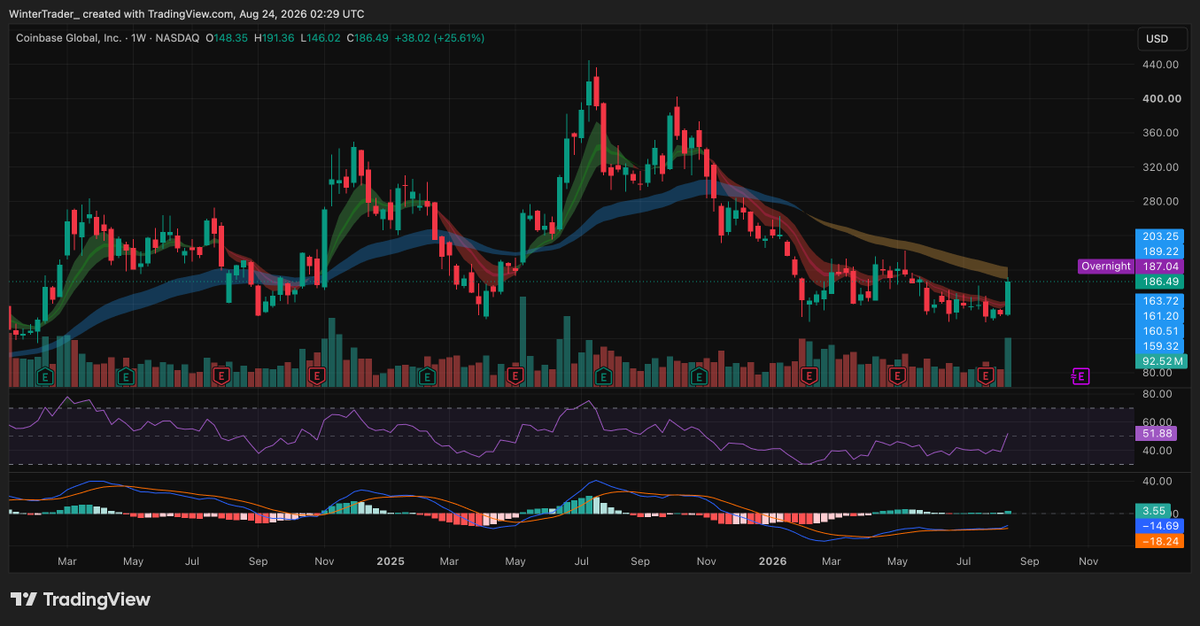
$COIN
Respecting that overhead EMA resistance almost perfectly.
Exactly why I wanted to see a bullish cloud flip before getting interested.
Needs more time IMO. Let the setup develop.
$COIN
Strong week, but it still has work to do.
Momentum is improving, but price is running directly into the weekly EMA clouds.
I want to see $COIN reclaim the clouds and flip them bullish before this becomes a swing I’m interested in.
Until then, I’m watching.
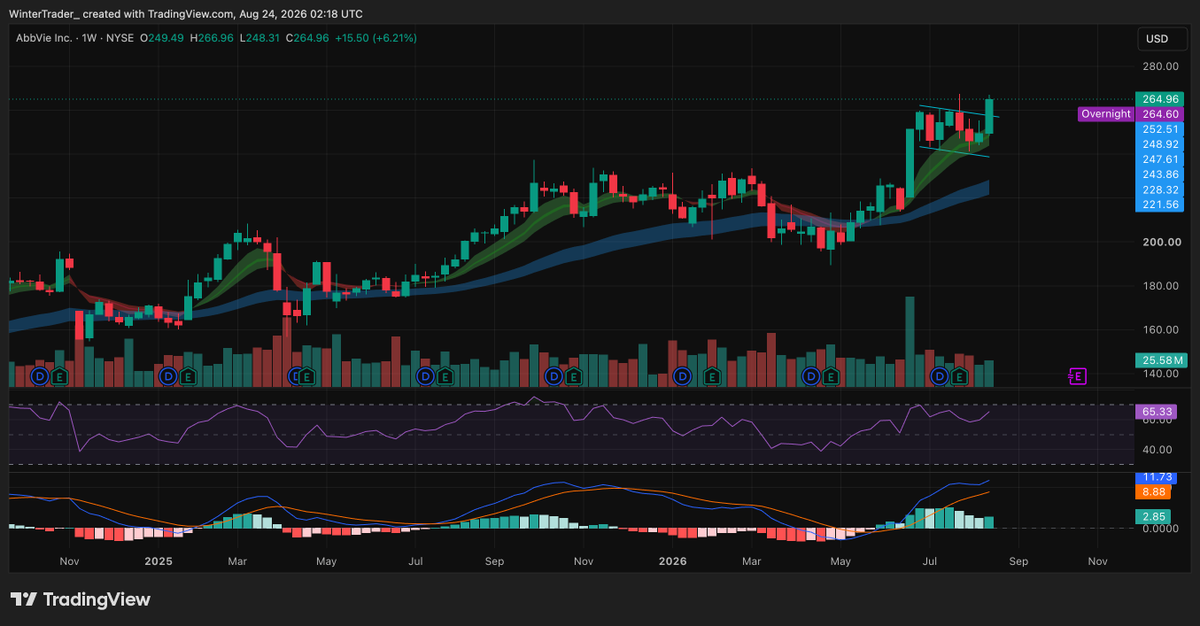
Update: $ABBV
There’s the breakout.
Clean move through the weekly bull flag with momentum following through.
Bullish continuation doing exactly what you want to see.
$UBER
This setup has my attention.
Bullish divergence on both RSI + MACD, price breaking out of the weekly flag, and momentum starting to turn.
Now I want the final piece - a weekly close above the EMA clouds.
I’ve seen this same divergence setup precede some massive moves lately.
How I made 86% on $HOOD in ~10 minutes.
HOOD gapped hard out of the open. Volatility creates opportunity, but chasing it is how you get burned.
My plan was simple: wait for the reaction at two levels of confluence:
• $100 psychological level
• Previous day’s high
Price held both → I entered.
Risk was simple: close below $100.
From there, HOOD ripped ~$7 and I sold into the first touch of the major trendline for +86%.
Could it keep running? Absolutely.
But 86% in 10 minutes is a win I’ll take every time.
If the trendline breaks and confirms, I can always get back in.
You don’t have to catch the entire move. Have a plan, take your piece, and move on.
$COIN
Strong week, but it still has work to do.
Momentum is improving, but price is running directly into the weekly EMA clouds.
I want to see $COIN reclaim the clouds and flip them bullish before this becomes a swing I’m interested in.
Until then, I’m watching.
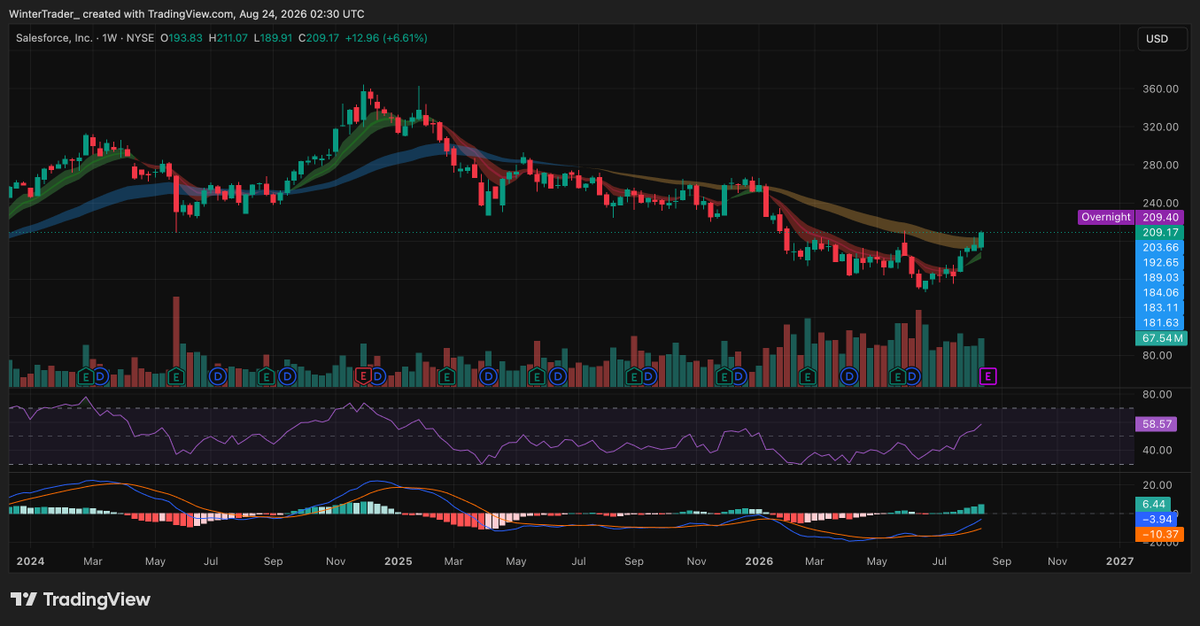
$CRM
This has built a solid case for bullish continuation.
Price is breaking through the EMA clouds with momentum expanding behind it.
After a move like this, I’m not chasing strength.
I’m watching closely for a pullback/retest that holds and gives me a cleaner entry.
$DELL
Pulling back to retest the prior consolidation zone after breaking out.
This is an area I want to see buyers defend.
On high watch this week to see what price tells us next.
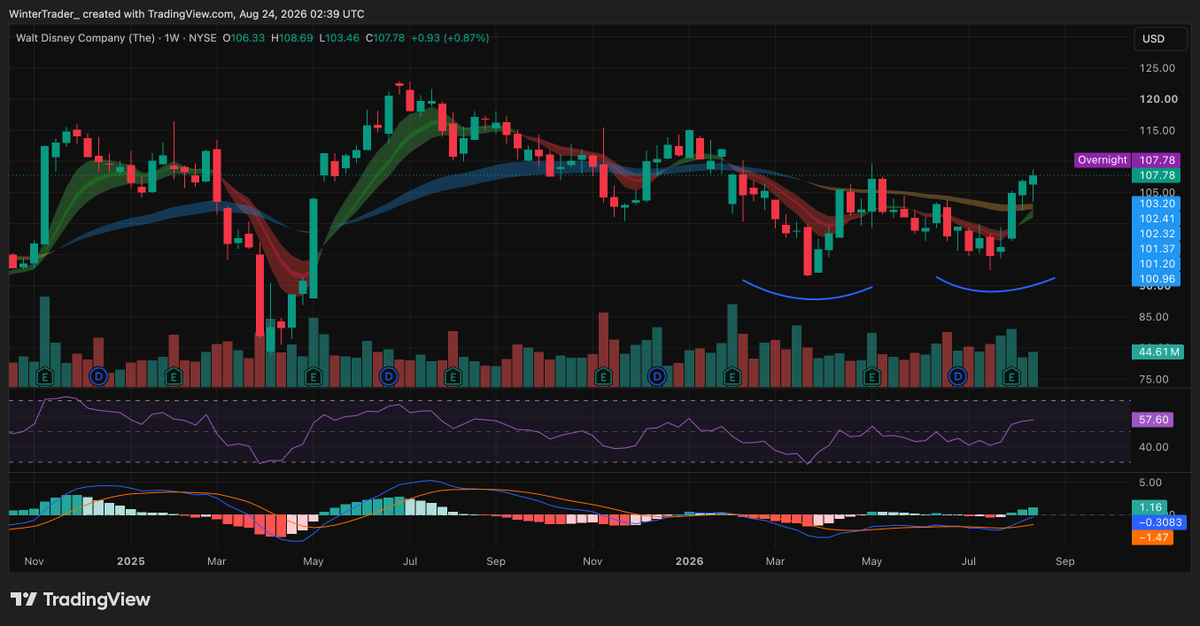
$DIS
Double bottom breakout starting to take shape.
$108 is the level.
Give me a close above it for confirmation and I’m interested in taking this trade.
Setup is there. Now I want price to confirm it.
$IBKR
+94% since the original post.
Trendline broke. Price confirmed. The move followed.
No crystal ball. Just studying charts, identifying opportunities, and staying consistent.
This is the process.