#NQ#NASDAQ#나스닥
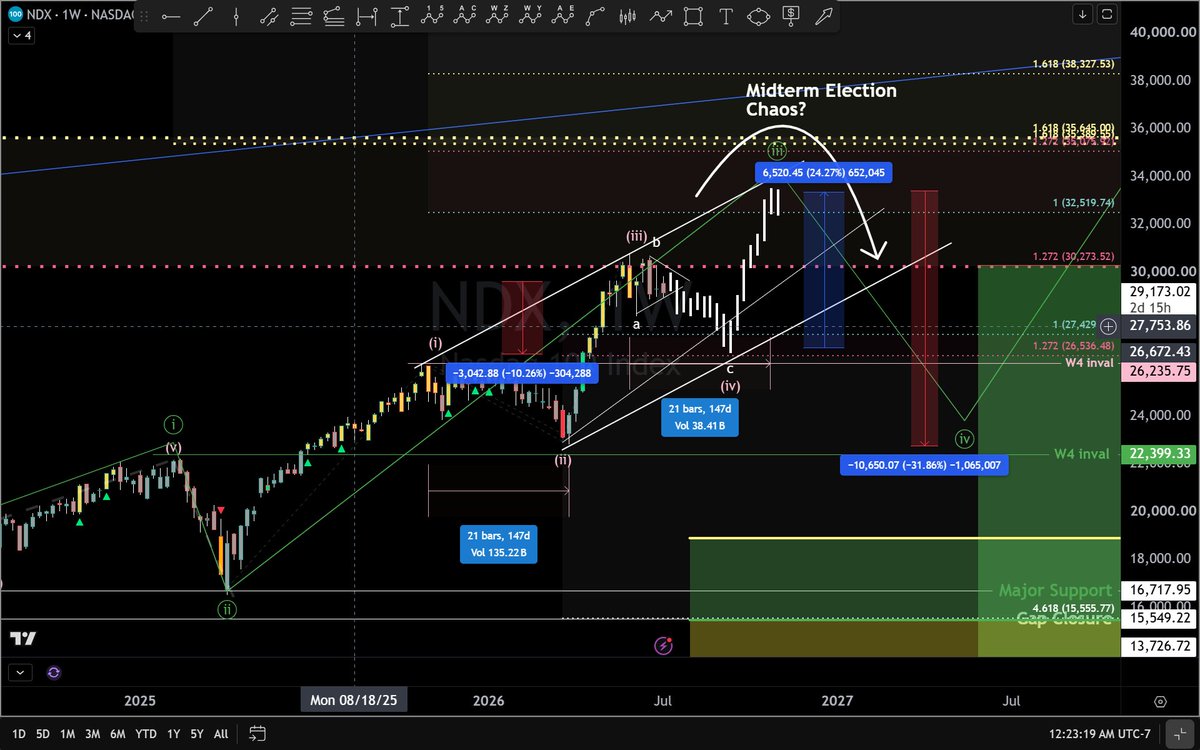
라지 사이즈 B파 30,094 (삼각형 E파) 완료
현재 C-(1) 임펄스 웨이브 마감완료의 대한 분석 중이다
오늘 내일 중 C-(2) 웨이브 반등(조정) 파동예상
저항은 되돌림 값 38.2% (29,360)~65% (29,680)
C-(1)임펄스라면 C-(2) 되돌림은 65%를 넘지 않고
C-(3)으로 큰 하락오는것이 가장 좋다
#SPX is replicating a Megaphone pattern similar to September - November 2025. Both started below the 1D MA200, made +20.50% rallies, then first pull-back to the 1D MA50 and now we are in the process of the 2nd Bearish towards the 1D MA100.
Based on that, $SPX should test the 1D MA100 around 7150.
Full description on our Telegram channel:
👉https://t.co/ZkitbM3KKr
LIKE 👍, FOLLOW ✅, SHARE 🙌 and COMMENT ✍ if you enjoy this analysis!
Indecision
#SPX#Nasdaq remain range-bound within a near-term triangle consolidation. While there are enough waves to complete the broader rally, the lack of downside follow-through continues to warn of a bullish continuation. The two key levels shown on the chart (top two pink lines) continue to separate the near-term bull and bear scenarios.
#TYX #TLT remain range-bound within a triangle consolidation.
#DXY structure remains bullish as we look for downside continuation in the #Euro.
#Bitcoin bear trend exhausted? Potential bull setup.
🚨 NOBODY IS TALKING ABOUT THIS!
Based on my $SPX chart, here's my 2026-2027 plan:
1. Pullback to 7,250 → rally to 7,800
2. Creek formation → 2-3 months of downside
3. Drop to 6,150 + Spring formation
4. Recovery phase → rally toward 8,300 by late 2027
Don’t be exit liquidity - turn on notifs, I’ll update
This isn't my expectation, but it's hard to ignore how closely this $SPY dotcom analog is tracking, especially if markets pull back over the next few weeks.
Why will Bitcoin RALLY - and then CRASH?
Bitcoin is a USD (DXY)-story. When DXY drops - BTC rallies.
And the DXY is a EURUSD-story. This pair defines the direction of DXY (being 57.6% of the DXY-basket).
BTC has rallied into the spikes in the EURUSD since the beginning of BTC.
See - the long-term chart EURUSD is very clear.
One more SPIKE into the Wedge - before strong reversal and Crash in this pair.
Translated into BTC. Strong rally/bounce - before BTC gets absolutely Crushed under the weight of the USD wrecking Ball as the Deflationary Bust develops.
That is the reason for my BTC Outlook.
Bitcoin possess NO FUNDAMENTAL VALE what-so-ever!
Now watch the BTC Rally setting off soon!
.
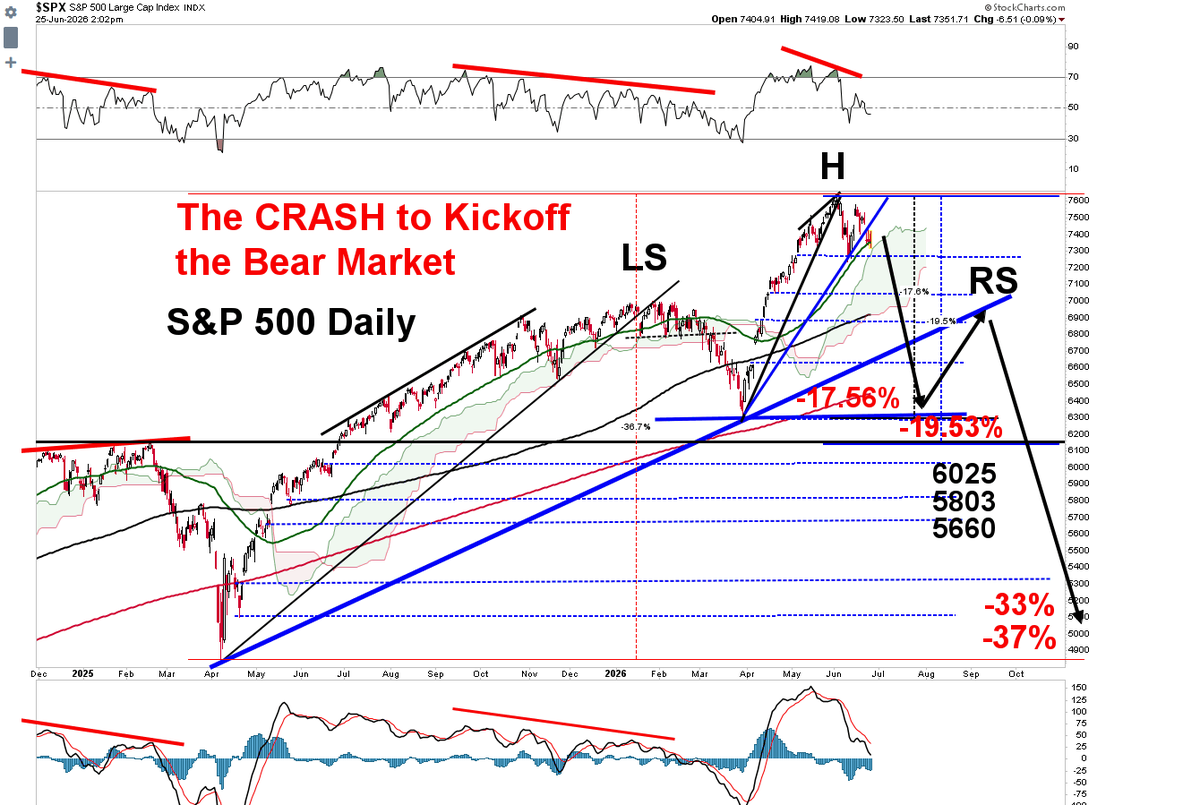
SUMMER SELLOFF & CRASH INTO THE MIDTERM ELECTIONS
There will be a summer selloff as the AI Bubble pops. The stock market will crash into the midterm elections. The decision to crash the stock market ahead of the midterm elections has already been made by the market bosses and there is absolutely nothing you can do about it. The Fed will likely panic at some point before the mid-term elections & start jumbo rate cuts.
A Head & Shoulders Top could be under construction ahead of the midterm elections. The stock market has to crash by 20% or more in order for the Fed to panic and start jumbo rate cuts. The S&P 500 (below) could crash to the March low and then rally and backtest the broken trendline from the April low for a possible right shoulder. If the pattern completes, SPX would resume the selloff to the April low. We are overdue for a crash and it is likely going to start here in the summer ahead of the midterm elections.
.
$SPX $SPY $QQQ $NDX #Stockmarket #SP500 $DJIA $IWM #A️️️️️️️️️️️️️️️️️️️️️️️️️️️️️️️️️️️️️️️️I
NASDAQ 📊
Like it or not, that gap lower is closing in biblical fashion.
That is the post.
God bless and godspeed.
Yours truly,
The Great Martis💫
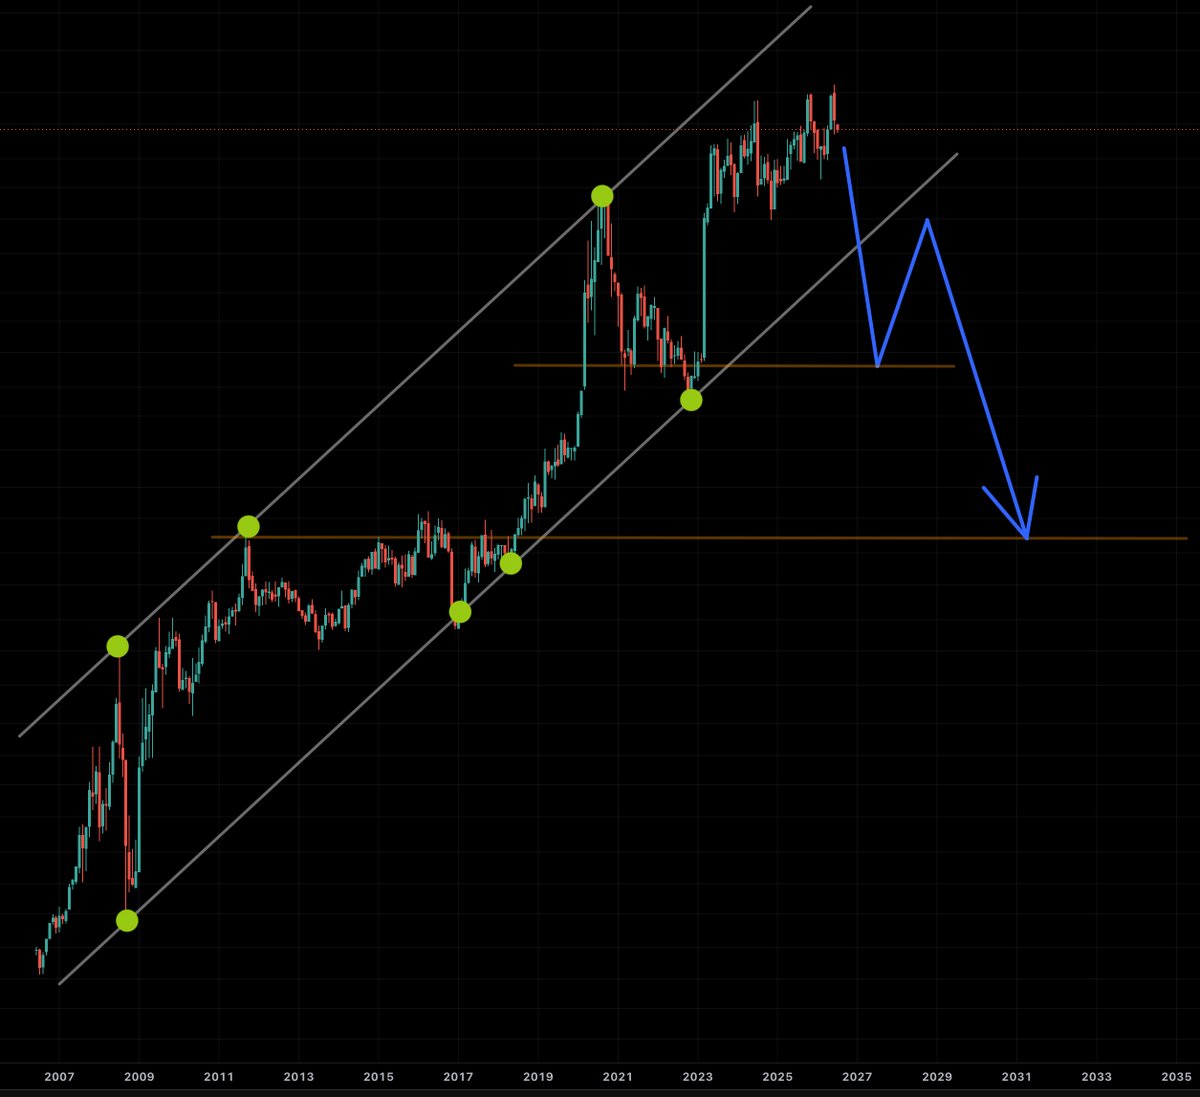
She's beautiful. (Broadening pattern)
.
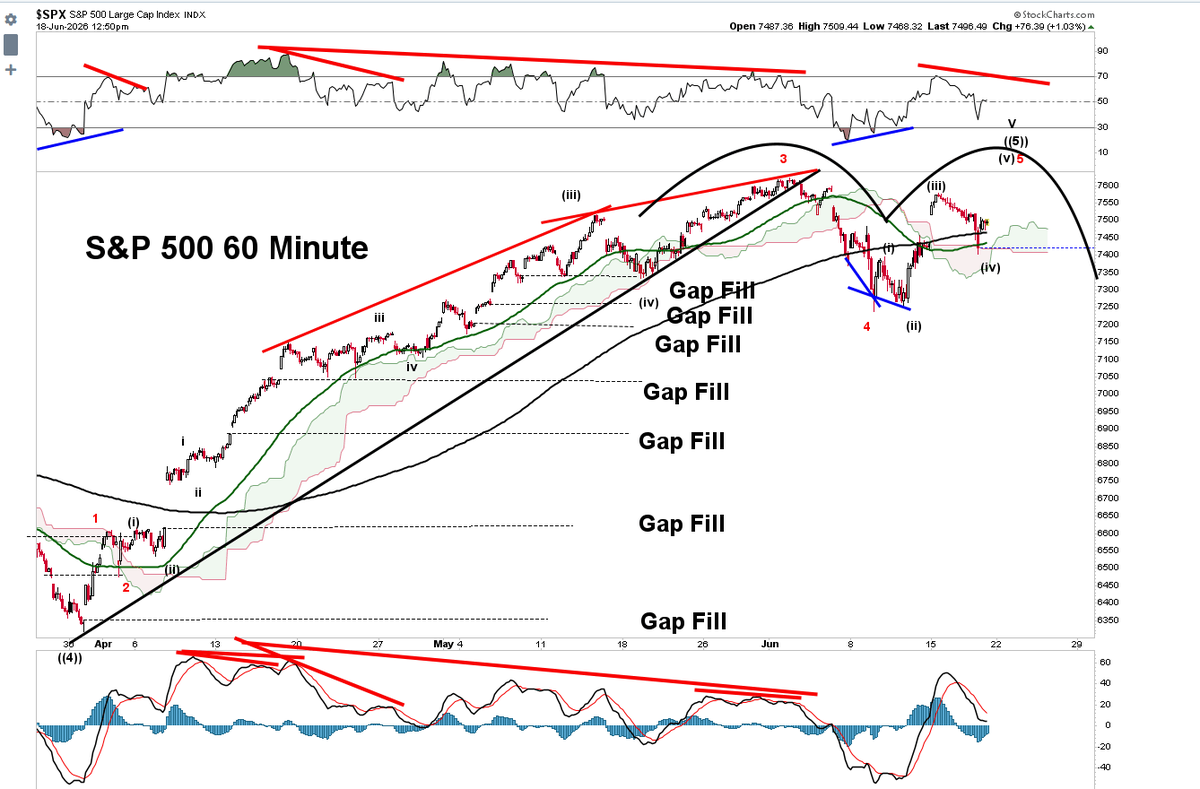
S&P 500 Elliott Wave Update
Scenario #1
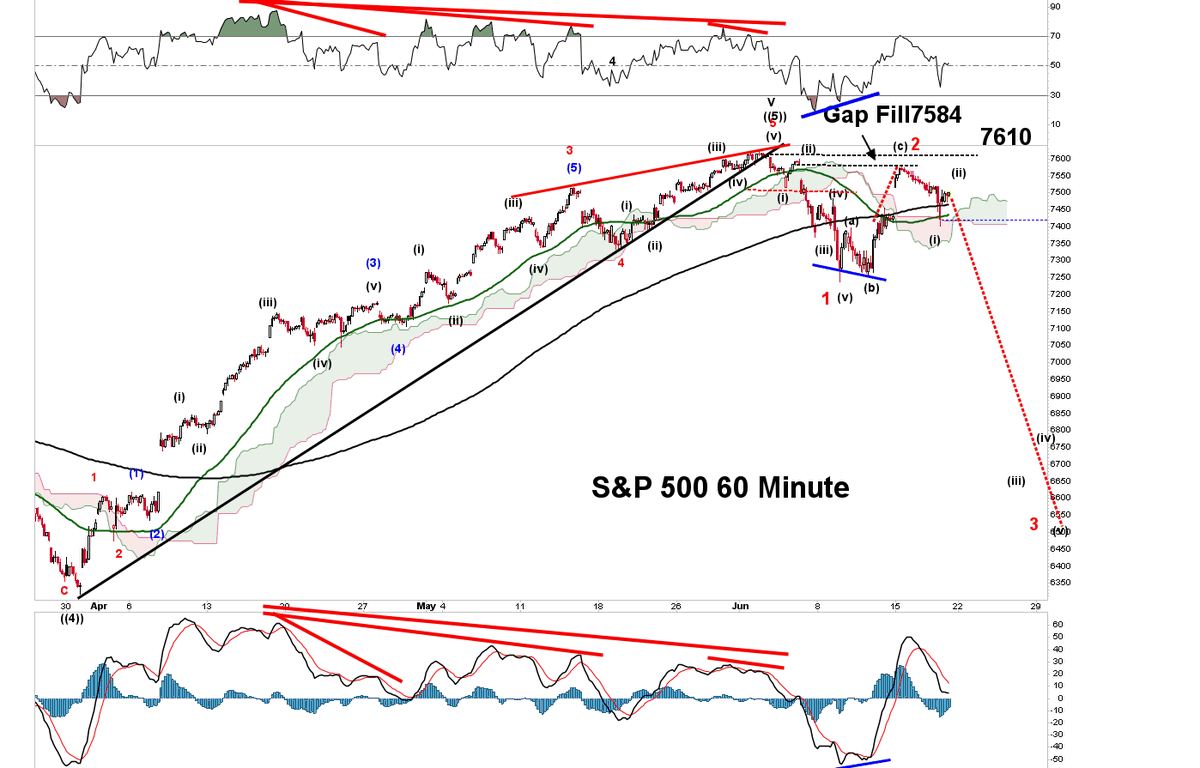
Below are both the bullish and bearish EW counts for SPX. The first charts shows the lower high scenario, that assumes the 5 leg push higher is done and that SPX has start wave 1 & 2 down of a larger 1st wave down. This would form a lower high. This scenario suggest SPX is already in crash wave 3 of the 1st wave down.
Scenario #2
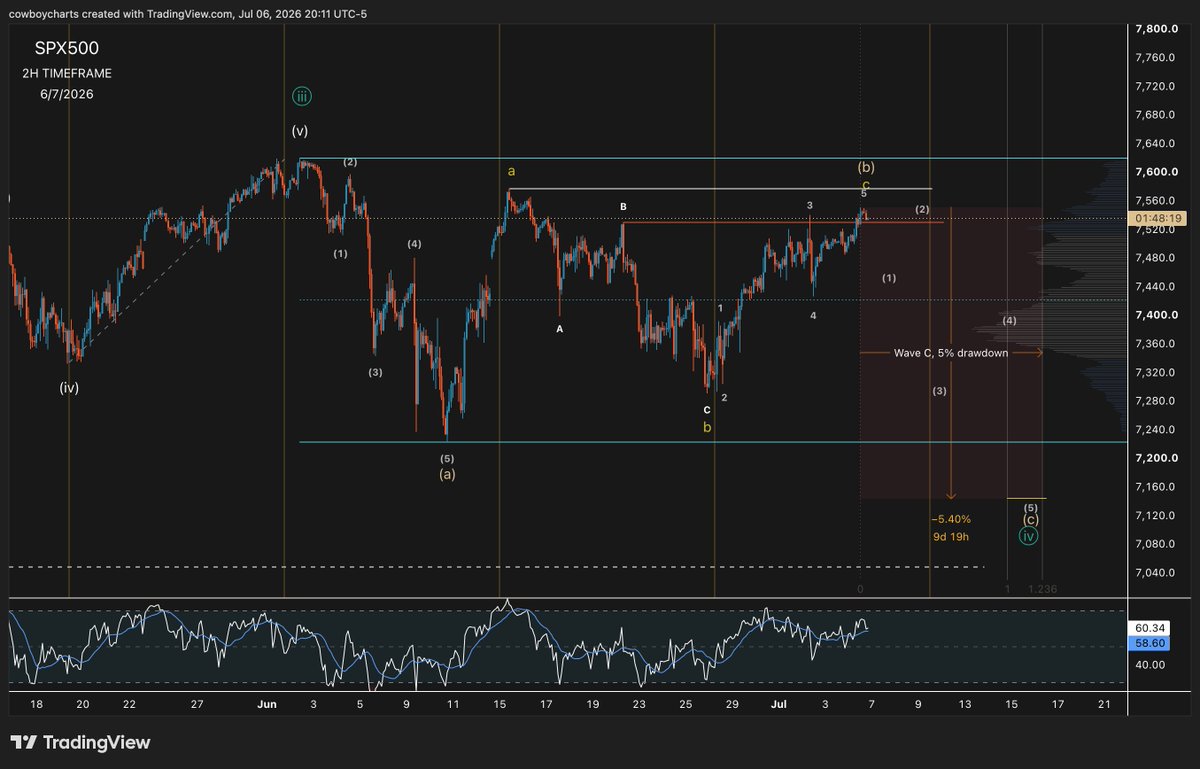
The bullish scenario shows the 5 leg push higher isn't done yet and that the recent 5% selloff as wave 4 and that SPX is now in wave 5 to finish the count. This would form a Double Top pattern with a higher high, that would likely slam into major resistance in the weekly timeframe once again.
Elliott Wave is speculation and use to determine price by the process of elimination. Counts will be invalidated as impulsive and corrective waves unfold.
$SPX $SPY $QQQ $NDX #Elliottwave #SP500
#DAX is forming a pattern identical to the 2018 Bear Cycle. Following the March rebound on its 1W MA100, the market has failed to break above its ATH Resistance.
The longer it fails to do so, the more likely to drop again and test at least its 1W MA100 again at around 22800.
If it closes a 1W candle below the 1W MA100 even, $DAX is likely to make a 1W MA200 test as well towards the end of the year at around 20000.
Full description on our Telegram channel:
👉https://t.co/YYuY4vakxU
LIKE 👍, FOLLOW ✅, SHARE 🙌 and COMMENT ✍ if you enjoy this analysis!
#stockmarket #trading