Dubioser #Crypto Spekulant und angehender #Jurist⚖️💰 für DE und die EU🇩🇪🇪🇺| concordia parvae res crescunt, discordia maximae dilabuntur | retar dio | ZMP !
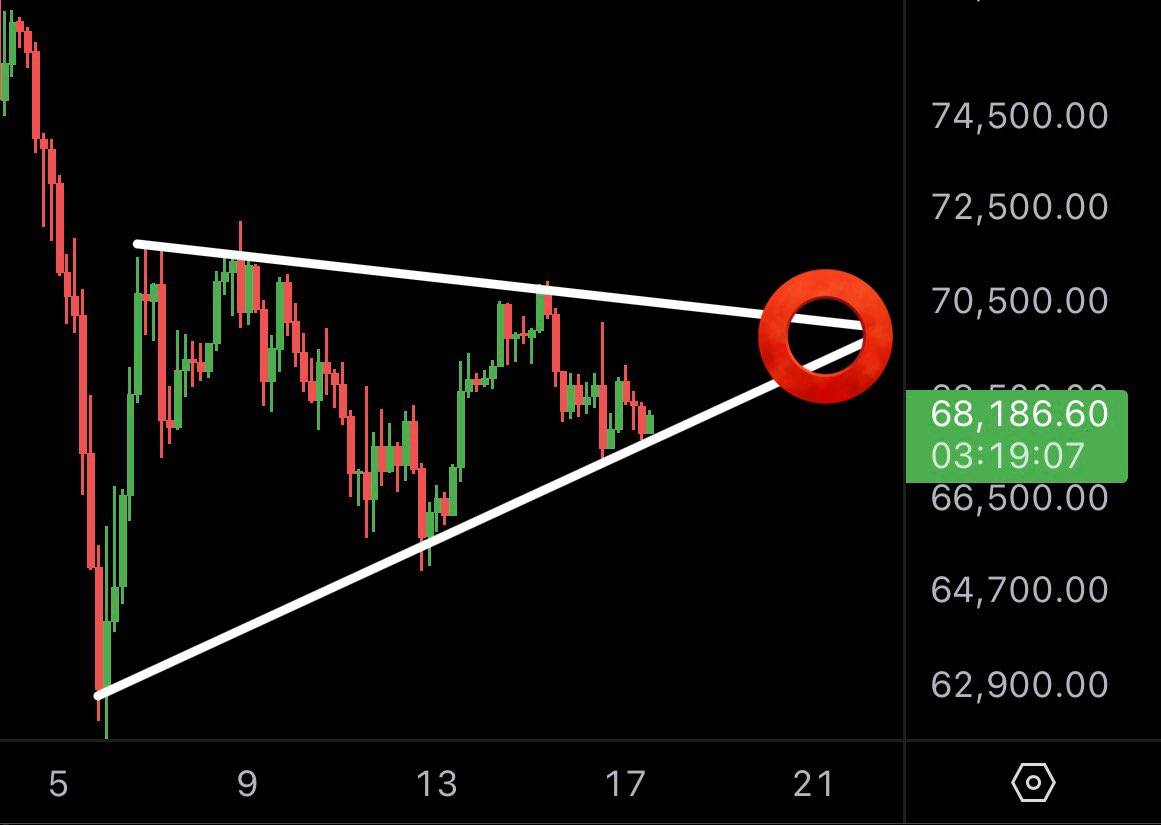
Almost there.
The hardest part of every cycle isn't buying.
It's having the patience to let the process play out.
If history rhymes, the next major opportunity may not be far away.
$BTC #Bitcoin
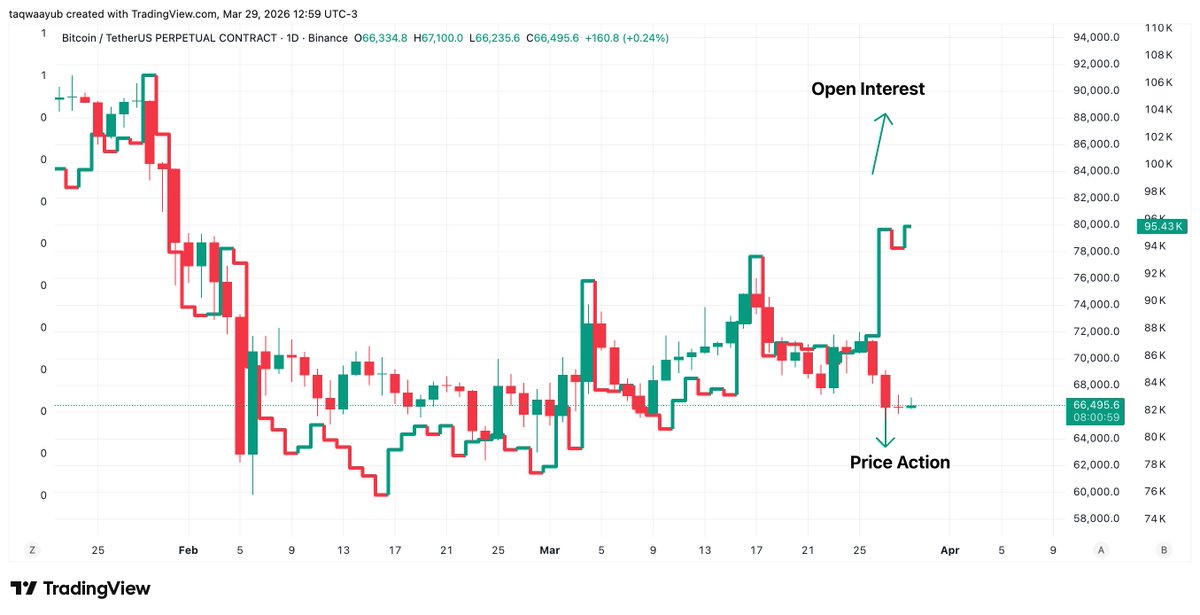
If you’re still ignoring Open Interest (OI), the market is already one step ahead of you.
Not the definition but how to read it with price.
Bookmark & Retweet this
Price going up + OI increasing →
New money entering = aggressive buyers
Bullish
Price going down + OI increasing →
New money entering = aggressive shorts
Downtrend likely continues
Simple.
Now look at the $BTC chart,
OI is continuously rising
while price is going down.
So tell me…
Are you still trying to buy the dip here?
$ETH
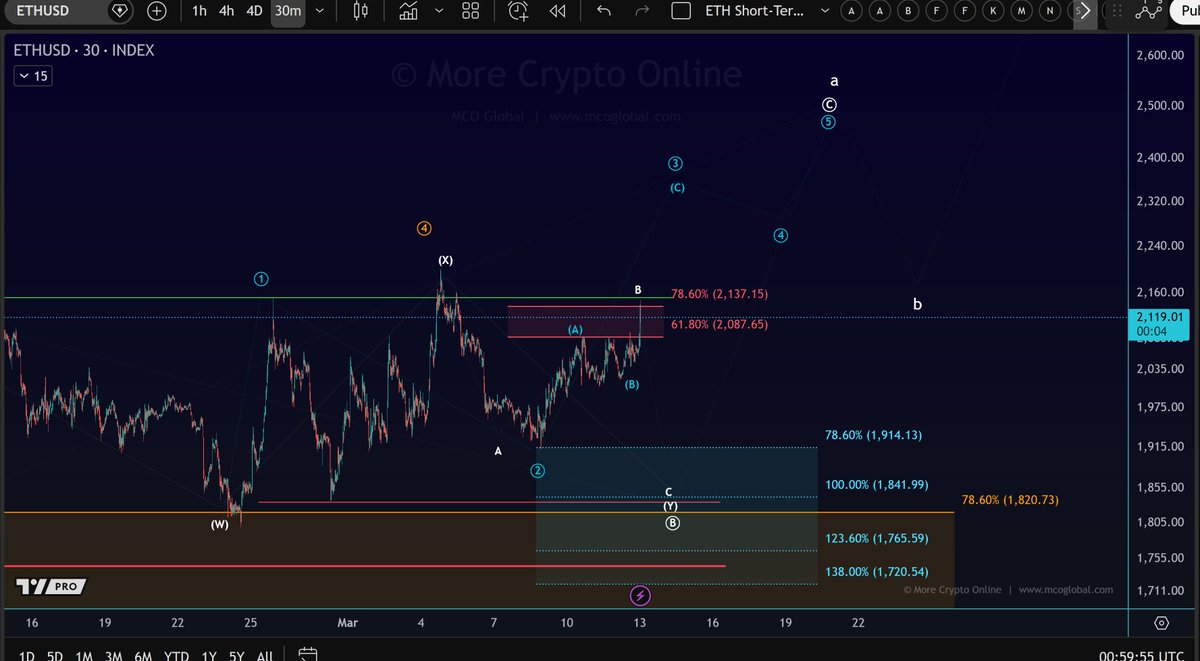
Price is trading in a technically sensitive area following the recent liquidation event end of January. That alone makes it worth watching, but it does not automatically shift the outlook to bullish.
We did see a bounce yesterday, which could suggest that Ethereum is transitioning into the next phase of the B-wave rebound we have been anticipating throughout February. However, the structure so far still appears corrective in nature. There is no clear impulsive expansion and no confirmed structural break that would signal a sustainable low.
Ethereum also continues to lag behind Bitcoin. The ETH/BTC pair remains in a downtrend, highlighting relative weakness. In stronger market environments, ETH tends to outperform. At the moment, it is clearly not doing so.
Even if price extends higher from here, the base case would still be that this is part of a larger B-wave. And B-waves are known for being deceptive. They can be fast, sharp and convincing, often creating the impression that a new uptrend has begun, only to fully retrace and resume the prior decline.
Unless we see a clean 5-wave move to the upside or a decisive break above the weekend high, the scenario that allows for additional downside remains the more probable path.
The focus remains on the developing micro structure.
#Ethereum
$ADA: The price has reached the descending trendline, a break above this level would likely trigger a wave-3 to the upside. Ideally, reaching at least the 1.38 Fib level at $0.357.
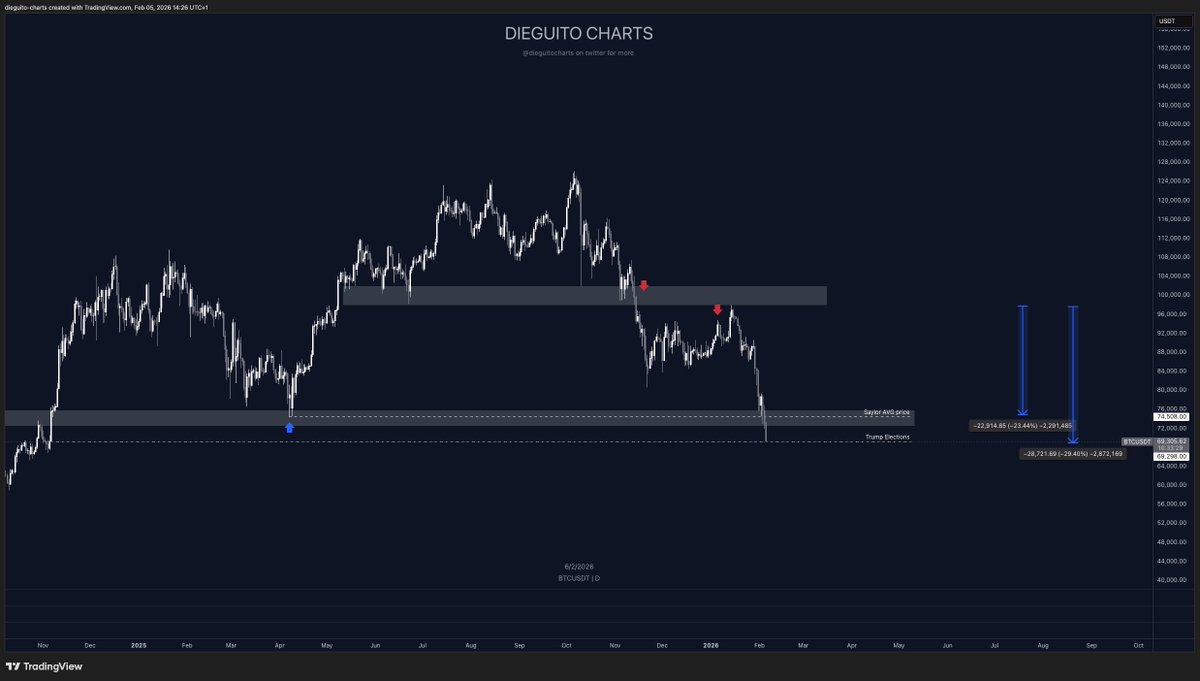
$BTC Finally reached the level we gave months ago.
Trump election bottom ✅
Now if we reclaim the box this looks good, otherwise we don't have anything till low 60's🩸
Personally accumulating SPOT and DCAing since low 70's, after selling all my spot at 116k.
some $BTC update:
HTF bottom is close, maybe 68/69 wick then we go back up in 90’s for a relief rally for some time, also tag 100’s
macro bottom still needs time, looking for 55/58k to be macro bottom by next year
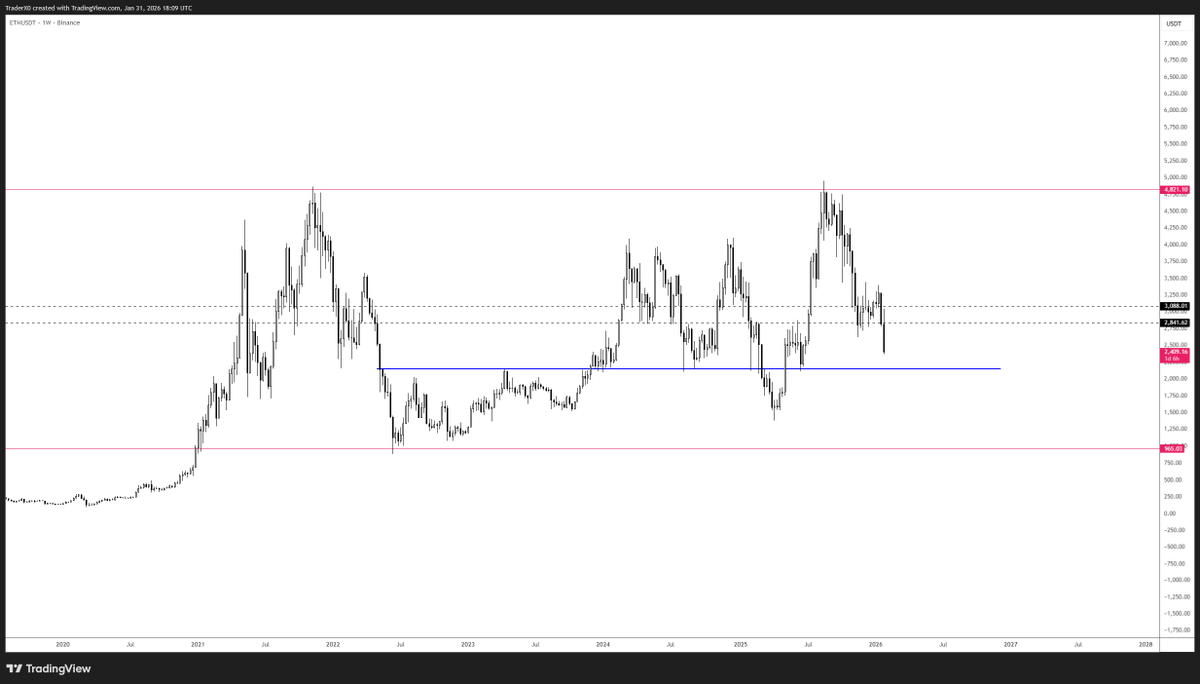
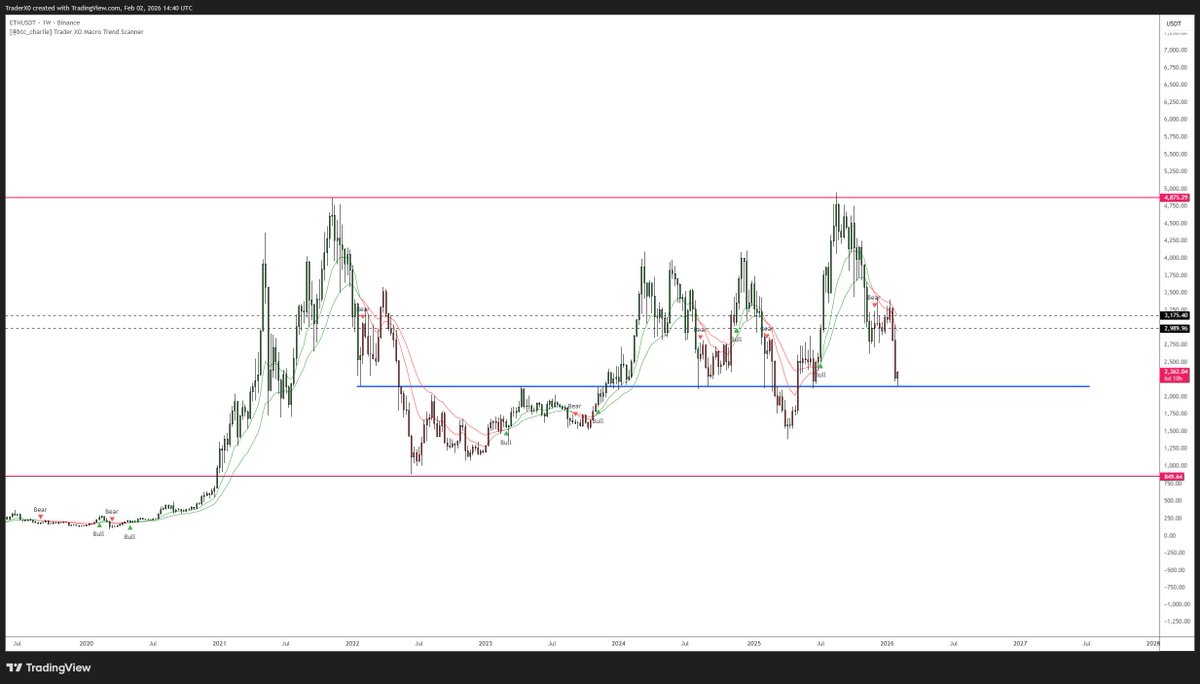
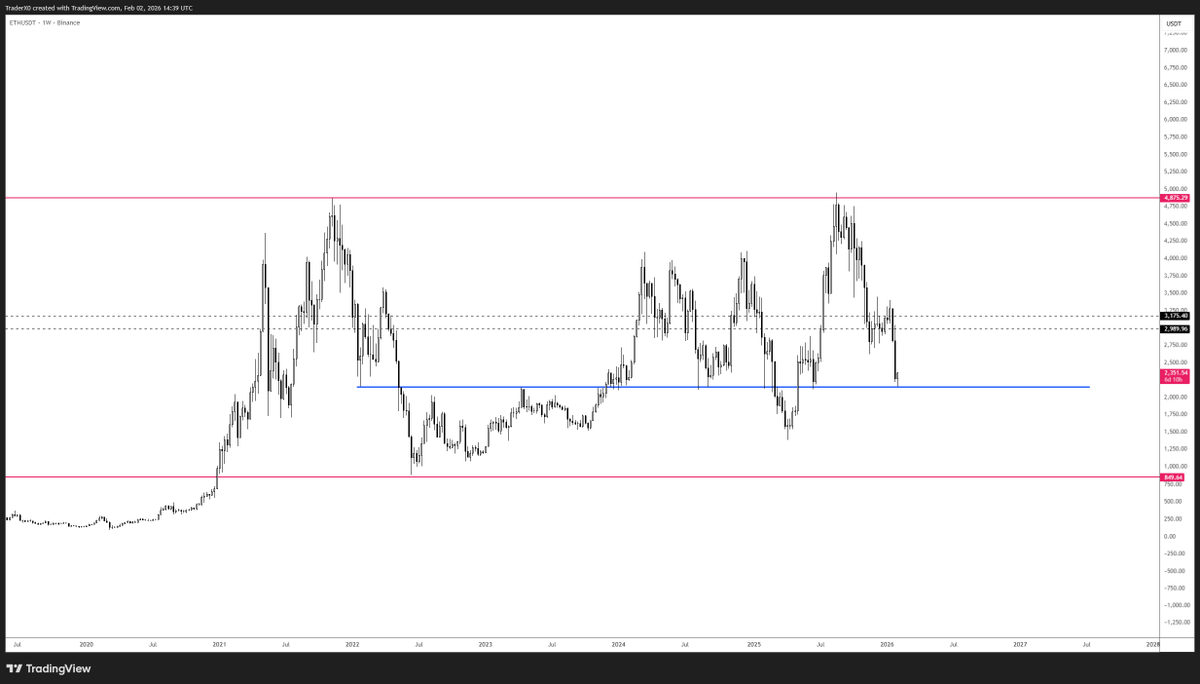
$ETH
Sorry what was that again? blue line?
I'd like to think were close to significant enough low around here for a mean reversion into the daily bands.
Cheers