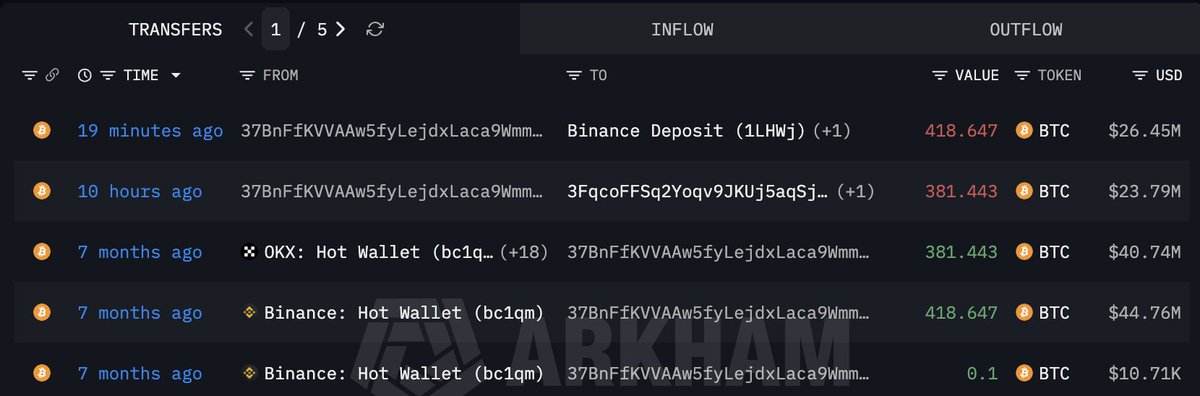
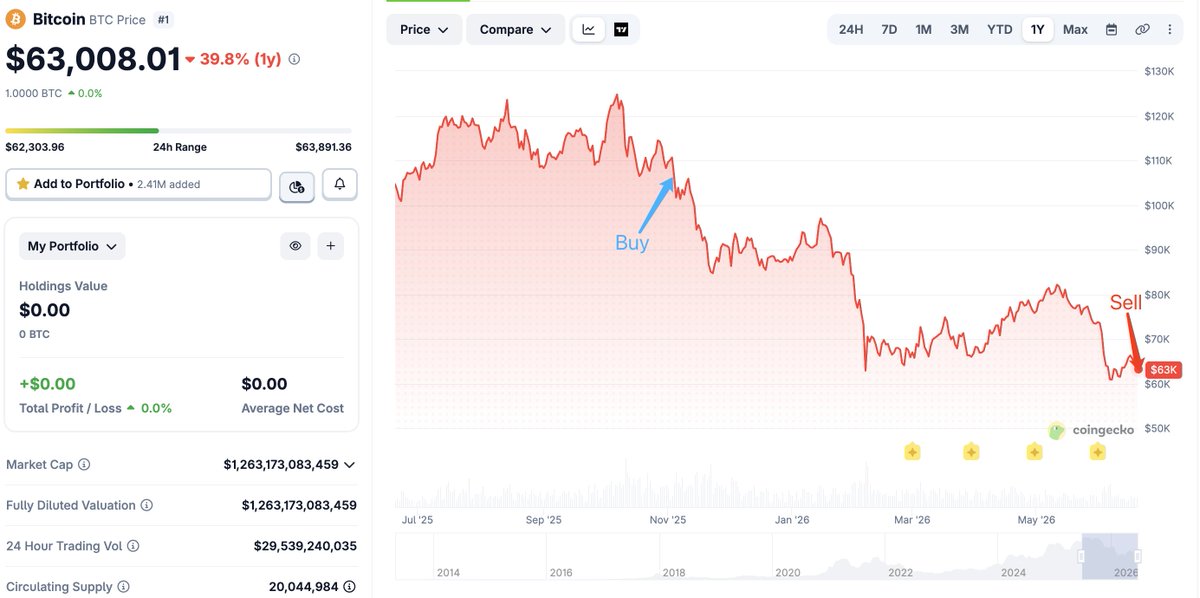
After holding $BTC for 7 months, whale 37BnFf finally gave up.
Today, he sold 800 $BTC($50.24M) that he bought at $106,866 7 months ago, taking a $35.3M loss.
https://t.co/W2srdqT7FI
This is true.
There is no question or doubting that Groks original $Byte is the one on ETH.
The other, is cabal bundled crap trying to extract from a narrative they know will dole out numbers.
Original OG byte as per Groks message:
0xdE342A3E269056fc3305f9e315F4C40D917BA521
@ByteDogToken
Wynn
Stop Chasing the Market. Let the Alpha Find You. 🔍
Are you still manually clicking through 500+ charts on TradingView looking for a breakout? While you’re hunting, the smart money has already entered.
altFINS is the only professional-grade screener that automates the "discovery" phase of your workflow. We don’t just give you data; we give you the Setup.
✅ AI Pattern Recognition: 26+ patterns (Wedges, Triangles, Channels) with up to 80% Profit Potential.
✅ Custom Technical Scans: Combine RSI, MACD, and On-Chain metrics (TVL, Revenue) to find 10x gems before they hit the headlines.
✅120 pre-set filters for 2000+ altcoins
✅ VIP Insights: Get the "Why" behind the moves. Join our inner circle.
Let altFINS automated screener and AI Copilot help you find the best traders in seconds.
Efficiency is the only edge you can control.
👉 Start scanning for free on https://t.co/PPCqVoDNJZ
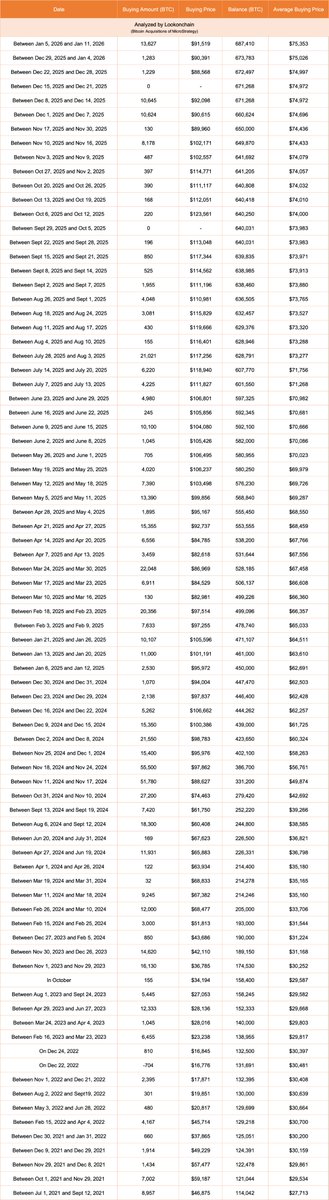
Michael Saylor(@saylor)'s @Strategy bought another 13,627 $BTC($1.25B) at $91,519 last week.
Strategy now holds 687,410 $BTC($62.36B), with an average buying price of $75,353, sitting on an unrealized profit of $10.56B(+20%).
https://t.co/WEClvjYROp
10% Technical Analysis
50% Fundamentals
40% Psychology & Risk Management
Charts help you time entries.
Fundamentals tell you what to hold and why.
Psychology decides whether you survive long enough to win.
You can have the best setup in the world —
but without conviction, patience, and risk control,
the market will take it back.
Analysis finds opportunity.
Discipline captures it.
Most traders fail not because they’re wrong —
but because they can’t hold, wait, or cut.
Less noise.
More conviction.
Trade like a Wizard.
Even during market downturns, stories of overnight riches continue to emerge.
Trader BxNU5a turned $180K into $3.6M in less than 2 months, a 20x return.
He spent $180K to buy 8.16M $pippin on Oct 24 and is still holding — now valued at $3.6M.
https://t.co/cXwqW7fr9y
MOVING AVERAGES STRATEGY:
1. Understand the Basics What is a Moving Average (MA)?
A moving average smooths price data to identify trends. Types:
Simple MA (SMA) and Exponential MA (EMA).
2. Types of Moving Averages Simple Moving Average (SMA): Average prices over a specific time. Less responsive to recent price changes.
Exponential Moving Average (EMA): Gives more weight to recent prices. More sensitive to short-term price movement.
3. Common Time Periods Short-Term: 5, 10, 20-day MAs Medium-Term: 50-day MA Long-Term: 100-day, 200-day MA
4. Key Strategies
a) Golden Cross 50-day MA crosses above 200-day MA → Bullish signal (Buy)
b) Death Cross 50-day MA crosses below 200-day MA → Bearish signal (Sell)
c) MA Crossover Strategy Buy when short-term MA crosses above long-term MA.
Sell when short-term MA crosses below long-term MA.
d) Support & Resistance MAs act as dynamic support during uptrends and resistance during downtrends.
e) Trend Confirmation Price above MA = Uptrend Price below MA = Downtrend
5. Advanced Techniques Double/Triple MA Strategies: Use combinations like 20-50-200 EMAs for refined signals.
MA Envelope/Bands: Measure volatility by plotting % bands above/below an MA.
Confluence Zones: Look for overlap between MA signals and other indicators like RSI, MACD.
6. Timeframe Considerations Use different MAs based on trading style: Scalping: 5-min or 15-min with 5/20 EMAs Day Trading: 1H to 4H with 20/50/100 MAs Swing/Position Trading: Daily/Weekly charts with 50/200 MAs
7. Risk Management Use stop-loss below moving average. Combine with volume and confirmation indicators. Never rely on MAs alone – avoid false breakouts.
8. Backtesting and Optimization Test different MA periods on historical data. Adjust for asset volatility and trading style.
What Starts A Power Trend?
Low is above the 21 DMA for at-least 10 days
21 DMA is above the 50 day SMA for at least five days
50 day SMA is in an uptrend
Closes up for the day.
What Ends a Power Trend ?
21 DMA Crosses under 50 day SMA.
Close 10% below recent high and below the 50 day SMA.