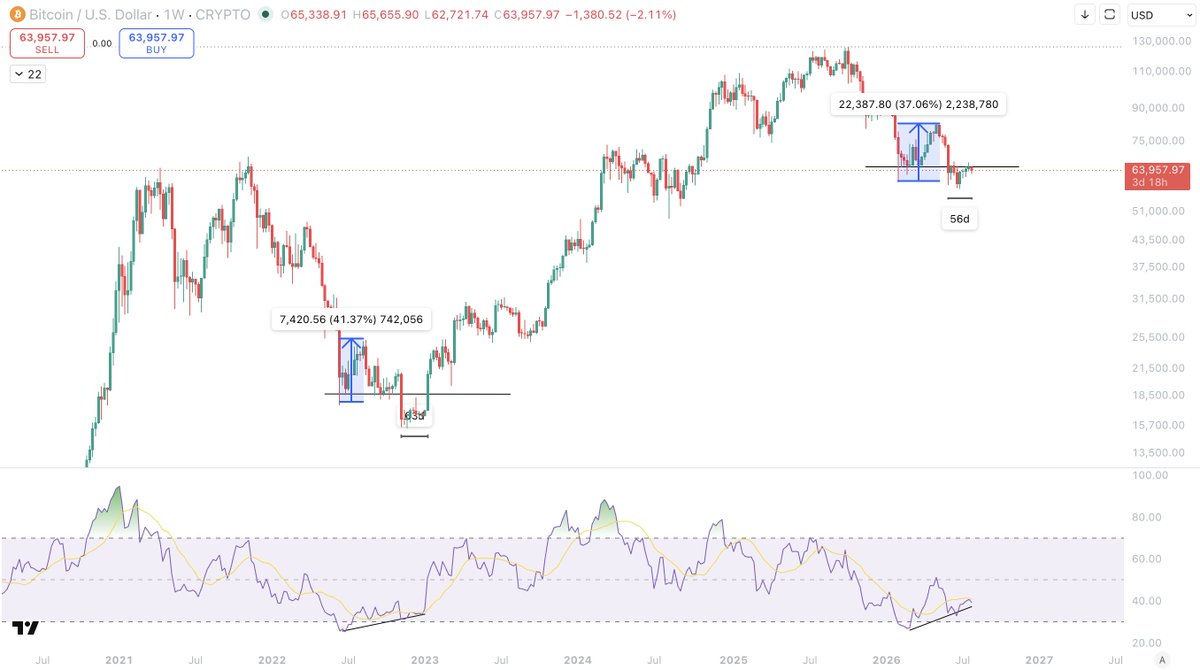
The bottoming formation here continues to follow 2022 very closely.
We have both times:
- Price hitting HTF oversold
- Rallying around 40%
- Price making a new low
- Building a HTF bull divergence
- Price ranging very slowly and very boring for 63 days in 2022
Right now, we have been ranging for 56 days.
Whatever way Bitcoin moves next, its going to happen soon.
And the 63 day period just so happens to be around the deadline for Clarity Act.
One thing to note is that the Bull div this time is actually even greater than 2022. The RSI is stronger than it was back then.
We've never had a situation where the Weekly RSI hits oversold twice in the same correction, and I'm not expecting that to happen here.
Even if we go to the Realised Price, my worst case scenario bottom, I do not think the RSI touches oversold again.
Decision time soon.
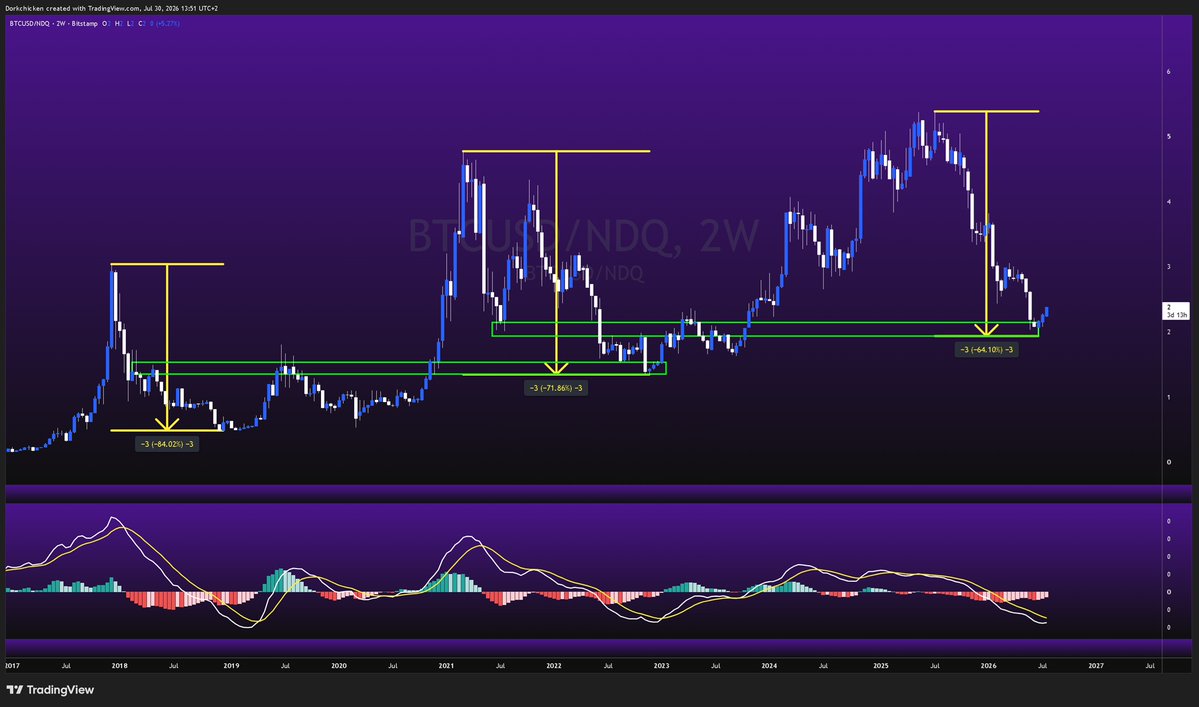
$BTC vs Nasdaq. Drawdowns in every bear market: ‑84%, ‑72%, and ‑64% so far.
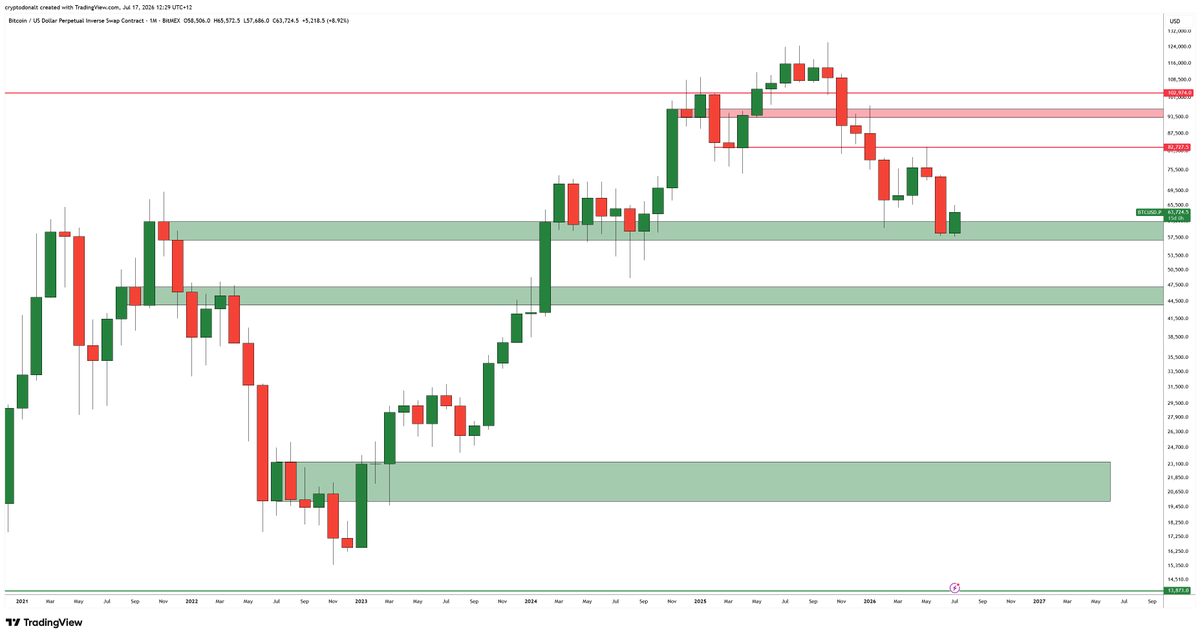
Price has now hit major horizontal support, just like in 2022.
I have said it before and will say it again, crypto will outperform in the coming years.
$SOL This bear has already lasted longer than the last one if $60 was the low.
The bottom structure is strikingly similar. I don’t expect we break $100 anytime soon, but once we do…
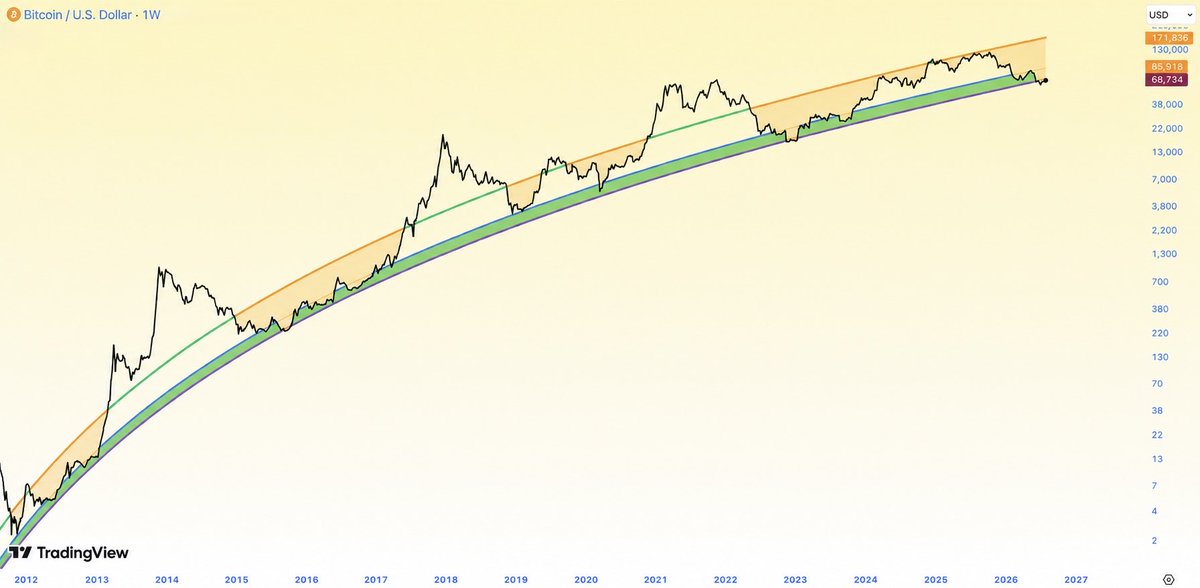
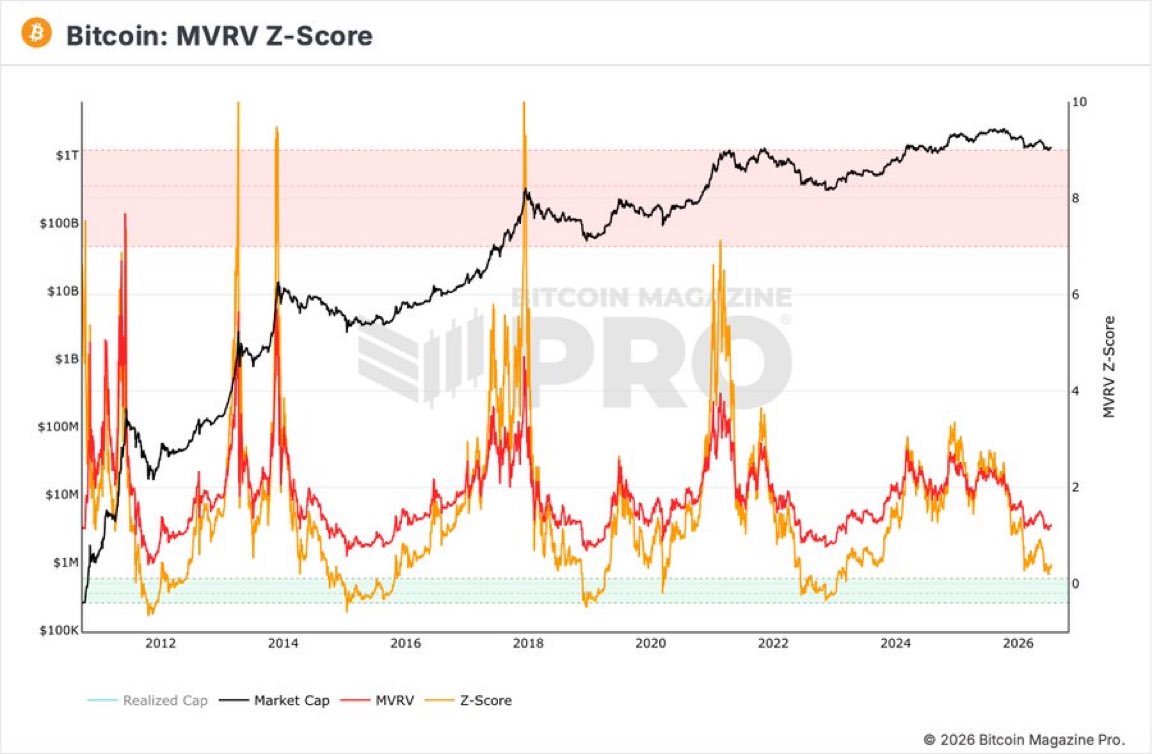
Bitcoin never reached the historical MVRV capitulation zone this cycle
Either one final flush is coming…
Or everyone waiting for old cycle metrics is about to get left behind
Is this another dot-com bubble?
This chart shows how much money sits inside the stock market relative to all the money that exists. The Stock market is 3x bigger than all the money available in the economy.
It’s hovering near its own 2000 era peak, no wonder traditional investors are sounding the alarm about the next bubble.
So the question writes itself: are we here again?
This ratio has 2 numbers:
- Top: market cap
- Bottom: M2 (money supply)
Only watching the top misses the other half.
In 2000, the bottom was growing. M2 expanded and the ratio still tripled. That tells you the move came almost entirely from price. Money inside the market relative to money that existed had run genuinely too hot.
This time, the bottom did something different. M2 peaked in April 2022, then contracted and did not regain its high until March 2025. For three years the denominator shrank while price climbed. Part of the parabola you are looking at is arithmetic.
Every system has limits to growth. The strongest driver, the reinforcing loop, is often the same force that ends the run.
AI capex feeds earnings expectations, which feed market cap, which feed more capex. The loop spins. If the driver does not limit itself, a balancing loop arrives uninvited: less money supply, tighter liquidity. The system gets forced back to balance.
So is this dot com again?
I do not think so, yet. We happened to find a new investable technology AI which the internet itself gave birth to. Record revenue earned across the whole world. The names carrying the index actually have cash flow. M2 now reaccelerating to fresh records above 22 trillion. So from here the ratio can only keep rising.
Predicting when this ends will give you sleepless nights. Nobody times the top of a reinforcing loop. You do not need the date. You need the flows.
Understand the flows feeding the stock and watch them carefully, and you are already thinking like the top 10%.
Act on what they tell you, and you become the top 1% of market operators.
The chart tells us how far price reached last time.
The inflows tell us when the move is running out of juice.
This is true. Eventually, every country will follow this path, but the one that does it first will take the lead in the global economy - without wars, without killing, and without seizing territories.
$BTC
Close the monthly above $61k and we're looking kinda good, the higher the better
Below or at $61k and it starts looking like a pity bounce and we might have to prepare for a move to the next support ($45k)