Have an election event coming up that can’t fail? 🚀⏱🗳
Learn how #AWS Countdown Premium helps organizations like @redoakstrategic optimize their cloud infrastructure and get rapid support for their business-critical events.
@AWSSupport 👉 https://t.co/yhWrIEMXg5
Have an election event coming up that can’t fail? 🚀⏱🗳
Learn how #AWS Countdown Premium helps organizations like @redoakstrategic optimize their cloud infrastructure and get rapid support for their business-critical events.
@AWSSupport 👉 https://t.co/yhWrIEMXg5
fwiw, on the data front the Iowa GOP caucus was one of the best prepared elections I have worked on. They released live precinct results, published a list of final precinct names a week (!) in advance and ran daily tests of their results distribution system.
We’re beta launching #MetroPulse (previously MetroMeter), an interactive web tool that gives real-time customer info + system performance data. #MetroPulse demonstrates our commitment to improving customer experience & transparency. Explore it now: https://t.co/x8MdtoG0W5 #wmata
Pleased to announce the kickstart of seed round with $1M in non-dilutive funds from @NSF to accelerate development of our #blockchain#HealthTech solution for #PriorAuth. Let's #FixPriorAuth and support better #healthcare.
https://t.co/9Z4qcS3LH6
Hey #rstats users -- any advice on how to create a variance analysis model like PROC VARCOMP in SAS (Equation 1 in this link: https://t.co/B8Bp32VpZS) in R? I think it's something like a 3-way mixed model w/random effects but not sure 😬@rstatstweet @rstats4ds @rstats_tweets
@colin_fraser do_if() is a great idea, a bit sloppy but I’ve found myself using the same pattern a “conditional pipe” a lot. It works the same way with {if(logical condition) function else .} %>%
It does block the . usage but ends up making my code more compact/flexible. do_if() looks cleaner
@hlynur @rstats4ds I believe the newest version can handle dplyr::glimpse() if you just need a quick view though I know that is a different output than head(10)
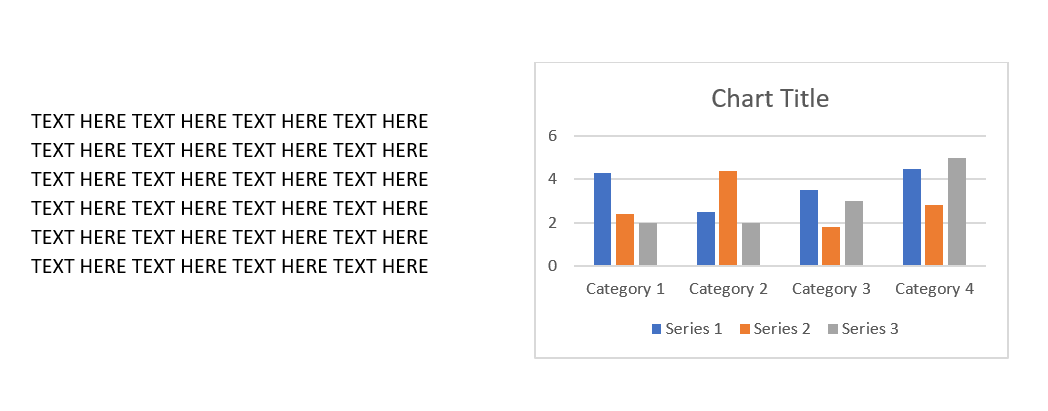
Have been stumped on this one: any #RStats users know a ~relatively~ easy way to place text side-by-side a ggplot figure when rendering an rmd to pdf? #tidyverse#dplyr#rstudio
Would want the output to look similar to this:
@drdavidtang @rstats4ds If your data and use case allow you could consider pivot_longer([selected columns]), group by the “names_to” column and then summarizing on the “values_to” column which would output your grouped summaries in one go