Geospatial Scientist, UMD Alum. Meteorology Nerd. Love the Outdoors, Baseball, Puzzle/Strategy Games, Landscape Design, & Other Random Stuff. *Posts Are My Own*
Coming soon: a brand new GSDM website.
I know that some of you were users of the now defunct GSDM website which had replicated the original ESRL-hosted site where you could access the GWO, Hovmollers of AAM anomalies and its forcings (budget terms). I have rebuilt this from scratch using the new CORe data set. The v2.0 site will be MUCH richer, offering AAM analogs, LIM forecasts, regional contributions for AAM (as well as TauM), wind vector maps highlighting which wind perturbations are most strongly contributing to the zonal mean structures, detailed guidance on how to interpret the data and more! The idea is to better enable users to connect diagnosis of the general circulation to what it means for the forecast. A few sample plots below to whet the appetite!
Storm-following radar loop from KFDR and KFWS of the entire lifecycle of the massive tornadic supercell in TX last night, with one of the wildest reflectivity evolutions I have ever seen
-- About Recent SPC Forecast Performance --
The story below from NBC, and others on the less-than-2% outlook's tornado occurrences in KS, some of which also note the watchless tornadoes in Lower MI earlier this year, grossly oversimplify reality on the SPC forecast desk. They rely on a lot of idle speculation by people who haven't worked it and just don't know.
I've done SPC outlooks for decades, and as usual, will be brutally honest here. I know how it works there, from the inside. Read and learn. These insights don't lend themselves to 10-second attention spans nor quick sound bites. So this is long. Don't "TLDR" this post if you really care about actually learning how it works.
I'll put the bottom line here, near the top: Chances are there is ***no smoking gun***. That may not suit rage-baiting and click-baiting, but it's simply reality. That's the lede. Here's the rest...
Why no smoking gun? Far too much goes into a forecast to lay "blame" at any one factor. Like it or not, bad forecasts happen. They always have and always will. The aim is to reduce them over years, knowing that some events are so localized and/or extreme that both human and computer forecasts can't always nail them down. That's reality.
Until forecasters have extremely high-resolution sampling of the real atmosphere on scales storms form and operate (a few miles), even the most sophisticated models, both from traditional, physics-based and AI/statistical packages, will suffer sometimes with localized subtleties. Guess what's involved in forming a dryline storm here vs. somewhere else, amidst capping and modest broader left? You got it, friends, localized subtleties.
Yes, observational balloon data were missing and are, in bulk, important to models. Several scientific papers have shown this. *Maybe* that mattered here. Maybe it did not. Satellite-derived data matter too, and often more. How important was the lack of radiosondes to this case on this day? We don't know. As Alan Gerard alludes in his quote in the NBC story: that needs to be studied (using data-denial experiments). Until then, it's speculation to say how much that altered output at any of many levels of the atmosphere, from models that *variably* and *incompletely* influenced the outlook's positioning here.
*Numerous* models are examined every forecast cycle, especially early-arriving deterministic ones, ensembles, and newer/quickly computed AI packages that work off historic pattern recognition. How they may be affected by missing input data can vary from model to model and by data type. It can be such a dense black box that such effects are simply unknown to the forecasters. We're not, and cannot be, privy to every nook and cranny of their physics or statistical equations. Forecasters often notice and account for model biases, but where they come from can be quite complex and not just tied to one factor.
Between that and diagnostics that should precede models, it can be a veritable firehose of information, on deadline. With time, experience, on-shift mentorship of the leads and senior outlookers, and training, forecasters get better at situationally prioritizing what to drink from that firehose, when, how, and why. It is simply impossible to examine every possible diagnostic and prognostic detail from every data source.
Models are not all that go into a forecast. So do diagnostics: analyses of surface and upper-air data. The latter factually do have holes that may cause analysis to miss subtle features, but was that true here? We don't know yet. Other diagnostics, such as satellite and radar-indicated features, and intangibles such as reading, research, forecaster experience, and intuition with specific situations, also play a role.
It's even more speculative, and likely inaccurate, to say the lack of greater staffing affected the outlooks in these cases so far. [That isn't to say it can't, or won't, the rest of the season.] Though I recently retired, and was not a participant in these forecasts, I do know the principals involved. Everyone who did the outlooks for the KS day were working normal 8-hour shifts and not overtime. If "exhaustion" or "fatigue" were factors, it comes simply from the nature of rotating shift work, which is documented to be unhealthy mentally and physically, and a known carcinogen. Don't knock it 'til you've done it.
Yes, with two retirements last month, 5 openings (out of 10 positions or 50% vacant) are on the SPC outlook/mesoscale desk. That is unprecedented. They need to be permanently filled with full-time forecasters, stat! A lot of fill-in shifts by both managers (one of whom is an extremely sharp and highly experienced forecaster), and less-tenured forecasters, will be needed until those are filled. Results may vary.
That won't help, and yes, it might hurt! But it's premature and speculative to pin any single forecast performance so far, or the rest of this season, just on that. Again, forecasts sometimes simply miss. SPC has a well-earned reputation for, and internally motivated standard of, excellence. Excellence is not synonymous with perfection. Even I had some bad forecast decisions I'd like to have back. ;-)
Outlooks at SPC do not happen in a vacuum. One or two names may appear thereon, but it's a team forecast. Internal collaboration is required. External coordination with involved WFOs is strongly encouraged if major changes are being made to a previous outlook. Otherwise, there is not enough time to coordinate every part of every outlook line with every involved WFO, who themselves also are busy with other tasks. Every minute doing that is a minute not spent doing meteorology. So there must be a balance achieved on deadline.
I don't know for sure here, but it is possible that the 2% and 5% tornado lines that drove the "MRGL" and "SLGT" areas were suggested by, or compromised with, the WFOs serving eastern KS. Only they and the SPC forecasters on duty could verify either way.
And even everything I've typed is just a superficial, condensed summary of the outlook forecast process. I did thousands of them, both the graphics and long-form text discussions, so give me the benefit of the doubt here.
A reduction in balloon launches definitely doesn’t make NWP better, but to be frank the number of in-situ soundings assimilated into NWP from aircraft takeoffs and landings dwarfs NWS balloons, which is itself dwarfed by data from satellite retrievals.
I live in a high rise apartment in an urban area. I think you’re looking at this from the wrong perspective. People aren’t necessarily “scared” of condos and walkable cities, it’s the extra space for kids/pets (more square footage for less $$$ and land+green space). If you’re young/single or don’t have kids, an urban condo probably makes more sense. And NGL, people don’t like being lectured on where/how they should live (not that it’s intentional, it just comes off that way sometimes). The urbanist community needs to market its ideas better.
We had one of these when I was a kid, it split down the middle on a windy day while I was playing outside and it nearly crushed me. Basically every time it gets windy at least one or two of these trees will be down in the area. That said, are laws like this really what the MD legislature is wasting their time on? 😂 It should be the least of their worries right now.
Strong EFI signal (max temps shown) for highly anomalous heat from the OH/TN Valleys into the Mid-Atlantic & Southeast next week. For context- these focus on air temperatures, not heat indices. Numerous record highs & lows are likely. A >0.9 signal on Days 5-7 is exceptional.
@T_connifer@YIMBYLAND It’s thermodynamics-101, homie. UHI introduces significant nocturnal cooling burden, it can be >10°F warmer in a dense urban core at night relative to surrounding suburbs less than a mile away. And that’s only 1 issue with this scenario. 😆
@webberweather@WEschenbach Some things are evident enough on their own. 😉 And you have a very large following with a unique opportunity to help rebuild public trust in climate science, which is integral to our future. But alas, to each their own. No judgement from me.
Even if the dude is full of shit there are more scientifically credible methods of refuting an argument. Sociological studies demonstrate that neutral audiences are generally repulsed by Ad Hominem attacks, and with science under relentless attack by the current administration, the last thing we need is to give ammo to bad faith actors.
Please stop forecasting using simulated reflectivity for severe weather events, as it's bad meteorology. Yes, uncertainty is always present when a previous day's QLCS moves into the region. The environment/synoptics is still supportive of severe, but failure modes always exist.
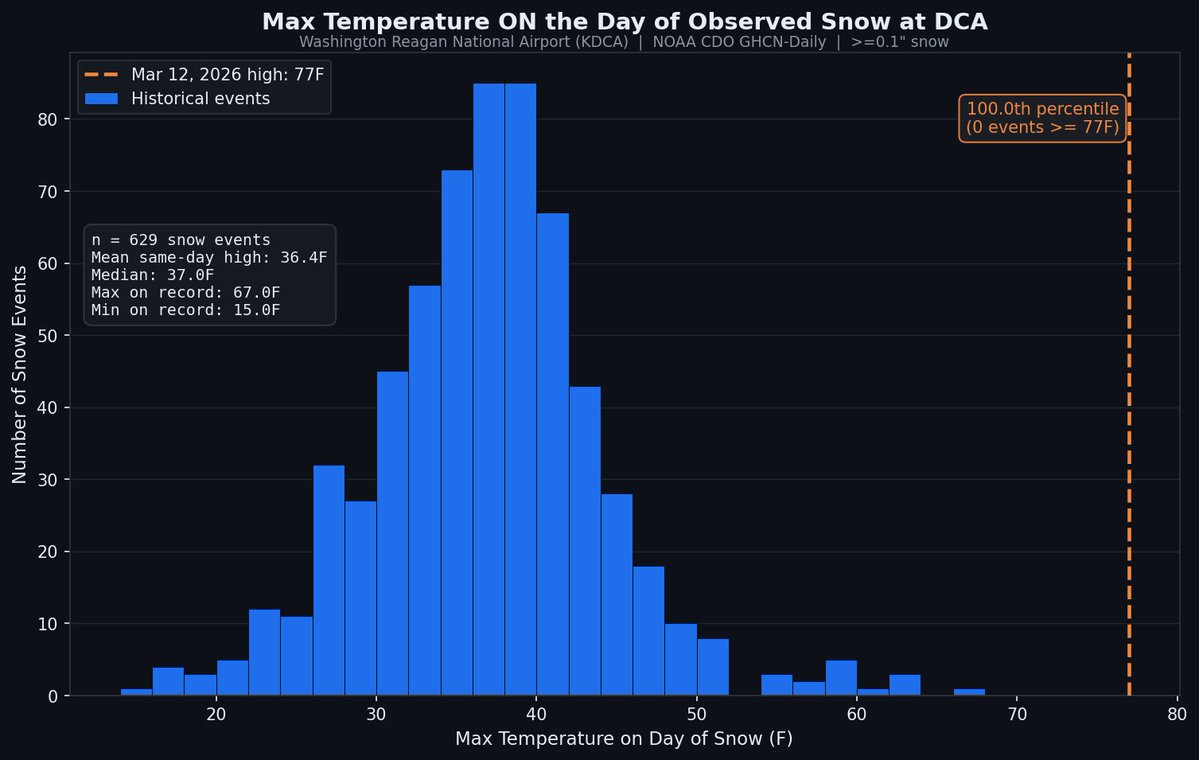
DCA officially recorded 0.1” of snow and putting things into historical perspective this was the most improbable snowfall EVER! And wasn’t even close.
This happened after a previous day high of 86 and midnight high of 77!
Old records respectively:
74 on 4/7/72
67 on 11/11/95
BREAKING: A possible WORLD record hailstone has been recovered in Kankakee, Illinois from Monday night’s storms. It reportedly is 8 inches across!
That’s approximately the size of a miniature football or a large melon.
That’s corroborated by numerous other “gargantuan” 6+ inch stones found nearby. The former Illinois state record was 4.75 inches. The currently-certified U.S. national record, and world record, is a from an 8-inch stone that fell on Vivian, S.D. on July 23, 2010.
Val Castor also found a 7.25 inch stone near Vigo Park, Texas on June 2, 2024.
So what about this hailstone? It’s HUGE. The National Weather Service has been informed, along with several researchers.
Other records around the world:
South America: The February 8, 2018 Córdoba, Argentina hailstone stands as the South American record at 7.4 to 9.3 inches across. That figure came from photogrammetry, or mathematical estimation from videos… not a direct measurement.
Africa: Tripoli, Libya experienced 7 inch hailstones on October 27, 2020.
Europe: A 7.48-inch hailstone fell on Azzano Decimo on July 24, 2023. That’s about 50 miles northeast of Venice, Italy, or 60 miles northwest of Trieste.
Asia: On the night of March 2, 2025, a 5.5-inch hailstone fell on Zhangpu in Fujian Province, China.
Australia: A 6.3-inch (16 centimeter) hailstone fell in Yalboroo, Queensland, Australia on October 19, 2021
I’m not yet convinced this event will exceed moderate threshold by conventional metrics (although I’m increasingly skeptical of the practical applicability of said metrics). From the in-situ IPWP dual cell mode(s) I would be surprised to see a niño evolve from an EPAC basis like 23/24 (beyond something transitory). Although I’ve been wrong before, so I might change my mind later. 🫠
@JackRuddenWX@NWS_BaltWash Interesting cycle to gusts today, they pulse very high for ~10mins then go slack for 25-30mins. Not sure why that is, maybe mountain waves/eddies.