The last FOMC gave me at least one clear direction on yield curve.
I believe US yield curve is set to resteepen… the chart below from 13D shows the correlation of yield curve shape with Gold prices.
Snippet courtesy 13D
@sahilnandu
Deutsche Bank is the first major bank to agree that gold could go to $14000 (per ounce) in a scenario where emerging market countries (read BRICS) flee towards gold
Imagine what would happen if Western countries did the same ..
Gold Is Being Spent
By Vikas Sehgal
And that’s why it’s becoming money again
In the late summer of 1947, my family ran.
We are Punjabi. My family was forced to migrate under threat of Muslim violence to India. My grandmother carried her children and ran from Muslim mobs, leaving behind a life that could not be packed or priced.
She didn’t carry bonds.
She didn’t carry a bank cheque book.
She didn’t carry grains or silk.
She carried gold.
Not because it was tradition.
Because it was survival.
And that gold did not sit idle.
It paid for the first meals.
It secured shelter.
It was pawned to fund my father’s education.
It did exactly what it was supposed to do.
It carried value across collapse,
converted into liquidity when needed,
and rebuilt a life on the other side.
Had those earrings not been there—or had they not been gold—my father would likely have been hawking vegetables.
I would not be writing this.
That is the return on gold.
And what came after was not just survival.
It was a reset.
A new life, funded by something that held its value when everything else failed.
The gold was spent.
The value was not.
Gold was not wealth.
It was continuity.
And if you zoom out far enough, that same pattern—personal then, sovereign now—repeats with almost uncomfortable precision.
When a system comes under pressure—war, fiscal collapse, or external shock—it does not abandon gold. It reaches for it. Gold sits at the very end of the hierarchy, untouched in normal times, but decisive when survival is at stake.
In crisis, assets reveal their true order.
Illiquid gets trapped.
Liquid gets volatile.
Political gets constrained.
Only neutral gets spent.
That last category has only one asset.
Gold.
One of the clearest examples comes from Second Punic War. Rome was pushed to the brink after a series of devastating defeats. Entire armies were wiped out, allies were wavering, and the cost of rebuilding both military capacity and political cohesion was immense. Revenue flows were insufficient, and time was not a luxury the state had. In response, Rome mobilized its reserves—drawing from temple treasuries, melting accumulated gold and silver, and converting them into coinage to fund the war effort. Wealth that had long been symbolic and sacred was turned into liquidity. This was not collapse; it was conversion. And it worked. Rome stabilized, endured, and ultimately emerged as the dominant Mediterranean power.
A similar dynamic appears centuries later under Heraclius during the Byzantine–Persian wars. The empire was under extreme strain, with territory lost and finances deteriorating rapidly. Heraclius made the politically and religiously difficult decision to strip gold and silver from churches, melt them down, and mint coin to finance a final campaign. Once again, assets considered untouchable in normal times were mobilized because the system had no other viable options. And again, this act bought time—enough for the empire to mount a successful counteroffensive and stabilize itself.
You don’t have to go that far back. A modern and far more relevant example sits with India in 1991. Facing a balance of payments crisis, India quite literally ran out of dollars. Imports were at risk, credibility was collapsing, and external funding had shut down. What followed was politically painful and nationally embarrassing: India pledged its gold reserves—physically shipping them abroad—to raise emergency liquidity. It was not a choice made in strength. It was a necessity forced by arithmetic. But that act bought time. And that time enabled reform. What followed was not decline, but transformation—the post-1991 liberalization that reset India’s economic trajectory.
This is the pattern, stripped of ideology. Gold is not what you sell when you are wrong. It is what you use when you have no time left.
Now bring that forward into the present, because what we are seeing today is not random selling. It is structured. It falls into three distinct regimes.
Call it The Three Faces of Gold Under Stress.
First, Gold as Liquidity — The GCC Model. Surplus systems don’t break easily, but when cash flow tightens, they need immediate liquidity without destabilizing their broader balance sheet. The GCC historically recycled oil revenues into gold, U.S. Treasuries, and strategic assets in the West. But in crisis, those assets behave very differently. Selling trophy assets—football clubs, marquee stakes—is slow, politically visible, and value-destructive. Incremental equity sales collapse marginal pricing. U.S. Treasuries, while liquid, are not entirely neutral in a world where security and finance intersect. That leaves gold as the only asset that is deep, liquid, and apolitical.
Every other asset has a market.
Gold has a clearing price.
Everything else is sold at a discount in stress.
Gold is sold at a price.
If a sovereign were forced to sell a marquee asset like McLaren in stress, it would clear at a discount—possibly a severe one. But gold, even when sold in size, clears at a global benchmark price. No negotiation. No stigma. No cascading collapse in marginal value.
When the GCC sells gold, it is not distress—it is precision. It is extracting liquidity from strength without breaking anything else on the balance sheet.
Second, Gold as Bridge — The Turkey Model. Here the system is already under pressure. External deficits, currency instability, and constrained access to dollar funding force action. Gold is sold to raise dollars, and those dollars buy time—time to stabilize the currency, manage imports, and prevent disorder.
And this is not incidental.
Over the last five years, Turkey has been one of the most aggressive official buyers of gold globally—accumulating roughly 400–500 tonnes of gold reserves between 2018 and 2023. That stockpile did not sit idle. It became a usable buffer when external pressure intensified.
This is not a view on gold.
It is a function of preparation.
Gold becomes the bridge between stress and stability.
Third, Gold as Power — The Russia Model. This is not about liquidity or survival. This is about architecture. Russia is not selling gold to access the dollar system; it is using gold to bypass it. Gold is redirected into alternative settlement systems, exchanged for yuan, or absorbed domestically. This is not supply flooding the market—it is supply being redirected and, in many cases, removed from global float. Gold here becomes a monetary base for a parallel system. Not a reserve. Not a hedge. A foundation.
Three different motives. Three different systems. One identical conclusion.
Gold is the only asset that survives all three.
And the next set of countries is already visible. South Africa has a tangible buffer—it has gold. That gives it optionality. It can convert reserves into time if needed. But countries like Pakistan or Sri Lanka operate with far less room. When pressure builds, adjustment is sharper and more disorderly because the cleanest lever—gold—is limited.
That asymmetry is the real story. Gold is not just a reserve. It is optionality under stress.
And this is where the market gets it wrong. Gold selling is framed as bearish, as if supply defines value. But the fact that gold is the asset being sold—across all three regimes—tells you something far more important. It is the only asset that can be mobilized at scale, under stress, without collapsing its own price or signaling systemic failure.
Even when prices soften, that softness is misleading. Because unlike equities, private assets, or strategic holdings, gold does not gap down under pressure. It clears. Continuously. Globally. Credibly.
Watch what happens the next time the dollar tightens sharply.
Not what countries say—what they sell.
That difference is everything.
So step back and strip away the noise.
Every system under stress is doing the same thing. Not the same trade—the same choice. Selling what is political. Avoiding what is fragile. Holding on to what cannot fail. And when nothing else works, they reach for gold.
Not Treasuries. Not equities. Not promises.
Gold.
That should tell you everything about what money really is.
Because in theory, U.S. Treasuries are the safest asset in the world.
In practice, they are still someone else’s liability.
Treasuries require trust in the system.
Gold is what remains when that trust breaks.
And in a world that is fragmenting, that difference stops being academic. It becomes decisive.
Because I have seen what happens when the system disappears.
In 1947, my grandmother didn’t carry financial assets.
She carried gold.
And had those earrings not been there—or had they not been gold—my father would not have completed his education.
He would likely have been hawking vegetables.
I would not be writing this.
That is what gold is.
(Vikas is investor with @PineTreeMacro )
Whew.
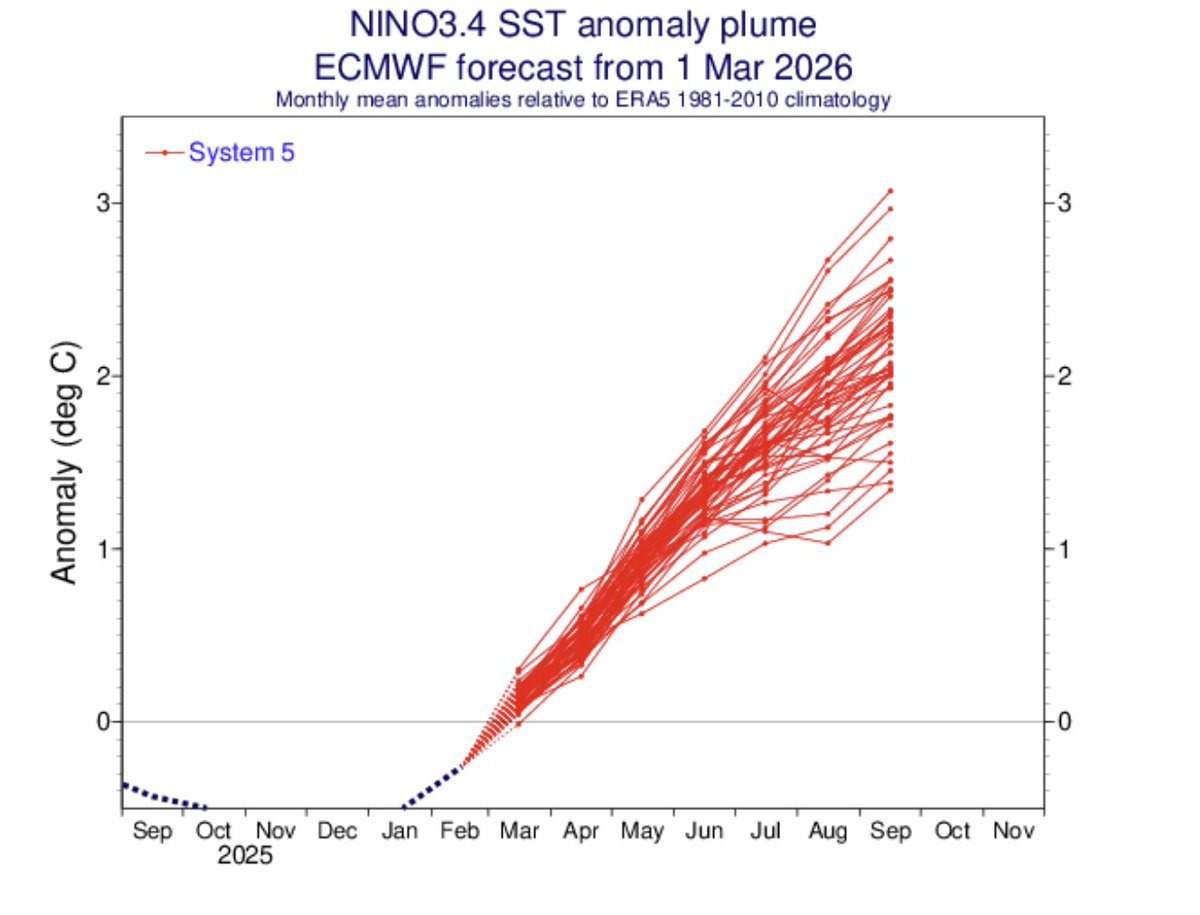
All signs are increasingly pointing to a significant, if not strong to very strong, El Niño event. I'll have more to say in coming weeks & months, but for now I'll just say that this is increasingly likely to become a major regional-to-global climate driver in 2026-2027.
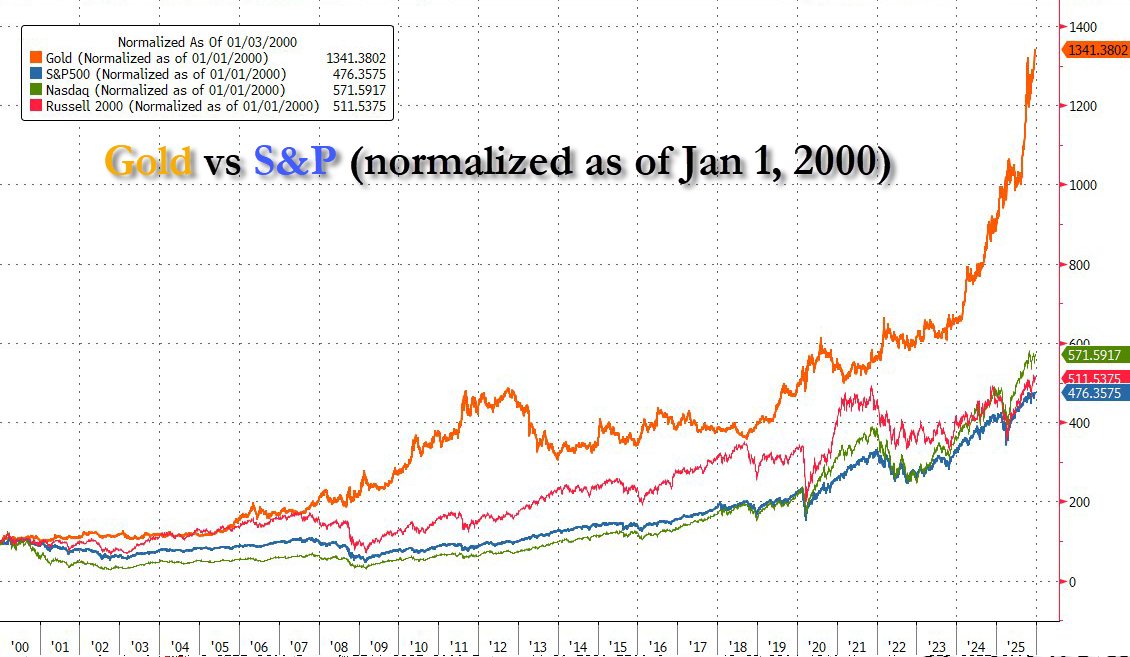
In the greatest century for technological advancement in the history of humanity, the world's best performing stock market has been outperformed by a mineral.... three-fold
China showed what happens when deposit yields are crushed: households quietly walked out of the banking system and into gold. India is now starting the same journey as RBI cuts ripple through SBI and HDFC fixed‑deposit rates, turning post‑inflation real returns close to zero.
1/ When a country kills the return on deposits, savers don’t argue on TV panels—they just move their money. China did this a decade ago, and households quietly shifted from bank deposits into gold and property.
2/ India is now entering the same phase. RBI has started cutting, banks are trimming FD rates, and for many households the real return after inflation is barely positive, sometimes negative.
3/ Indians have already lived through roughly 5 years of steep cumulative inflation. Even if today’s CPI looks “under control”, the price shock is baked in and shows up as an affordability crisis, not a headline‑inflation crisis.
4/ So when FD rates fall again, the message to savers is simple: keep subsidising the system with low returns, or move to something that at least has a chance of preserving purchasing power.
5/ Two natural outlets appear:
•Spend more today (homes, cars, lifestyle) instead of locking money in a dead instrument.
•Move long‑term savings into assets—especially physical gold and equities.
6/ That is exactly what Chinese households did when their deposit rates were slashed. They didn’t debate “financial repression”; they just bought bars, coins and real estate with both hands ( but not equities)
7/ Indian households are set up to respond even more aggressively: a cultural bias for gold, scepticism of financial assets, and a lived memory that gold protected them far better than currencies or policy promises.
8/ Every incremental rate cut from here is not just “pro‑growth”; it accelerates money leaving the banking system and entering two channels: consumption today and gold for tomorrow.
9/ In a few years, the real story may not be who bought the right tech stock, but how Indian households once again front‑ran the macro by exiting low‑yield deposits and loading up on gold.
10/ China wrote the playbook. India is now running its own version: kill deposit returns, push savers into hard assets, and let households quietly rewire the financial system from the bottom up.
REITs are often bought for ‘passive income from real estate’ without actually owning the property. We looked at payout data since 2022 to ask: did the income match the yield you’d expect, and did payouts keep rising every year?
Here’s a Varsity explainer, plus the biggest REIT myth.
A short note on Q2FY26 numbers.
The 16.5% PAT growth for Nifty 500 (reported) firms saw a 4.5% contribution from just three companies.
The three OMCs added ₹16,250 crore to the ₹61,000 crore cumulative PAT increase reported in Q2FY26 by the 476/500 firms that have reported so far.
If you adjust for other oil companies like MRPL and Chennai Petro, and for fertilizer companies, the number falls another 5%.
And then there are Metals and Tata Motors…
Why are these adjustments needed? Are they even logical?
Oil and OMC numbers are steady to below average when adjusted for the business cycle. They appear so large (a 9x jump for the three OMCs in Q2FY26) because Q2FY25 was unusually depressed. (IOC reported a 99% decline in earnings in Q2FY25.)
Commodity profits are cyclical and account for large swings. You can choose not to ignore them at all. Even after accounting for metals, the broader market universe is still reporting steady-state growth of around 10%—a far cry from valuations at 25x trailing earnings.
Also remember that sales growth of 6–8% is below even nominal GDP growth.
The PAT numbers being reported are at near-record margins. Efficiency gains are already fully baked into the bottom line.
Q: What will take profits back to 20% growth, where 25x multiples will be justified?
It has to be sales growth, because there is hardly any room for margins to improve.
How much is the sales growth?
Mid-single digits.
What constitutes this sales growth?
Domestic businesses (driven by India’s nominal GDP growth) plus exporters (IT, pharma, and commodity-linked businesses, with pricing driven from overseas).
None of these segments—except in patches—are showing numbers in excess of 10% year-on-year.
There are, of course, solutions to correct this. But I am not a policymaker; just a person watching these numbers objectively.
Do your own analysis before believing my or anyone’s numbers and cuts.
Only if you have read and understood the last 50 years of USD reserve currency status .. you will be able to appreciate the thought process from @LukeGromen
Via this week FFTT
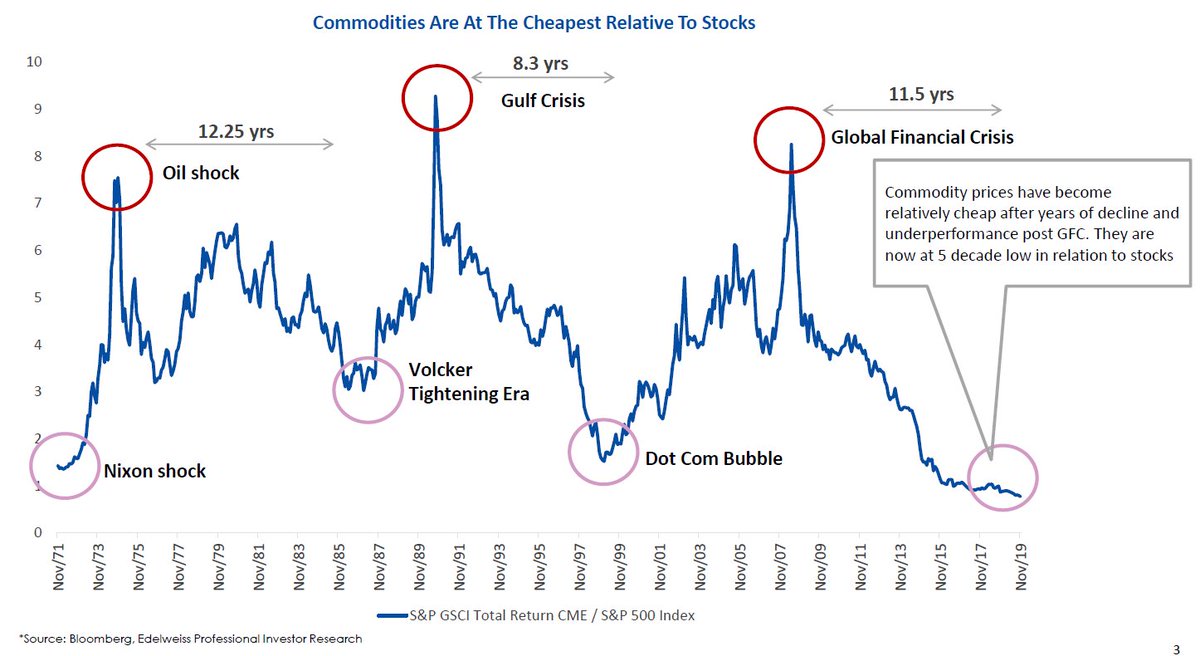
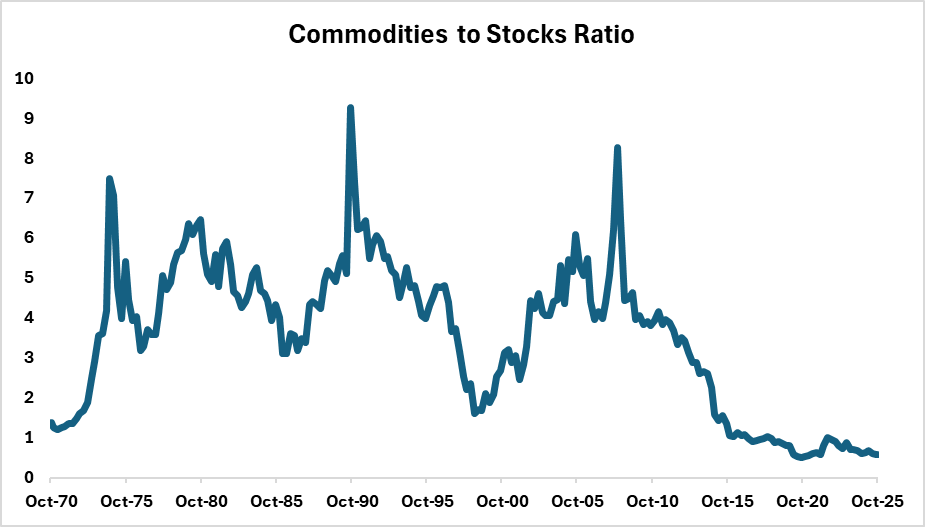
The problem with Commodity / Stock ratio charts
First, look at the following chart I made in 2019. (incidentally, I made the same chart in 2015 as well, but unable to find an online version of it).
Then, I made this chart in 2021 (rom DSP Netra Oct'21)
If you look carefully this chart, if made in 2015, also showed a multi decadal extreme, as if a screaming commodity long trade. But it is not.
When making commodity to stock ratios, only two judgement should be made:
1. Only use these ratios to ascertain whether Gold (a monetary asset is cheap or not). Other commodities are consumption commodities and not assets. Comparing them to yielding assets like stocks and bonds is a mistake.
2. Make sure that non-linearity works in your favour. This means for yield assets, attempt only to ascertain bargains and not whether something has become too expensive.
If you look carefully, rapid rally in the above ratio, which indicates sharp bull market in commodities Vs stocks has happened when stocks fell sharpy (during crisis) or Crude Oil prices rocketed higher (cyclical).
This is how it looks like today:
So, the problem with these ratio charts:
1. Gold to stock index, or Nifty to Gold or some other ratios, DO NOT HAVE timing or predictive value. The reason is that the underlying assets are fundamentally different and there isn't a trade-off by owning one over the other. In fact, for many periods they are uncorrelated, which is the reason why Multi-Asset Strategy works.
2. You can spend a large part of your investing career waiting for these charts to move. When they do it is very likely that you would be significantly underexposed to what does well and over-exposed to what is likely to fall rapidly.
Be careful in using this type of analysis to make any investment commitments.
Look at those margins.
Gold at $4,000 has completely repriced the mining business.
The sector went from survival mode to free cash flow machines.
The market still hasn’t caught on.
How to ascertain whether we are a short squeeze or supply shortage?
Silver is a hot topic. A lot of news and views are being reported on 'Supply Shortage' driving prices higher.
It is notable that this is the 5th year of a supply deficit in Silver (we have noted it DSPNetra for years). But it has made news now because prices have spiked over $50, to new all-time highs.
A front-end kink of backwardation is also visible in the Silver spot market. This has made it 'mandatory' (in a twisted sense) for everyone to talk about Silver supply shortage.
I am going to use the Silver futures market to show how to ascertain the difference between - A supply shortage Vs a short squeeze.
Two notable terms first.
Contango vs backwardation:
Contango = futures above spot due to cost of carry. A normal condition for commodities because the buyer has to pay for storage, hence futures trade at a premium over spot prices. Usually, the longer dated futures you pick, the higher the prices.
Backwardation = spot above futures due to urgent near-term demand. A bullish condition. This happens when the demand in the spot / near term is so high that traders and buyers are read to pay more upfront.
What is a short squeeze?
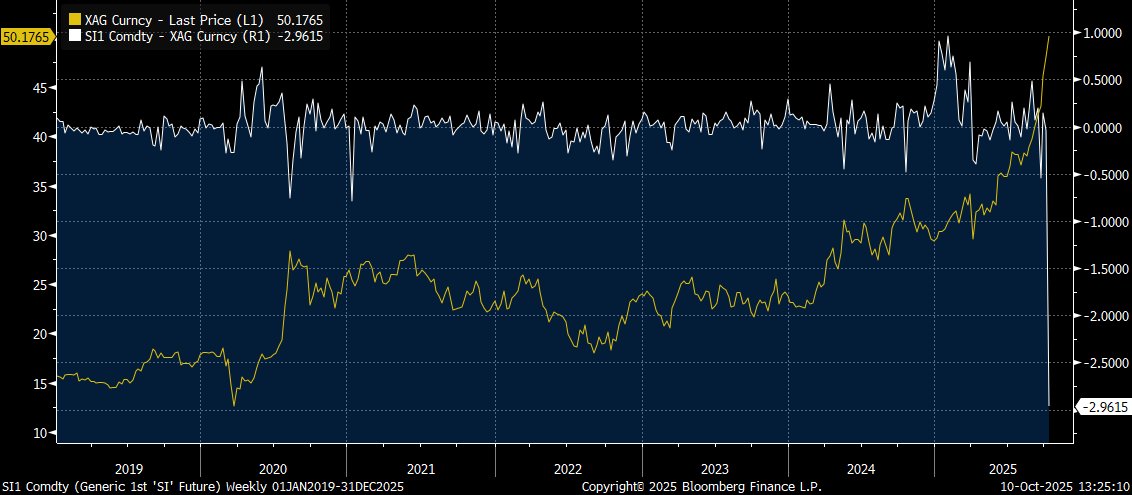
Spot minus most-active futures (S–Front) spikes sharply positive. Front month dives into deep backwardation. 2nd and back months stay flat or in mild contango. This is typically driven by massive speculative build-up in the near-term futures and the spot market. A market which runs in a deficit or have large speculative shorts (both in case of Silver) can have very high backwardation.
What is 'very high' backwardation?
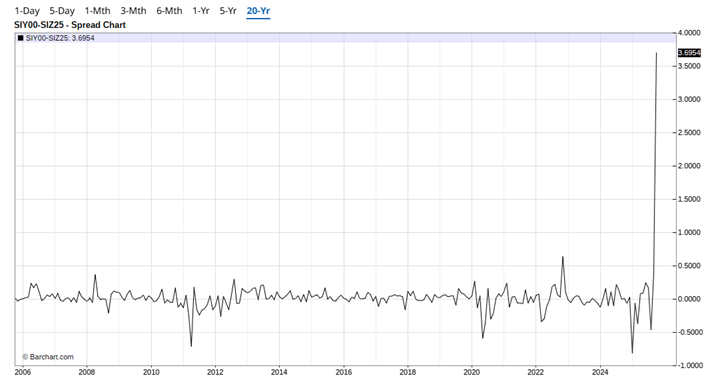
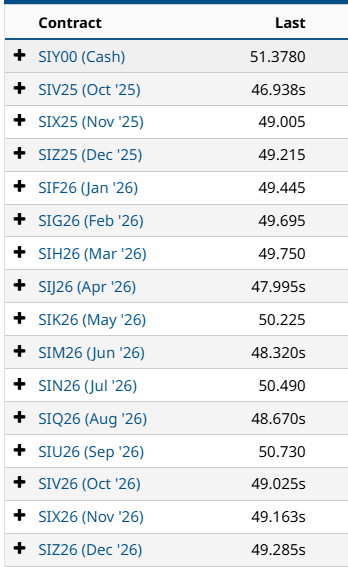
For instance, currently the Silver backwardation is ~33% annualized (Spot - Dec'25 Futs spread at 3.6 vs spot price of 51.3, 78 days to expiry). This is akin to seller receiving multiple quarter of cost of carry).
A short squeeze is characterized by a single “front-kink” only. Back months remain unimpressed. Inversion fades after delivery or roll. It is usually a short period phenomenon.
What is a supply shortage?
S–Front is positive and the inversion continue into 2nd, 3rd, 6th and even 12th month. Multiple contracts trade below spot. This is a condition where buyers are ready to pay up because they fear unavailability even in the months and quarters ahead. (The most stubborn form of supply shortage was visible in Copper forwards in 2005 to 2007).
In a supply shortage the whole futures curve moves into backwardation up to longer-dated contracts. Broad and persistent inversion.
How to test quickly:
Check S–Front and 1–2 month, 2–3 month calendar spreads.
Squeeze = only nearby spreads are negative.
Shortage = negative across the futures curve strip.
Backwardation of days to weeks suggests a short squeeze. Months to quarters suggests supply shortage.
Cross-checks that help: Exchange inventories and deliverable stocks, lease rates, and EFPs. Brief spikes fit a squeeze. Sustained tightness fits a shortage.
What does Silver Curve look like at the S-Front end?
Take a look:
What does the whole Futures Curve look like?
What does the current data tell us?
Silver is undergoing a short squeeze.
Can this turn into a supply shortage?
Currently the futures curve doesn't show many signs. Best to keep a track.
What happens when the short squeeze is settled?
The spot price will fall back or converge with futures price. Usually, this happens when speculative short are covered and demand falls sharply. It can also be accompanied by sharp price falls.
Why this note?
Live market dynamics are a great teacher to revisit important concepts and take notes when they occur.
Ends.
The point the FT editorial writer doesn't get is that gold is not bought by central banks because they like its color, but because there is no current alternative reserve currency that satisfies the BRICS zone agenda.
Assets in $ & € have been frozen.
Here's a question I know many are wondering about: why did China wait until now to use rare earths as leverage against the US? Why not in the first Trump administration when the US started the trade hostilities? Or when the Biden administration unleashed the chips export controls 3 years ago?
I just watched a fascinating explanation by a Chinese analyst and, unexpectedly, a big part of the explanation is... helium.
I had no idea but as he explains (source here: https://t.co/eUbbU5QIHW), all the way until 2022 China imported 95% of its helium and most of it was controlled by the US. Of the world's ten largest helium producers, four were American companies, and the remaining six all used American technology.
Helium isn't just a party balloons gas: it has plenty of industrial applications for things such as quantum computing, rocket technology, MRI machines, as a coolant for chip lithography equipment, etc.
In a nutshell what he's explaining is that with helium the US had an even stronger card to play if China ever used the rare earths card.
This raised huge alarm bells inside China. In an article published in late 2022 in the journal Frontiers in Environmental Science (https://t.co/eZhyv438LK), several researchers from PetroChina’s Beijing-based Research Institute of Petroleum Exploration and Development stressed that China would be greatly affected if the US imposed a “stranglehold” blockade on helium exports.
So over the past few years there were gigantic efforts in China to break the "helium shackles," with seven helium extraction facilities going into production, and China also switching imports from the US in favor of imports from friendly countries like Russia.
China's research ecosystem also went into overdrive to find solutions to the helium dependency issues, with China's Academy of Sciences awarding its annual 2024 "Outstanding Science and Technology Achievement Prize" to a new helium extraction technology project (https://t.co/eWs163mfaO) because "these scientific and engineering achievements broke the long-standing monopoly of the US and ensured the security of China's helium resources" (https://t.co/d7YquWKFGS)
The result: by the end of 2024 China had cut its helium dependence on the US to less than 5% (https://t.co/wOxm8VRZJj). The "helium shackles" were broken.
That's what most people don't realize: power isn't about intentions or rhetoric - it's about what you can actually do. Many wonder why countries almost never retaliate when the US imposes sanctions or export controls. The answer is simple: they can't. They lack the alternatives, the technology, the supply chains.
China is the first country that systematically worked to eliminate every single pressure point, with humongous efforts. It's not just helium: it's chips, energy, telecommunication, pharmaceuticals, etc.
That's why the rare earth card can finally be played now. Not because China suddenly became aggressive, but because they have developed the capabilities to say "no."
Last word: as a European, this is both depressing and inspiring. Depressing because it highlights the immense magnitude of the task at hand to become genuinely sovereign and develop our own capabilities to say "no." Inspiring because China demonstrated that it can actually be done, and relatively fast if we execute competently. Although with the current crop of folks at the helm in Europe, that last part is admittedly a very, very big "if"...
⚡️What’s happening here is the clearest signal yet that Japan’s yield curve control (YCC) architecture has reached its endgame.
The Bank of Japan is trapped inside a reflexive feedback loop between two collapsing fronts: its sovereign debt market and its currency. The system can no longer protect both at once.
Let’s break it down precisely.
1. “Sacrificing the yen to save the bonds”is the the logical endpoint of YCC.
Japan has spent years trying to maintain the illusion of control over its yield curve by mechanically pinning long-term yields. But the longer that game runs, the more the market internalizes the asymmetry. Speculators know the BOJ must intervene on every spike in yields, so the moment yields rise, the market calls their bluff. Intervention becomes reflexive - not discretionary.
When the BOJ steps in to suppress yields (as the 30Y chart shows, an abrupt vertical collapse in yields), it does so by printing yen to buy bonds. That liquidity immediately spills into FX markets, where traders short the yen in anticipation of further debasement. So each round of bond defense automatically accelerates currency collapse.
2. This is a live demonstration of how debt-based systems die.
Every fiat regime eventually hits the same wall: the interest expense becomes unserviceable, so the state chooses between nominal default (bond collapse) or real default (currency debasement). Japan just picked the latter. The yen becomes the release valve for a bond market that can’t be allowed to clear.
This isn’t a temporary dislocation. It’s the structural expression of “too much duration in a world that lost its patience.” Japan is effectively exporting its yield curve tension into global FX volatility. The yen collapse is the price of sustaining the illusion that 250% debt-to-GDP can exist at 0-3% yields without implosion.
3. The deeper layer - the reflexive contagion risk.
If the yen breaks too far, foreign investors (especially U.S. funds and hedge structures) face forced deleveraging through the global carry trade. Japan’s cheap funding base has underwritten trillions in synthetic dollar exposure across global markets. When the yen devalues too quickly, carry costs spike, volatility rises, and those trades unwind violently.
The global liquidity system depends on Japan maintaining suppressed volatility in both yields and FX. If either side snaps, it forces a chain of deleveraging across emerging markets, U.S. credit spreads, and collateral chains in repo markets.
4. What makes this particular move extraordinary.
This yield crash wasn’t organic. It was surgical - likely a direct BOJ intervention triggered by political instability (the fiscal-dove PM news). The sequencing is clear:
•Yields spiked toward 3.35% on fiscal fears.
•BOJ intervened (bond-buying).
•Yields collapsed to 3.19%.
•Yen immediately devalued to 152+.
That’s not coincidence - that’s causality. The BOJ hit the bond panic button, and the FX market instantly repriced the cost of that decision.
5. The meta-layer - Japan as the mirror of the future.
Japan is the slowest-motion version of what every indebted developed economy faces: too much debt, no political will for austerity, and an aging demographic base dependent on yield repression. The only lever left is stealth inflation through currency devaluation.
The U.S., U.K., and Europe are only a few years behind on this curve. The difference is that Japan’s isolation and domestic funding allow the illusion to persist longer. But structurally, it’s the same architecture of debasement.
6. The scarv truth:
Japan is showing the world what “endgame central banking” looks like:
•Bonds can’t default.
•Currencies can.
•Intervention is permanent.
•“Markets” are now policy derivatives.
They didn’t “decide” to sacrifice the yen - the structure did. It’s the inevitable trade-off in a closed-loop system where every defense of the old world accelerates its decay.
What happened with this 10 year auction is a mirror reflecting a world that’s slowly changing how it views U.S. debt. The Treasury sold $39 billion in notes and had to pay slightly more than expected to move them, because foreign buyers, the lifeblood of long term demand pulled back hard. Indirect bidders, mostly central banks and sovereign funds, took only about 67 percent of the sale, down from 83 percent the month before. That’s a steep drop for a market that usually trades in quiet, incremental shifts. When those foreign bids fade, the Treasury has to lean more on domestic investors such as banks, pensions, and funds already stuffed with government paper. The only way to make them bite is with higher yields.
The global recycling loop that financed U.S. deficits for half a century is breaking down. The old model where America runs trade deficits, foreign exporters reinvest the dollars back into Treasuries worked when globalization was deepening and U.S. assets were unquestioned safe havens. That loop is fraying. China, Saudi Arabia, and other surplus nations are diversifying into gold, commodities, and regional partnerships. They’re not dumping Treasuries outright, but they’re no longer the automatic buyer of last resort.
This is what it looks like when the world begins to treat U.S. debt as one asset among many instead of the foundation of the financial system. The U.S. can still fund itself, but now it has to compete for capital. Yields will have to rise enough to attract private buyers or, if that becomes too painful, the Fed may quietly step back in to absorb supply through its balance sheet or liquidity programs. That’s the logic of fiscal dominance: policy starts revolving around the Treasury’s funding needs rather than inflation or employment targets.
Still, it’s worth interrogating how permanent this shift really is. A single auction can be skewed by timing, positioning, or hedging demand. The U.S. market remains unmatched in size and liquidity; there’s still no real substitute for the Treasury market’s depth and collateral function. It’s possible this was simply the market demanding a bit more compensation for uncertainty rather than signaling a global loss of faith. But the direction of travel matters. Each weak auction and each dip in foreign participation chips away at the assumption that the U.S. can issue without consequence.
So what we’re really seeing is the early stage of a structural recalibration. The dollar system isn’t collapsing, but it’s groaning under its own scale. The world still trusts U.S. debt, it just no longer trusts it blindly. The yield curve is now pricing that reality in real time with higher funding costs as America moves from the era of effortless demand to one where every dollar borrowed must be earned.